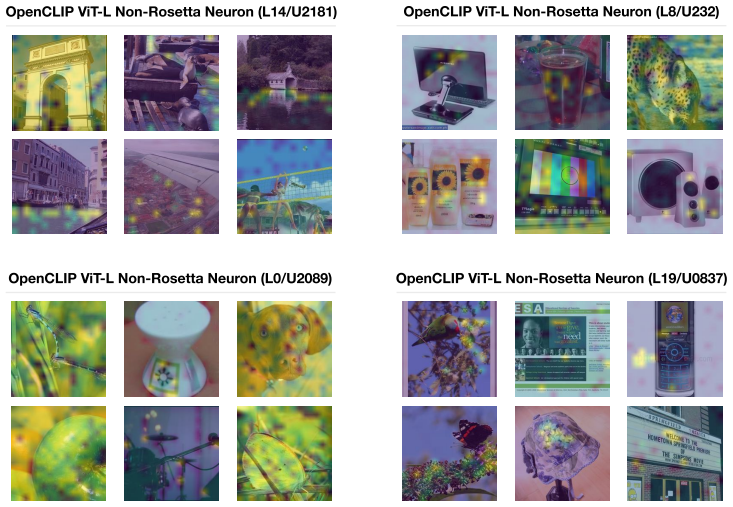
Neuron Populations Exhibit Divergent Selectivity with Scale
Pith reviewed 2026-06-28 10:47 UTC · model grok-4.3
The pith
Rosetta Neurons increase in absolute number but shrink as a fraction of total neurons while growing more selective and monosemantic with model scale.
A machine-rendered reading of the paper's core claim, the machinery that carries it, and where it could break.
Core claim
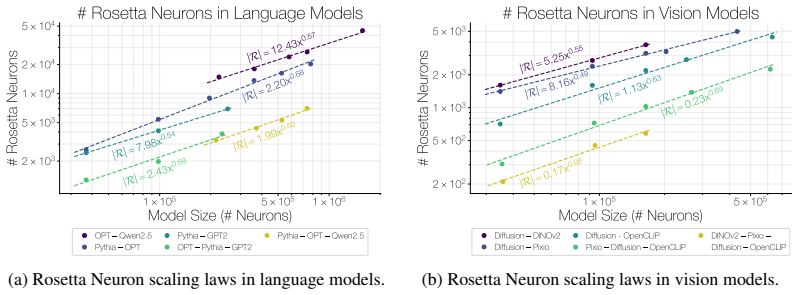
The population of Rosetta Neurons follows a sublinear power law in model size, growing in absolute number but occupying a shrinking fraction of the total neuron count; these neurons simultaneously become more selective and increasingly monosemantic, separating from a growing non-Rosetta population that remains less selective, with the pattern explained by an analytical model balancing feature utility against limited neuron capacity.
What carries the argument
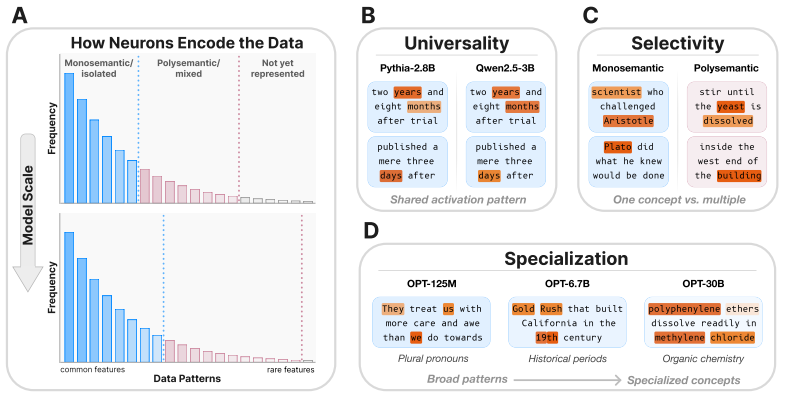
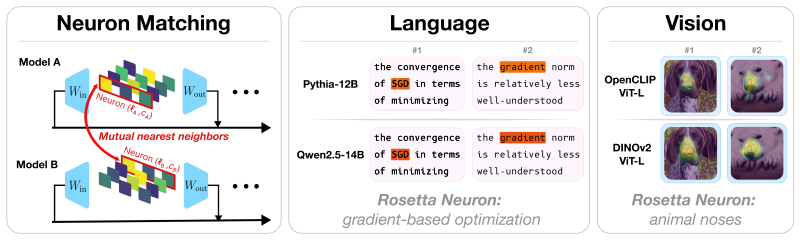
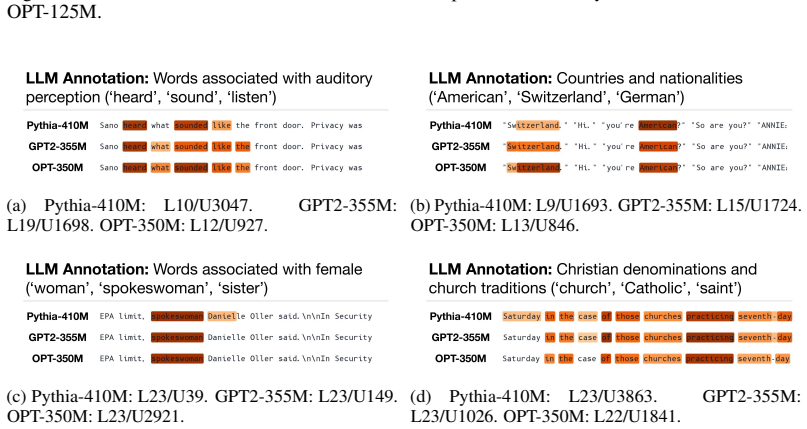
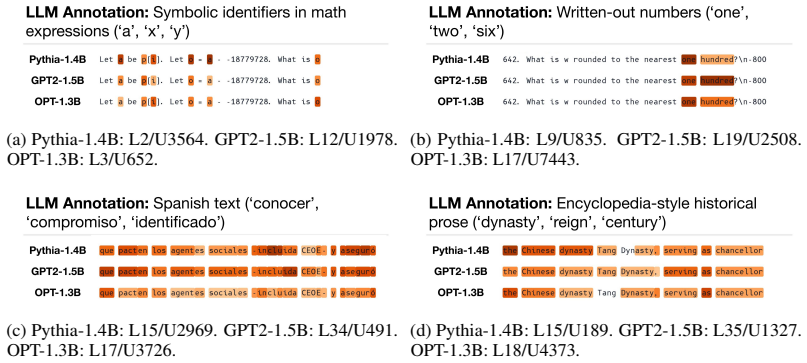
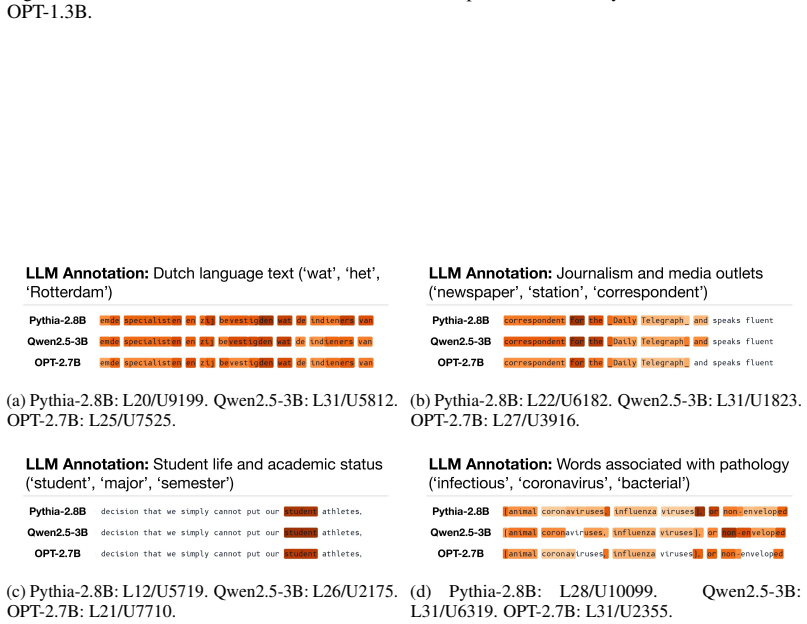
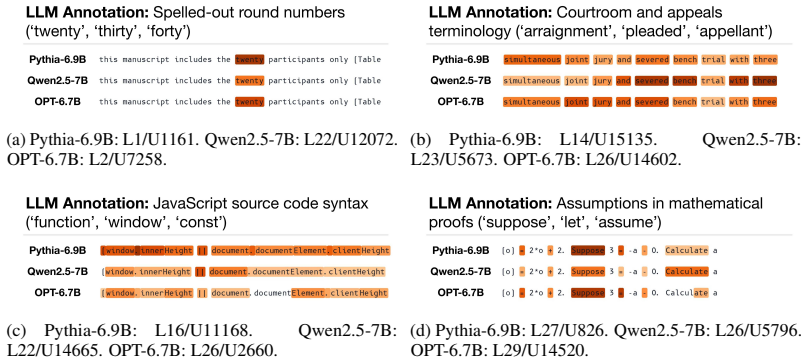
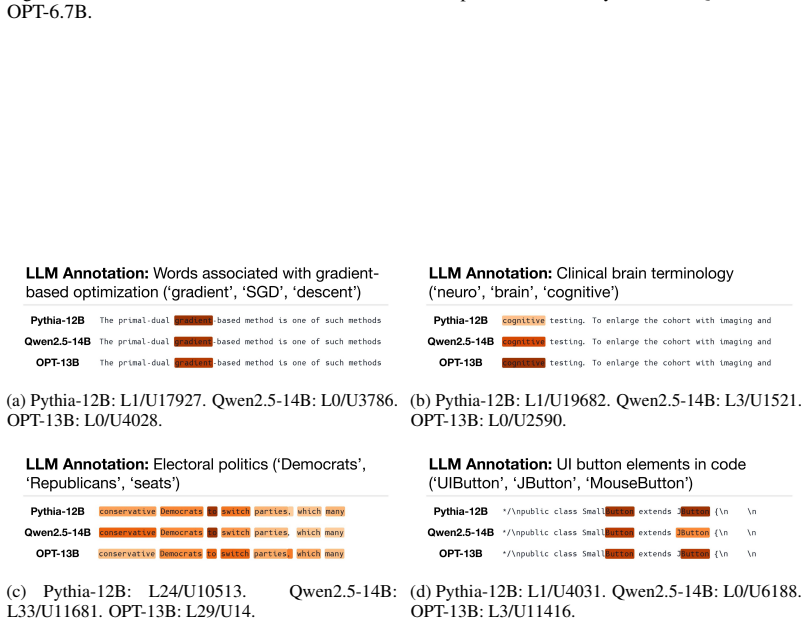
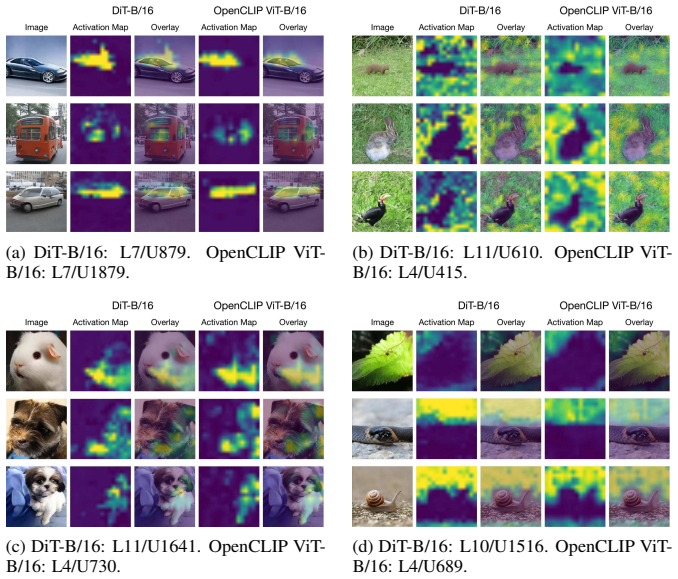
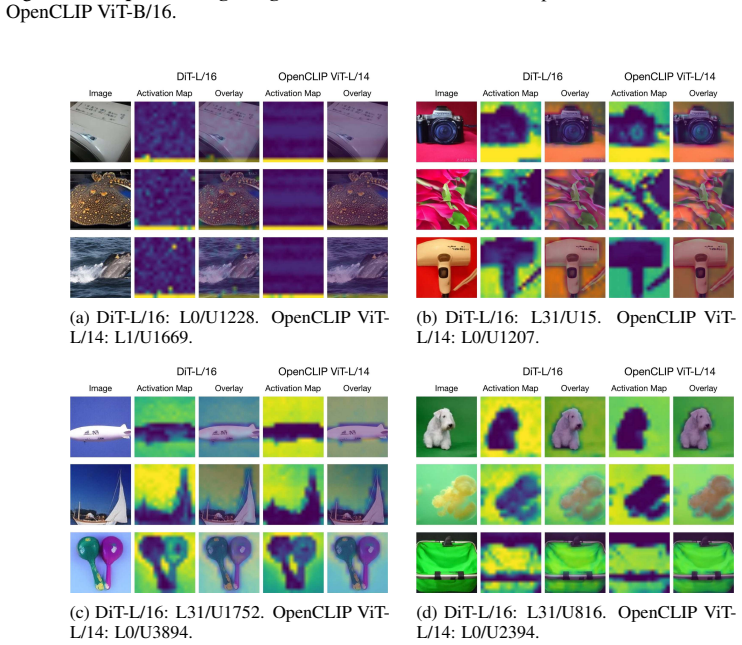
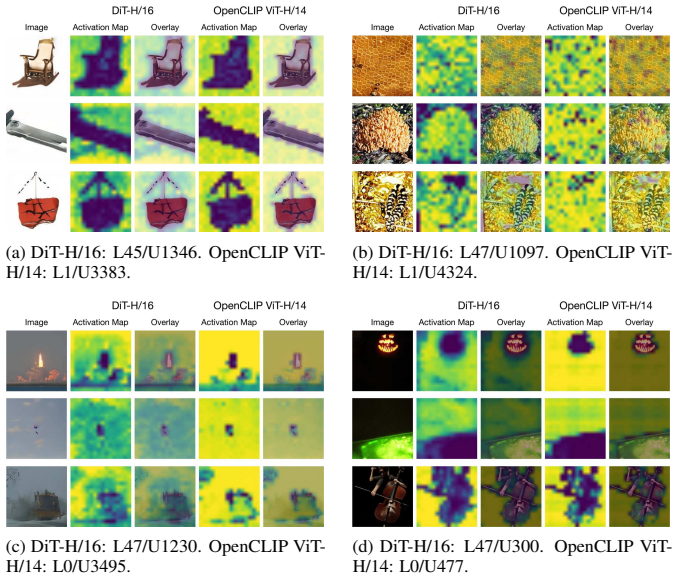
Rosetta Neurons, neurons whose activation patterns are similar across independently trained models, tracked for population scaling and selectivity changes across model sizes.
If this is right
- The absolute number of Rosetta Neurons continues to rise even while their relative share falls.
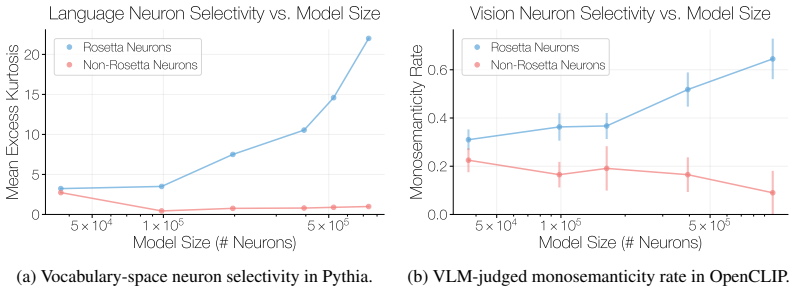
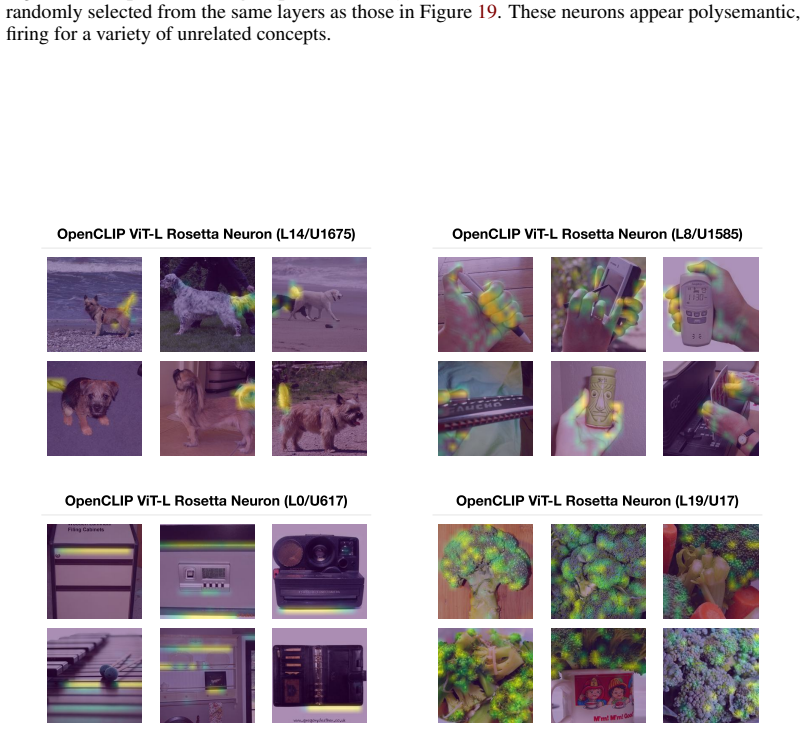
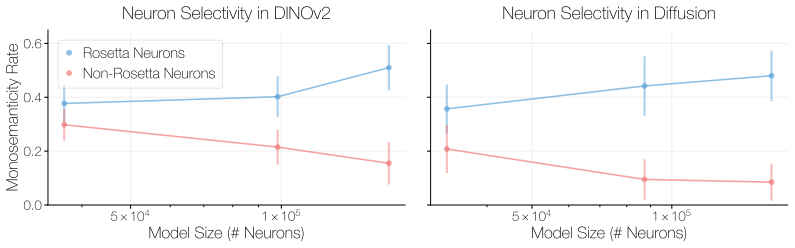
- Selectivity and monosemanticity of Rosetta Neurons increase steadily with scale.
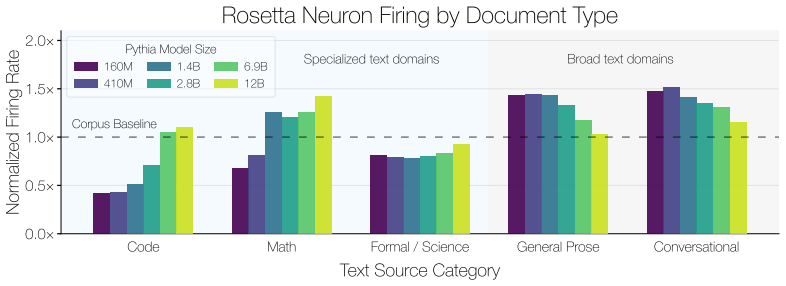
- Rosetta Neurons concentrate on narrower domains as models enlarge.
- The polarization separates Rosetta Neurons from a less selective non-Rosetta population.
- Rosetta Neurons can be used to filter training data for continued pretraining.
Where Pith is reading between the lines
- If the sublinear scaling holds, very large models will contain a small but stable core of highly shared, interpretable neurons amid mostly model-specific ones.
- The polarization effect suggests that interpretability tools focused on shared neurons may become relatively more powerful at larger scales.
- The analytical capacity-utility tradeoff could be tested by varying the total neuron budget while holding feature set fixed in controlled synthetic settings.
Load-bearing premise
The analytical model balancing feature utility against limited neuron capacity is derived independently of the observed data and is not fitted post-hoc to reproduce the sublinear exponent or polarization pattern.
What would settle it
Measure the Rosetta Neuron population fraction and average selectivity in a new family of models at least ten times larger than 30B parameters; if the fraction stops shrinking or selectivity stops increasing, the claimed scaling and polarization laws are falsified.
Figures
read the original abstract
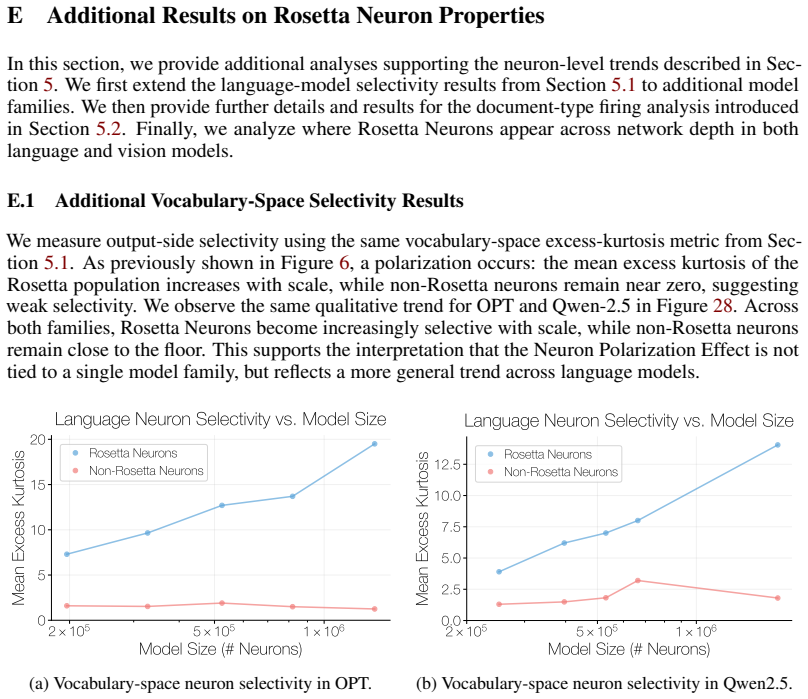
We investigate whether neuron populations within neural networks evolve predictably with scale, extending scaling laws beyond macroscopic observables such as loss. To probe this question, we study Rosetta Neurons, a previously characterized class of neurons whose activation patterns are similar across independently trained models (Dravid et al., 2023). In separate analyses of language models up to 30B parameters and vision models up to 5B parameters, we observe that the population of Rosetta Neurons follows a sublinear power law in model size, growing in absolute number but occupying a shrinking fraction of the total neuron count. We further observe a Neuron Polarization Effect: Rosetta Neurons become more selective and increasingly monosemantic with scale, separating from a growing non-Rosetta population that remains less selective. An analytical model balancing feature utility against limited neuron capacity explains the sublinear power-law scaling and this polarization effect. Finally, we find that Rosetta Neurons become more domain-specialized with scale and illustrate their selectivity through a targeted data-filtering case study for continued pretraining. Our results point to a scaling law for interpretable, shared neuron-level structure, linking model size to systematic changes in neuron universality, selectivity, and specialization.
Editorial analysis
A structured set of objections, weighed in public.
Referee Report
Summary. The paper claims that Rosetta Neurons (neurons with similar activation patterns across independently trained models) follow a sublinear power-law scaling in count with model size (growing absolutely but shrinking as a fraction of total neurons) in language models up to 30B and vision models up to 5B parameters. It further claims a Neuron Polarization Effect in which Rosetta Neurons become more selective and monosemantic with scale, separating from a less-selective non-Rosetta population; both phenomena are explained by an analytical model balancing feature utility against neuron capacity. Additional claims include increasing domain specialization of Rosetta Neurons with scale and a data-filtering case study for continued pretraining.
Significance. If the empirical scaling and polarization observations hold and the analytical model is shown to be independently derived, the work would extend macroscopic scaling laws to neuron-level structure, offering a mechanistic account of how universality, selectivity, and specialization evolve with capacity. The case study provides a concrete application link to data curation.
major comments (2)
- [Abstract] Abstract and empirical sections: the sublinear power-law claim and Neuron Polarization Effect are presented without error bars, confidence intervals, exclusion criteria for Rosetta Neuron identification, or details on how similarity thresholds were validated across model sizes; these omissions are load-bearing because they prevent verification of the central scaling and selectivity observations.
- [Analytical Model] Analytical model description: the text states that the model 'explains' the sublinear exponent and polarization but does not provide the derivation or demonstrate that its parameters (e.g., utility or capacity terms) are fixed independently of the measured scaling data rather than chosen to reproduce the observed exponent; this directly affects whether the model constitutes an independent explanation.
Simulated Author's Rebuttal
Thank you for the detailed review. We appreciate the feedback on improving the clarity and verifiability of our claims regarding Rosetta Neuron scaling and the analytical model. We respond to each major comment below.
read point-by-point responses
-
Referee: [Abstract] Abstract and empirical sections: the sublinear power-law claim and Neuron Polarization Effect are presented without error bars, confidence intervals, exclusion criteria for Rosetta Neuron identification, or details on how similarity thresholds were validated across model sizes; these omissions are load-bearing because they prevent verification of the central scaling and selectivity observations.
Authors: We agree that these details are essential for rigorous verification. In the revised manuscript, we will include error bars and confidence intervals on all scaling plots and polarization metrics. We will also add explicit exclusion criteria for identifying Rosetta Neurons and a section detailing the validation of similarity thresholds across different model sizes, including sensitivity analyses. revision: yes
-
Referee: [Analytical Model] Analytical model description: the text states that the model 'explains' the sublinear exponent and polarization but does not provide the derivation or demonstrate that its parameters (e.g., utility or capacity terms) are fixed independently of the measured scaling data rather than chosen to reproduce the observed exponent; this directly affects whether the model constitutes an independent explanation.
Authors: The analytical model is presented in the main text with a high-level derivation balancing feature utility against neuron capacity. However, we acknowledge that a full step-by-step derivation and explicit demonstration of parameter independence would strengthen the claim of it being an independent explanation. We will expand this section in the revision to include the complete derivation and clarify how the utility and capacity parameters are determined from first principles and prior literature, independent of the scaling observations. revision: yes
Circularity Check
No significant circularity identified
full rationale
The paper reports an empirical observation of sublinear scaling in the count of Rosetta Neurons (previously defined in Dravid et al. 2023) across independently trained models, plus a polarization effect in selectivity. It then introduces an analytical model derived from balancing feature utility against neuron capacity constraints to explain the observed power-law exponent and polarization. No equations or text indicate that model parameters were fitted to the measured scaling data or that the exponent is recovered by construction; the model is presented as independently derived. The self-citation to the 2023 definition of Rosetta Neurons is not load-bearing for the new scaling claim, and the derivation chain remains self-contained against external benchmarks.
Axiom & Free-Parameter Ledger
Reference graph
Works this paper leans on
-
[1]
Disentangling mlp neuron weights in vocabulary space.arXiv preprint arXiv:2604.06005,
Asaf Avrahamy, Yoav Gur-Arieh, and Mor Geva. Disentangling mlp neuron weights in vocabulary space.arXiv preprint arXiv:2604.06005,
-
[2]
Layer normalization.arXiv preprint arXiv:1607.06450,
Jimmy Lei Ba, Jamie Ryan Kiros, and Geoffrey E Hinton. Layer normalization.arXiv preprint arXiv:1607.06450,
-
[3]
Emergence of sparse representations from noise
11 Trenton Bricken, Rylan Schaeffer, Bruno Olshausen, and Gabriel Kreiman. Emergence of sparse representations from noise. InProceedings of the 40th International Conference on Machine Learning, pp. 3148–3191, 2023a. Trenton Bricken, Adly Templeton, Joshua Batson, Brian Chen, Adam Jermyn, Tom Conerly, Nick Turner, Cem Anil, Carson Denison, Amanda Askell, ...
arXiv 2023
-
[4]
Best-buddies similarity for robust template matching
Tali Dekel, Shaul Oron, Michael Rubinstein, Shai Avidan, and William T Freeman. Best-buddies similarity for robust template matching. InProceedings of the IEEE conference on computer vision and pattern recognition, pp. 2021–2029,
2021
-
[5]
Rosetta neurons: Mining the common units in a model zoo
Amil Dravid, Yossi Gandelsman, Alexei A Efros, and Assaf Shocher. Rosetta neurons: Mining the common units in a model zoo. InProceedings of the IEEE/CVF International Conference on Computer Vision, pp. 1934–1943,
1934
-
[6]
Nelson Elhage, Tristan Hume, Catherine Olsson, Nicholas Schiefer, Tom Henighan, Shauna Kravec, Zac Hatfield-Dodds, Robert Lasenby, Dawn Drain, Carol Chen, et al. Toy models of superposition. arXiv preprint arXiv:2209.10652,
-
[7]
The pile: An 800gb dataset of diverse text for language modeling.arXiv preprint arXiv:2101.00027,
Leo Gao, Stella Biderman, Sid Black, Laurence Golding, Travis Hoppe, Charles Foster, Jason Phang, Horace He, Anish Thite, Noa Nabeshima, et al. The pile: An 800gb dataset of diverse text for language modeling.arXiv preprint arXiv:2101.00027,
-
[8]
Transformer feed-forward layers are key-value memories
Mor Geva, Roei Schuster, Jonathan Berant, and Omer Levy. Transformer feed-forward layers are key-value memories. InProceedings of the 2021 Conference on Empirical Methods in Natural Language Processing, pp. 5484–5495,
2021
-
[9]
URLhttps://www.science.org/doi/abs/10.1126/science.1089506
doi: 10.1126/ science.1089506. URLhttps://www.science.org/doi/abs/10.1126/science.1089506. 12 James V Haxby, M Ida Gobbini, Maura L Furey, Alumit Ishai, Jennifer L Schouten, and Pietro Pietrini. Distributed and overlapping representations of faces and objects in ventral temporal cortex. Science, 293(5539):2425–2430,
-
[10]
Deep learning scaling is predictable, empirically.arXiv preprint arXiv:1712.00409,
Joel Hestness, Sharan Narang, Newsha Ardalani, Gregory Diamos, Heewoo Jun, Hassan Kianinejad, Md Mostofa Ali Patwary, Yang Yang, and Yanqi Zhou. Deep learning scaling is predictable, empirically.arXiv preprint arXiv:1712.00409,
-
[11]
Training compute-optimal large language models.arXiv preprint arXiv:2203.15556, 10,
Jordan Hoffmann, Sebastian Borgeaud, Arthur Mensch, Elena Buchatskaya, Trevor Cai, Eliza Rutherford, DDL Casas, Lisa Anne Hendricks, Johannes Welbl, Aidan Clark, et al. Training compute-optimal large language models.arXiv preprint arXiv:2203.15556, 10,
-
[12]
Jing Huang, Daniel Wurgaft, Rachit Bansal, Laura Ruis, Naomi Saphra, David Alvarez-Melis, Andrew Kyle Lampinen, Christopher Potts, and Ekdeep Singh Lubana. Why larger models learn more: Effects of capacity, interference, and rare-task retention.arXiv preprint arXiv:2605.29548,
-
[13]
Hamel Husain, Ho-Hsiang Wu, Tiferet Gazit, Miltiadis Allamanis, and Marc Brockschmidt. Code- searchnet challenge: Evaluating the state of semantic code search.arXiv preprint arXiv:1909.09436,
Pith/arXiv arXiv 1909
-
[14]
Scaling laws for neural language models
Jared Kaplan, Sam McCandlish, Tom Henighan, Tom B Brown, Benjamin Chess, Rewon Child, Scott Gray, Alec Radford, Jeffrey Wu, and Dario Amodei. Scaling laws for neural language models. arXiv preprint arXiv:2001.08361,
Pith/arXiv arXiv 2001
-
[15]
Yizhou Liu, Ziming Liu, and Jeff Gore
URL http: //arxiv.org/abs/1511.07543. Yizhou Liu, Ziming Liu, and Jeff Gore. Superposition yields robust neural scaling. InThe Thirty-ninth Annual Conference on Neural Information Processing Systems,
-
[16]
URL https://openreview.net/forum?id= Bkg6RiCqY7. 13 Yiyang Lu, Susie Lu, Qiao Sun, Hanhong Zhao, Zhicheng Jiang, Xianbang Wang, Tianhong Li, Zhengyang Geng, and Kaiming He. One-step latent-free image generation with pixel mean flows. arXiv preprint arXiv:2601.22158,
-
[17]
In-context learning and induction heads
Catherine Olsson, Nelson Elhage, Neel Nanda, Nicholas Joseph, Nova DasSarma, Tom Henighan, Ben Mann, Amanda Askell, Yuntao Bai, Anna Chen, et al. In-context learning and induction heads. arXiv preprint arXiv:2209.11895,
-
[18]
Learning to generate reviews and discovering sentiment.arXiv preprint arXiv:1704.01444,
Alec Radford, Rafal Jozefowicz, and Ilya Sutskever. Learning to generate reviews and discovering sentiment.arXiv preprint arXiv:1704.01444,
-
[19]
Polysemanticity and capacity in neural networks.arXiv preprint arXiv:2210.01892,
Adam Scherlis, Kshitij Sachan, Adam S Jermyn, Joe Benton, and Buck Shlegeris. Polysemanticity and capacity in neural networks.arXiv preprint arXiv:2210.01892,
-
[20]
Dinov3.arXiv preprint arXiv:2508.10104,
Oriane Siméoni, Huy V V o, Maximilian Seitzer, Federico Baldassarre, Maxime Oquab, Cijo Jose, Vasil Khalidov, Marc Szafraniec, Seungeun Yi, Michaël Ramamonjisoa, et al. Dinov3.arXiv preprint arXiv:2508.10104,
-
[21]
Qwen2.5 technical report.arXiv preprint arXiv:2412.15115,
An Yang, Baosong Yang, Beichen Zhang, Binyuan Hui, Bo Zheng, Bowen Yu, Chengyuan Li, Dayiheng Liu, Fei Huang, Haoran Wei, et al. Qwen2.5 technical report.arXiv preprint arXiv:2412.15115,
-
[22]
In pursuit of pixel supervision for visual pre-training.arXiv preprint arXiv:2512.15715,
Lihe Yang, Shang-Wen Li, Yang Li, Xinjie Lei, Dong Wang, Abdelrahman Mohamed, Heng- shuang Zhao, and Hu Xu. In pursuit of pixel supervision for visual pre-training.arXiv preprint arXiv:2512.15715,
-
[23]
Opt: Open pre-trained transformer language models.arXiv preprint arXiv:2205.01068,
Susan Zhang, Stephen Roller, Naman Goyal, Mikel Artetxe, Moya Chen, Shuohui Chen, Christopher Dewan, Mona Diab, Xian Li, Xi Victoria Lin, et al. Opt: Open pre-trained transformer language models.arXiv preprint arXiv:2205.01068,
-
[24]
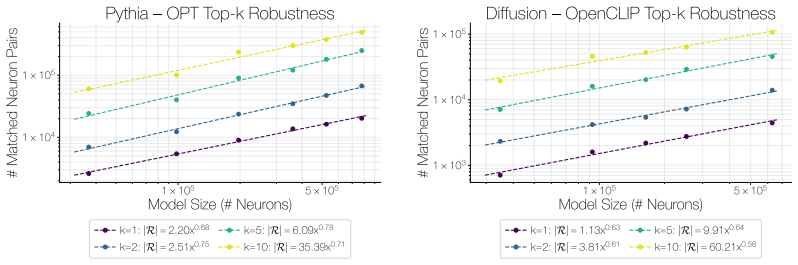
C.1 Model Families Language Model Families.For language models, we only consider pretrained models that have not undergone post-training
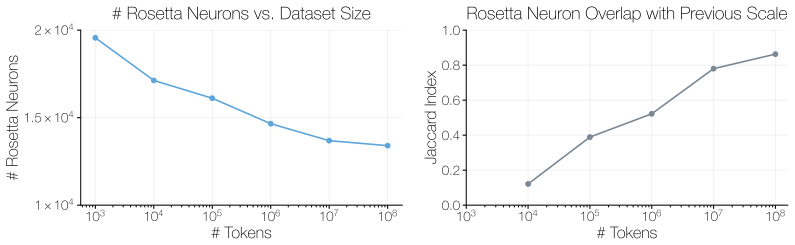
We then present robustness checks for the matching procedure, including an ablation of the mutual-knearest-neighbor criterion and a dataset-permutation null. C.1 Model Families Language Model Families.For language models, we only consider pretrained models that have not undergone post-training. We conduct the neuron matching using models from the Pythia, ...
2019
-
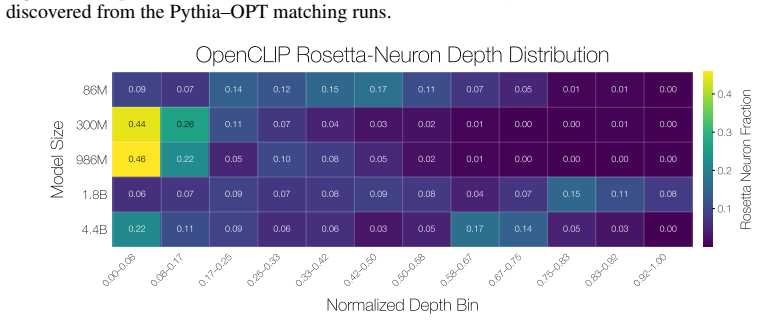
[25]
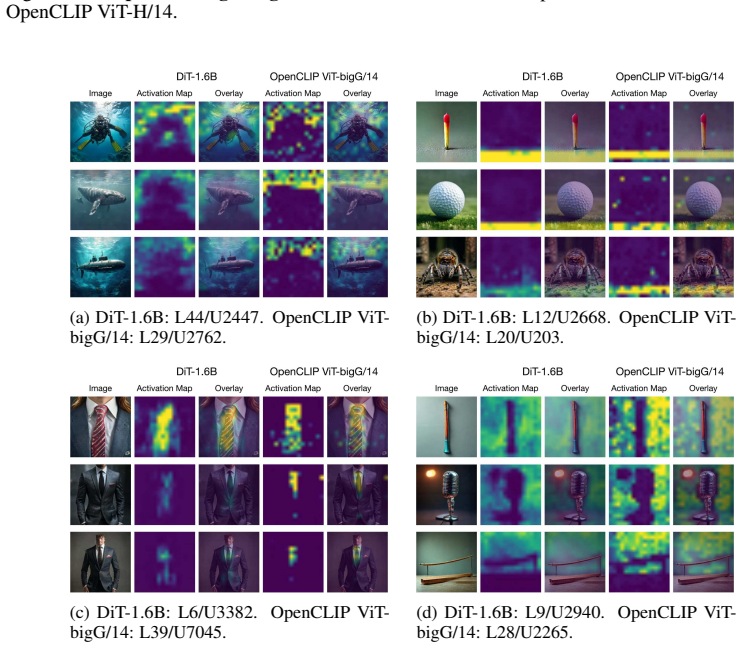
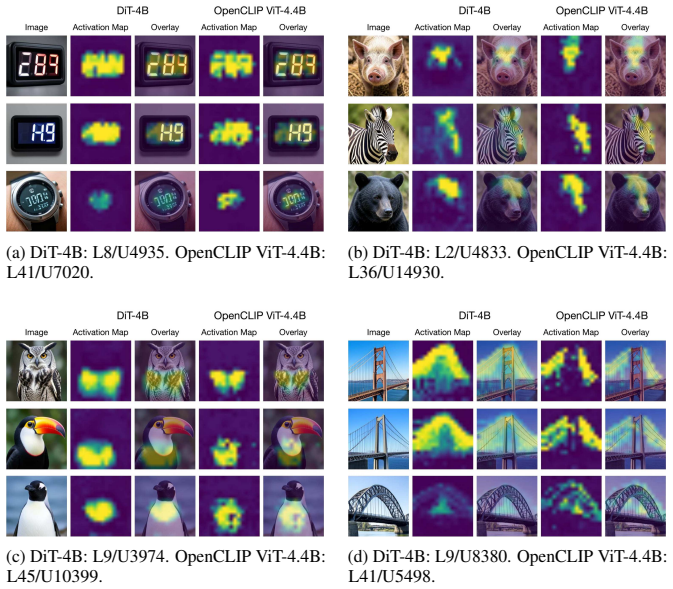
For the generative model, we use one-step diffusion models built on the Diffusion Transformer architecture (Peebles & Xie, 2023)
Vision Model Families.We analyze discriminative vision models from the OpenCLIP, DINOv2, and Pixio families, spanning scales from approximately 80 million to 5 billion parameters (Cherti et al., 2023; Radford et al., 2021; Oquab et al., 2024; Yang et al., 2025). For the generative model, we use one-step diffusion models built on the Diffusion Transformer ...
2023
-
[26]
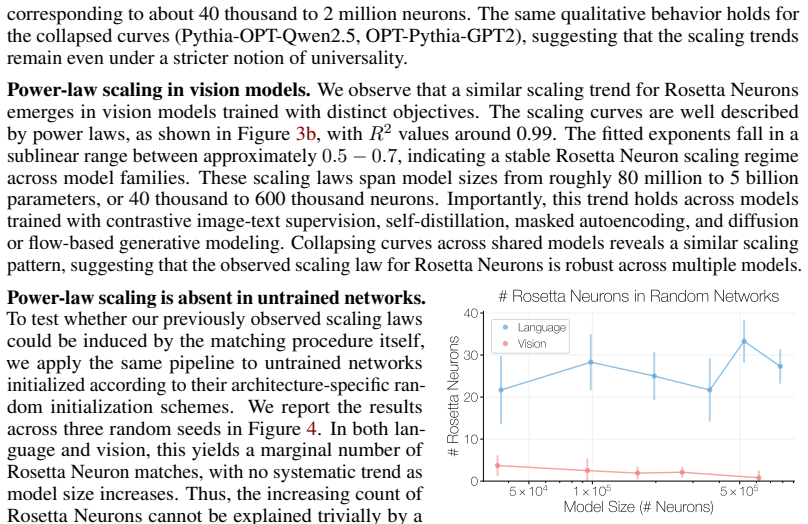
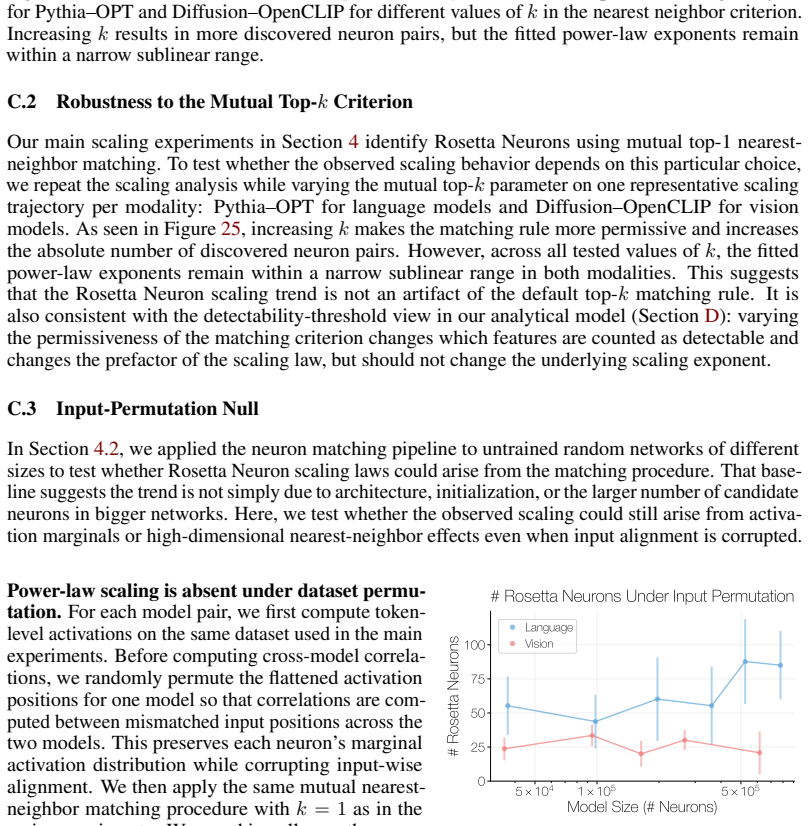
neuron” and “coordinate
Under this null, the number of discovered Rosetta Neurons collapses to roughly 20–100 matches. Moreover, these counts no longer exhibit the systematic sublinear power-law trend observed with aligned activations. This suggests that Rosetta Neuron scaling depends on shared responses to the aligned inputs, rather than being induced by the matching procedure ...
2022
-
[27]
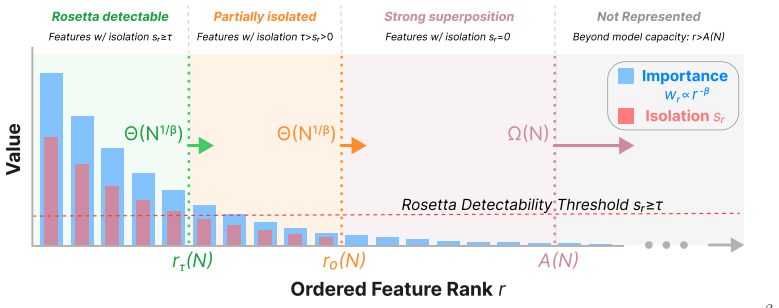
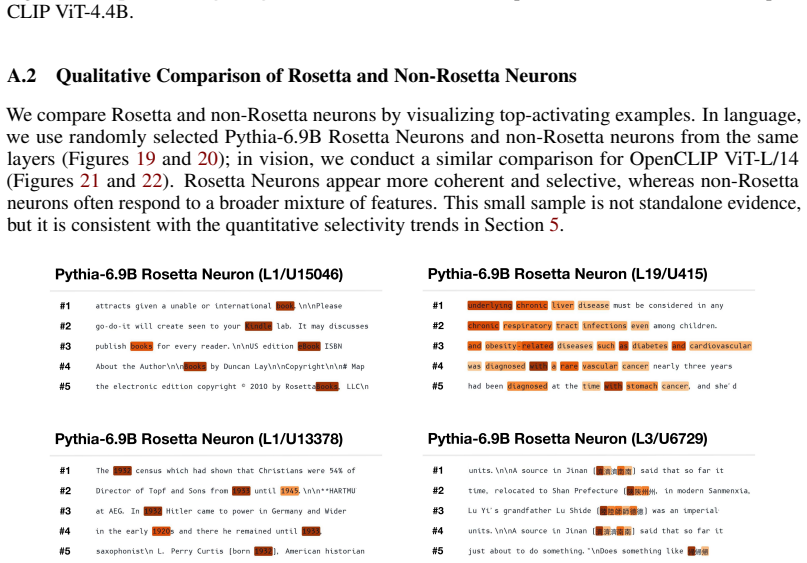
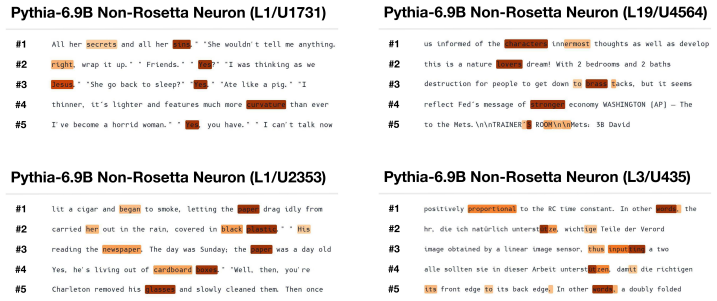
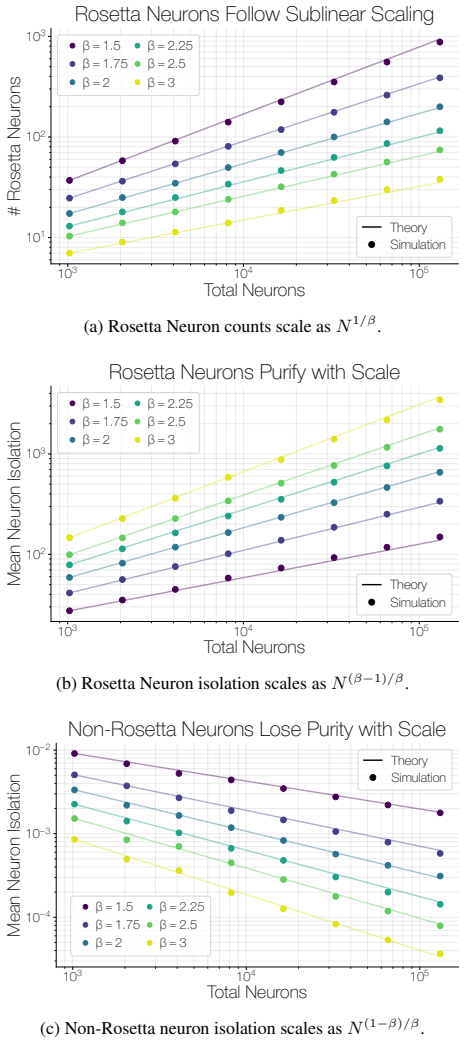
As N grows, the number of detectable Rosetta Neurons increases, and their average isolation also increases
D.3 Prediction: Neuron Polarization The same allocation profile predicts a polarization effect. As N grows, the number of detectable Rosetta Neurons increases, and their average isolation also increases. At the same time, a growing tail of latent features remains weakly isolated, corresponding to a more crowded non-Rosetta background. Rosetta purification...
2015
-
[28]
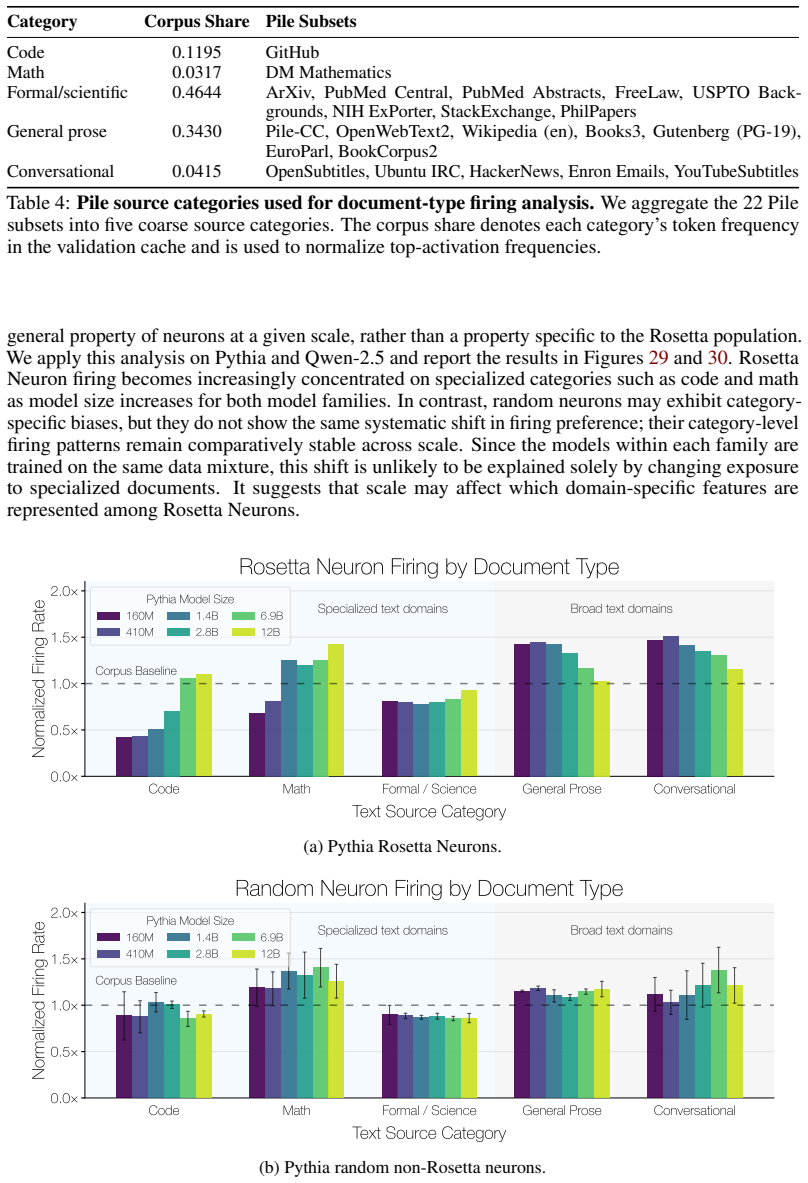
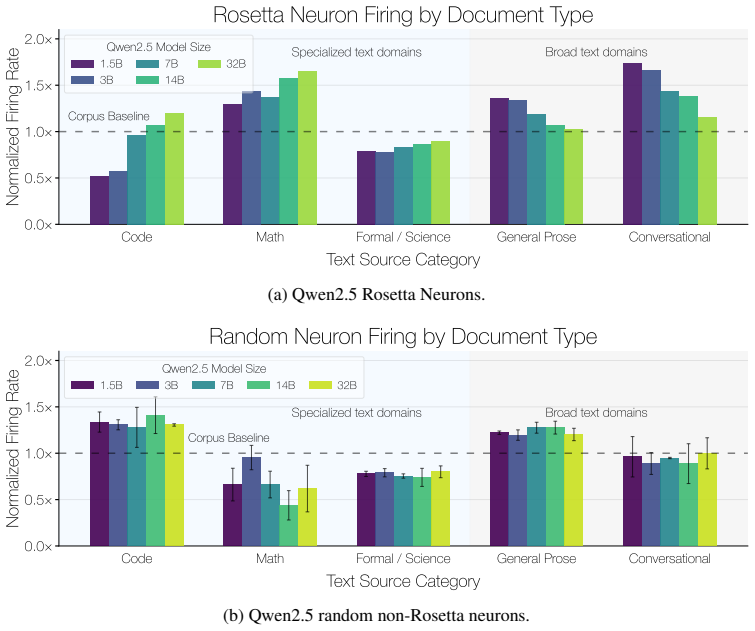
Random non-Rosetta neurons may exhibit category-specific biases, but do not exhibit the same consistent scale-dependent shift toward specialized domains
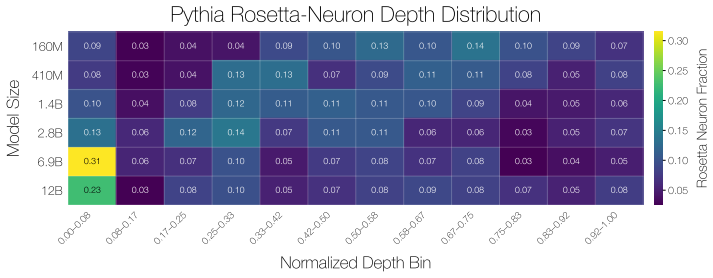
Rosetta Neurons show an increasing shift toward specialized categories such as code and math with scale. Random non-Rosetta neurons may exhibit category-specific biases, but do not exhibit the same consistent scale-dependent shift toward specialized domains. E.3 Depth-Wise Distribution of Rosetta Neurons We analyze where Rosetta Neurons appear across netw...
2019
-
[29]
striped patterns
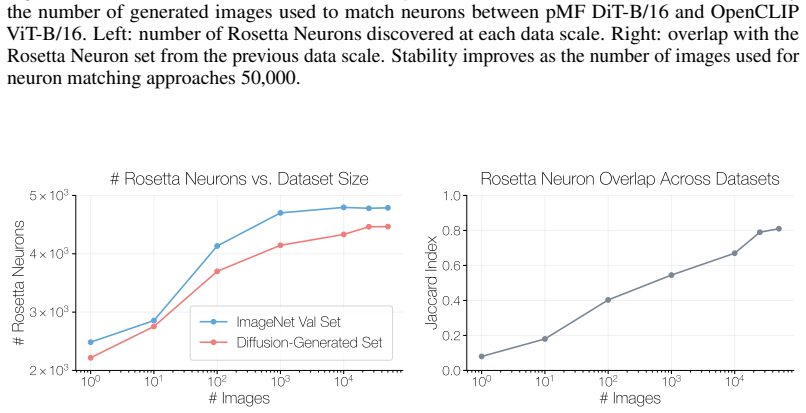
G.3 Ablation on the Image Distribution Used for Vision Model Matching Our vision experiments match neurons between a generative model and a discriminative model, following the GAN-based setup of (Dravid et al., 2023). For modern diffusion-based generators, this requires generated images, since activations from the generative model are only available along...
2023
-
[30]
The baseline chance is a random predictor that independently marks each test image as activating with probability 0.5
VLM-as-a-judge performs meaningfully above a random baseline. The baseline chance is a random predictor that independently marks each test image as activating with probability 0.5. In this 5-positive/5-negative setup, its expected accuracy and precision are0.5, while its expected Recall and F1 are0.4995and0.4865, respectively. Model Accuracy Precision Rec...
2025
-
[31]
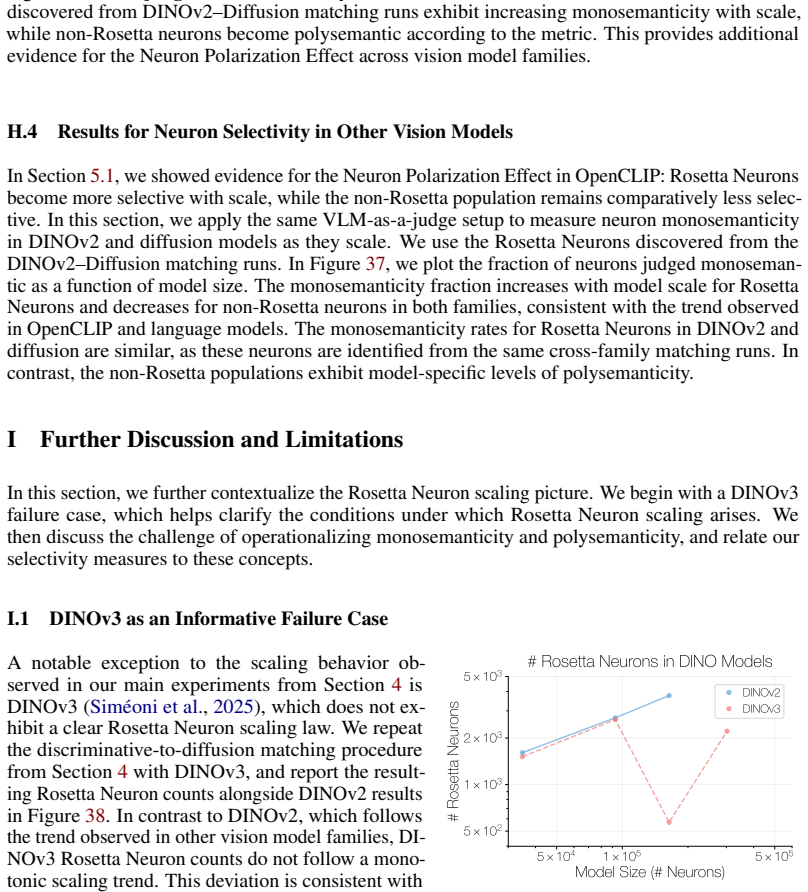
In contrast to DINOv2, which follows the trend observed in other vision model families, DI- NOv3 Rosetta Neuron counts do not follow a mono- tonic scaling trend. This deviation is consistent with the fact that DINOv3 modifies the DINOv2 training setup with additional constraints on intermediate rep- resentations, encouraging them to match statistics from ...
2022
discussion (0)
Sign in with ORCID, Apple, or X to comment. Anyone can read and Pith papers without signing in.