REVIEW 3 major objections 6 minor 81 references
DELUGE predicts daily ~1 km pluvial flood damage across the highest-claim US regions, beating tuned tree baselines especially on high-cost claims via interpretable value and temporal modulators conditioned on terrain and foundation-model em
Reviewed by Pith at T0; open to challenge. T0 means a machine referee read the full paper against a public rubric. the ladder, T0–T4 →
T0 review · deepseek-v4-flash
2026-08-01 21:30 UTC pith:FSI3M3TY
load-bearing objection The modulator architecture is genuinely new and the paper is honest about its limits, but the bufferless spatial holdout leaves the headline generalization claim unproven until a buffered re-evaluation is run. the 3 major comments →
DELUGE: Towards Continental-Scale Daily Pluvial Flood Damage Prediction via Interpretable Conditioning on Foundation Model Embeddings
The pith
A machine-rendered reading of the paper's core claim, the machinery that carries it, and where it could break.
Core claim
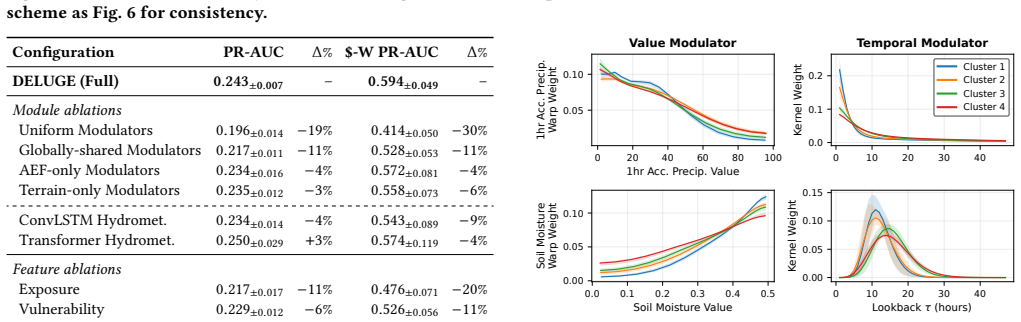
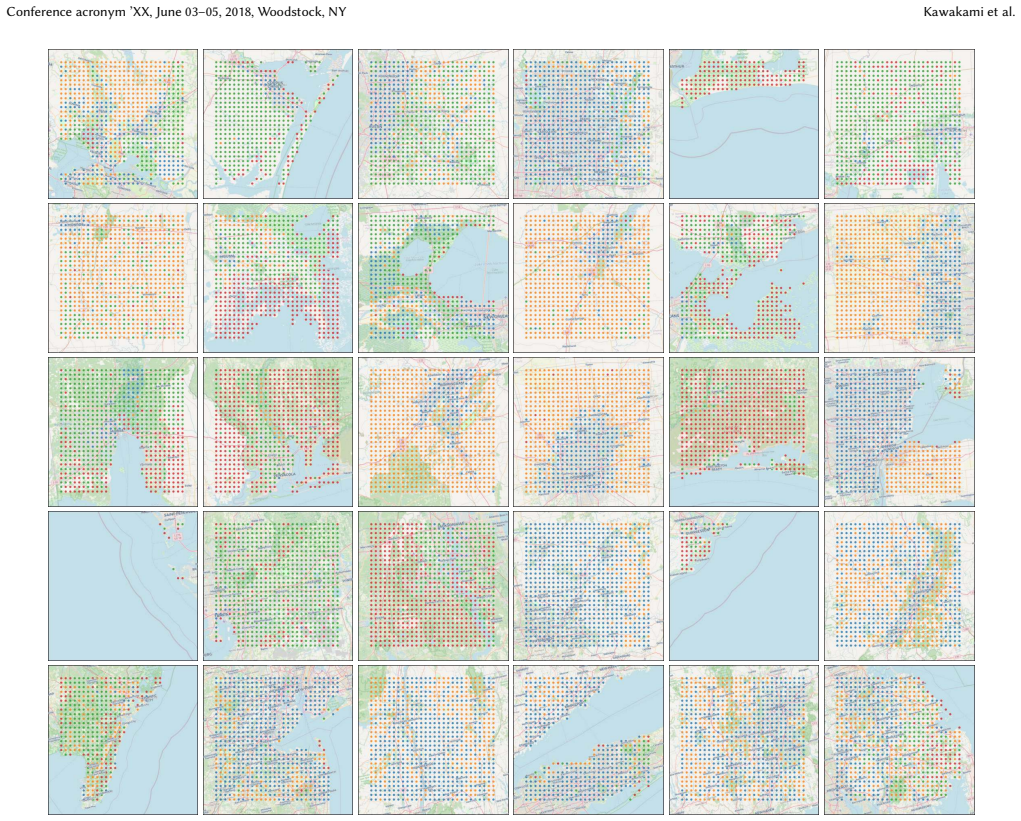
On the paper's own terms, the discovery is that pluvial flood damage can be treated as a daily, kilometer-scale supervised learning problem over the CONUS's highest-claim regions, and that a CNN with terrain- and AlphaEarth-conditioned modulators learns to rank costly claim events more accurately than the tree-based models that dominate the flood-damage literature. The model's learned per-patch parameters — warp shapes on precipitation and soil-moisture values, and two-component gamma response kernels with directly interpretable peak lag and decay timescale — cluster into hydrologically coherent regimes, e.g. precipitation driving immediate response and soil moisture capturing antecedent con
What carries the argument
Two parametric modules inside the hydrometeorology branch carry the argument. The Value Modulator learns a per-patch, per-channel monotone piecewise-linear warp (16 control points) of each min-max-normalized hydrometeorology input, reshaped by terrain and AlphaEarth conditioning. The Temporal Modulator learns a per-patch causal convolution kernel made of a two-component gamma mixture for precipitation (peak lag p and decay timescale theta directly interpretable) and single gammas for soil moisture and snow water equivalent over a 48-hour lookback. Both are generated by a convolutional/MLP conditioning network from stacked terrain descriptors and AlphaEarth embeddings, starting from identity/
Load-bearing premise
The load-bearing premise is that the 75 km block holdout is leakage-free — that the ~8x8 km patch used for a test prediction never reaches into a training-split grid cell; the paper gives no buffer or boundary-pixel exclusion, so cross-split context could inflate the reported scores.
What would settle it
Rerun evaluation excluding every test pixel whose patch touches a training-split cell (or add a buffer) and compare PR-AUC and dollar-weighted PR-AUC against the strongest tree baseline; if the gap shrinks to seed noise, the spatial-generalization claim is not supported.
If this is right
- Daily ~1 km pluvial damage prediction becomes feasible at continental scale with a lightweight learned model, covering ~81% of NFIP pluvial claims in the top-100 high-claim cells.
- High-cost claims are ranked better: at the tightest 0.1% alert budget DELUGE captures 62% of claim dollars while only 19% of claim events, concentrating alerts where insurance and emergency management care most.
- Removing the hydrometeorology branch collapses performance (PR-AUC drops ~92-94%), confirming hazard inputs dominate and ablation structure.
- Learned modulator parameters can be inspected per location; clustered, they recover hydrologically coherent regimes (urban short-lag precipitation response, water-facing long-tail kernels), enabling checks on physical fidelity of foundation-model conditioning.
- The interpretable conditioning scheme is proposed as transferable to other geospatial tasks that use foundation-model embeddings.
Where Pith is reading between the lines
- A stricter evaluation that excludes test pixels whose 7x7 patch crosses the 75 km split boundary (or adds a buffer) would test whether the reported gains survive leakage-free; the paper does not describe such a check.
- The learned per-patch modulator parameters, if they cluster as hydrologically coherent as the paper shows, could serve as spatially explicit priors for rainfall-runoff response in ungauged areas — a use the paper does not claim.
- With 12.9% of claims date-shifted and 6% discarded, some residual mislabeling of fluvial/coastal damage may remain; if so, the model is learning a broader flood signal than purely pluvial, which could matter for comparisons against riverine-specific models.
- Moving from the top-100 to the top-200 cells would cover ~91% of claims (versus ~81%), so the practical ceiling of the approach is a scaling question the paper leaves open.
Editorial analysis
A structured set of objections, weighed in public.
Referee Report
Summary. The paper proposes DELUGE, a multimodal CNN for daily ~1 km pluvial flood damage occurrence prediction over the top-100 highest-claim 75 km cells in CONUS, trained on NFIP claims with explicit temporal and spatial uncertainty corrections. Its architectural contributions are a Value Modulator and a Temporal Modulator in the hydrometeorology branch, conditioned on terrain descriptors and AlphaEarth foundation-model embeddings, producing per-patch, inspectable hydrological response parameters. Evaluation under a 75 km spatial block holdout reports PR-AUC 0.243 versus 0.177–0.228 for tuned Random Forest/XGBoost/LightGBM baselines, and dollar-weighted PR-AUC 0.594 versus 0.413–0.538. Ablations, failure-mode analysis, and a temporal-split appendix support the main claims.
Significance. If the reported results are robust, DELUGE would be a meaningful advance: it is the first end-to-end system to predict daily, ~1 km insured pluvial flood damage across the highest-claim regions of CONUS, and its interpretable conditioning scheme is a transferable pattern for geospatial foundation-model integration. The paper ships several strengths: three matched spatial splits with error bars, sensible module and feature ablations, physically meaningful modulator parameters (e.g., precipitation kernels peaking near lag 0 and soil-moisture kernels peaking at 7–15 h), and a clear failure-mode analysis. However, the central spatial-generalization claim is weakened by a potential leakage pathway that the current protocol does not close, and the daily-prediction framing is not fully supported by the negative-sampling design.
major comments (3)
- [§4.6 and §4.2, Table 2] The spatial holdout is described as partitioning at the 75 km cell level, but every prediction uses a 7×7 pixel patch (~8×8 km) centered on the target pixel (§4.2). A test pixel near the edge of a held-out 75 km cell receives terrain, AlphaEarth, exposure, and hydrometeorology context from the neighboring cell; if that neighbor is in the training split, test predictions are informed by training-region spatial context. The Value and Temporal Modulators are conditioned on patch-level terrain and AEF features (§4.3–4.4), so the leakage can enter the interpretable conditioning pathway, not only the CNN encoder. The paper does not mention a buffer or boundary-pixel exclusion, and top-100 cells in the Northeast/Gulf are plausibly adjacent. This could inflate the reported PR-AUC and dollar-weighted PR-AUC gaps. Please rerun the evaluation with a buffer around each held-out cell (or by excluding
- [§3.3 and Table 2] Temporal negatives are sampled only on days when the grid-cell mean of the 1-hour maximum accumulated precipitation exceeds 10 mm. The test set therefore excludes dry days, so the reported 0.25% positive rate and the '~100x improvement over chance' framing are conditional on wet-day negatives, not on the full daily operational distribution. A model that performs well on wet-day negatives could still mis-rank dry days. Since the paper's central claim is daily prediction, please also report metrics on a test set that includes dry-day negatives, or explicitly reframe the headline numbers as wet-day-conditional.
- [Appendix D] The temporal generalization experiment is a single split (train 2017–2020, test 2021–2022) and the appendix itself notes that training is dominated by Hurricane Harvey in 2017 ($5.8B) while the test years lack a comparable event, with dollar-weighted PR-AUC dropping roughly 38–41% for all models. This is an acknowledged confound, but it directly affects the 'daily continental-scale' claim and should be reported in the main text with appropriate caveats. Please also consider a leave-one-event-out analysis around Harvey to separate the model's temporal generalization from the influence of a single extreme.
minor comments (6)
- [Table 5] The stratified performance by claim amount is reported on a single held-out spatial split. Please indicate whether this is one of the three splits used in Table 2 and report error bars or at least the split identifier.
- [§3.1.1 and §3.3] The 10 mm/h precipitation threshold is used both for date correction and for temporal negative sampling. This hand-set threshold couples two parts of the pipeline; a short sensitivity analysis (e.g., 5, 10, 15 mm/h) would help establish robustness.
- [§4.4] The sentence 'totaling kernel parameters per patch' appears incomplete; the number of parameters (9 per patch, or 5+2+2) should be stated explicitly.
- [§5, Definition of $-Weighted PR-AUC] The definition mixes count-based precision with dollar-weighted recall. Clarify whether precision is also dollar-weighted; if not, state that the curve is a hybrid and justify why it is still interpretable as a precision-recall curve.
- [Figure 4 and Figure 7] The captions refer to 'seven held-out test days' and 'four held-out test days' without listing the dates. Adding dates or event labels would make the figures reproducible and interpretable.
- [References] Several references (e.g., [1], [8], [9], [13], [55]) carry 2025/2026 arXiv identifiers. Ensure the final bibliography includes stable DOIs or conference versions where available.
Circularity Check
No circular derivation: DELUGE's predictive and interpretability claims rest on held-out evaluation and end-to-end training, not on constructional circularity.
full rationale
DELUGE's central claims—that the model outperforms tuned tree baselines on spatially held-out cells and that its Value/Temporal Modulator parameters are hydrologically interpretable—are not circular by construction. The predictive claim is supported by a spatial block holdout split at the 75 km cell level ('To prevent spatial leakage, we partition the 100 grid cells (§3.2) into train and test sets at the 75 km cell level rather than at the pixel level'), with all methods evaluated on identical splits; no test-set labels or test-set statistics enter training. The modulator parameters are fit end-to-end and then inspected; the paper's own ablation table (Table 4) shows that removing or freezing the modulators degrades performance, so the interpretability result is not the source of the predictive gain. The 10 mm/h threshold used in temporal correction and negative sampling is a hand-set processing choice, and the gamma-kernel initialization (p1≈3h, p2≈24h, θ1≈3h, θ2≈12h) is an explicit initialization, not a fitted parameter renamed as a prediction; these are modeling choices, not circular reductions. The paper contains no load-bearing self-citation chain, no uniqueness theorem imported from the authors' prior work, and no renamed known result. The main external concern—possible patch-boundary leakage across the 75 km split—is an evaluation-validity issue, not a case where a prediction is equivalent to its input by construction. The paper also acknowledges limitations in §6 (noisy labels, open interpretability, no out-of-distribution extrapolation), which further supports that no claim is being derived from its own target.
Axiom & Free-Parameter Ledger
free parameters (7)
- 10 mm/h precipitation threshold =
10 mm/h
- Temporal window T and kernel length L =
T=73 h, L=48 h
- Value Modulator control points K =
K=16
- Gamma kernel initialization =
p1≈3 h, p2≈24 h, θ1≈3 h, θ2≈12 h, w≈0.5
- Focal loss and smoothness hyperparameters =
α=0.5, γ=2, λ=0.1
- Top-100 study cells =
100 cells (~81% of pluvial claims)
- Cluster counts K=4 and K=6 =
K=4 (modulator clusters), K=6 (AEF clusters)
axioms (6)
- domain assumption NFIP redacted claims, after temporal and spatial corrections in §3.1, are a usable daily proxy for pluvial flood damage.
- domain assumption NOAA AORC hourly precipitation and NWM retrospective soil moisture/snow water equivalent are accurate at ~1 km resolution.
- domain assumption AlphaEarth Foundation embeddings encode built and natural environment features relevant to flood response.
- domain assumption A monotone piecewise-linear warp and a two-gamma mixture kernel can capture the pluvial damage response.
- ad hoc to paper The 75 km cell split is leakage-free even though each prediction uses a ~8x8 km patch.
- domain assumption Sampling temporal negatives only on days with >10 mm mean precipitation yields an evaluation that reflects daily operational performance.
Cite this review
Pith. "Pith review of DELUGE: Towards Continental-Scale Daily Pluvial Flood Damage Prediction via Interpretable Conditioning on Foundation Model Embeddings." pith.science (2026). https://pith.science/paper/FSI3M3TY
@misc{pith2026260716050,
  author       = {Pith},
  title        = {Pith review of: DELUGE: Towards Continental-Scale Daily Pluvial Flood Damage Prediction via Interpretable Conditioning on Foundation Model Embeddings},
  year         = {2026},
  howpublished = {\url{https://pith.science/paper/FSI3M3TY}},
  note         = {Machine review of arXiv:2607.16050}
}
read the original abstract
Pluvial (rainfall-driven) flooding accounts for 45% of National Flood Insurance Program (NFIP) claims in the United States and is harder to predict than its riverine and coastal counterparts, with existing approaches limited to coarse resolution, regional domains, or computationally intensive process-based models unsuitable for daily continental-scale use. We present DELUGE, a multimodal deep learning framework for daily pluvial flood damage prediction at ~1 km resolution and national scale, trained on spatially and temporally corrected NFIP claims (2017-2022) and structured around the hazard, exposure, and vulnerability components of disaster risk. Rather than blanket coverage of the Conterminous United States (CONUS), we model the top 100 highest-claim 75 km cells, distributed nationwide and accounting for ~81% of total pluvial flood claims. Our architectural novelty is a pair of parametric modules in the hydrometeorology branch, a Value Modulator and a Temporal Modulator, conditioned on terrain descriptors and AlphaEarth foundation-model embeddings, that expose directly inspectable hydrological response parameters and provide architecture-level interpretability-by-design. Under a spatial block holdout, DELUGE outperforms tuned Random Forest, XGBoost, and LightGBM baselines by 9% to 30% on a dollar-weighted area under the precision-recall curve (PR-AUC), a metric that emphasizes the rare, high-cost claims of greatest operational interest. Beyond DELUGE, we argue this interpretable conditioning scheme is a transferable pattern for integrating foundation-model embeddings into other geospatial prediction tasks.
Figures




Reference graph
Works this paper leans on
-
[1]
Mohit Agarwal, Mimi Sun, Chaitanya Kamath, Arbaaz Muslim, Prithul Sarker, Joydeep Paul, Hector Yee, Marcin Sieniek, Kim Jablonski, Swapnil Vispute, Atul Kumar, Yael Mayer, David Fork, Sheila de Guia, Jamie McPike, Adam Boulanger, Tomer Shekel, David Schottlander, Yao Xiao, Manjit Chakravarthy Manukonda, Yun Liu, Neslihan Bulut, Sami Abu el haija, Bryan Pe...
Pith/arXiv arXiv 2026
-
[2]
Atieh Alipour, Ali Ahmadalipour, Peyman Abbaszadeh, and Hamid Moradkhani
-
[3]
American Meteorological Society. 2026. Glossary of Meteorology: Rain. https: //glossary.ametsoc.org/wiki/rain Accessed: 2026-06-09
2026
-
[4]
Natee Amornsiripanitch, Siddhartha Biswas, John Orellana, and David Zink. 2024. Flood Underinsurance. (2024)
2024
-
[5]
P.D Bates and A.P.J De Roo. 2000. A simple raster-based model for flood inundation simulation.Journal of Hydrology236, 1-2 (Sept. 2000), 54–77. doi:10.1016/S0022-1694(00)00278-X
-
[6]
Paul D. Bates. 2022. Flood Inundation Prediction.Annual Review of Fluid Mechan- ics54, Volume 54, 2022 (Jan. 2022), 287–315. doi:10.1146/annurev-fluid-030121- 113138
-
[7]
Bates, Niall Quinn, Christopher Sampson, Andrew Smith, Oliver Wing, Jeison Sosa, James Savage, Gaia Olcese, Jeff Neal, Guy Schumann, Laura Gius- tarini, Gemma Coxon, Jeremy R
Paul D. Bates, Niall Quinn, Christopher Sampson, Andrew Smith, Oliver Wing, Jeison Sosa, James Savage, Gaia Olcese, Jeff Neal, Guy Schumann, Laura Gius- tarini, Gemma Coxon, Jeremy R. Porter, Mike F. Amodeo, Ziyan Chu, Sharai Lewis-Gruss, Neil B. Freeman, Trevor Houser, Michael Delgado, Ali Hamidi, Ian Bolliger, Kelly E. McCusker, Kerry Emanuel, Celso M. ...
2021
-
[8]
Aaron Bell, Amit Aides, Amr Helmy, Arbaaz Muslim, Aviad Barzilai, Aviv Slo- bodkin, Bolous Jaber, David Schottlander, George Leifman, Joydeep Paul, Mimi Sun, Nadav Sherman, Natalie Williams, Per Bjornsson, Roy Lee, Ruth Alcantara, Thomas Turnbull, Tomer Shekel, Vered Silverman, Yotam Gigi, Adam Boulanger, Alex Ottenwess, Ali Ahmadalipour, Anna Carter, Beh...
-
[9]
Ivan Felipe Benavides-Martinez, Justin Guthrie, Jhon Edwin Arias, Yeison Alberto Garces-Gomez, Angela Ines Guzman-Alvis, Cristiam Victoriano Portilla-Cabrera, Somnath Mondal, Andrew J Allyn, and Auroop R Ganguly. 2026. What on Earth is AlphaEarth? Hierarchical structure and functional interpretability for global land cover.arXiv preprint arXiv:2603.16911(2026)
arXiv 2026
-
[10]
Derrick Bonafilia, Beth Tellman, Tyler Anderson, and Erica Issenberg. 2020. Sen1Floods11: a georeferenced dataset to train and test deep learning flood algorithms for Sentinel-1. In2020 IEEE/CVF Conference on Computer Vision and Pattern Recognition Workshops (CVPRW). 835–845. doi:10.1109/CVPRW50498. 2020.00113
arXiv 2020
-
[11]
Anasse Boutayeb, Iyad Lahsen-Cherif, and Ahmed El Khadimi. 2025. When Machine Learning Meets Geospatial Data: A Comprehensive GeoAI Review.IEEE Journal of Selected Topics in Applied Earth Observations and Remote Sensing18 (2025), 13135–13191. doi:10.1109/JSTARS.2025.3568715
arXiv 2025
-
[12]
C. Bouwens, M.-C. ten Veldhuis, M. Schleiss, X. Tian, and J. Schepers. 2018. Towards identification of critical rainfall thresholds for urban pluvial flooding prediction based on crowdsourced flood observations.Hydrology and Earth System Sciences Discussions2018 (2018), 1–24. doi:10.5194/hess-2017-751
-
[13]
Christopher F. Brown, Michal R. Kazmierski, Valerie J. Pasquarella, William J. Rucklidge, Masha Samsikova, Chenhui Zhang, Evan Shelhamer, Estefania Lahera, Olivia Wiles, Simon Ilyushchenko, Noel Gorelick, Lihui Lydia Zhang, Sophia Alj, Emily Schechter, Sean Askay, Oliver Guinan, Rebecca Moore, Alexis Boukouvalas, and Pushmeet Kohli. 2025. AlphaEarth Found...
-
[14]
Brunner, Eric Gilleland, Andy Wood, Daniel L
Manuela I. Brunner, Eric Gilleland, Andy Wood, Daniel L. Swain, and Martyn Clark. 2020. Spatial Dependence of Floods Shaped by Spatiotemporal Variations in Meteorological and Land-Surface Processes.Geophysical Research Letters47, 13 (2020), e2020GL088000. doi:10.1029/2020GL088000
-
[15]
Chaney, Budiman Minasny, Jonathan D
Nathaniel W. Chaney, Budiman Minasny, Jonathan D. Herman, Travis W. Nauman, Colby W. Brungard, Cristine L. S. Morgan, Alexander B. McBrat- ney, Eric F. Wood, and Yohannes Yimam. 2019. POLARIS Soil Prop- erties: 30-m Probabilistic Maps of Soil Properties Over the Contigu- ous United States.Water Resources Research55, 4 (2019), 2916–2938. arXiv:https://agup...
-
[16]
Tianqi Chen and Carlos Guestrin. 2016. XGBoost: A Scalable Tree Boosting System. InProceedings of the 22nd ACM SIGKDD International Conference on Knowledge Discovery and Data Mining(San Francisco, California, USA)(KDD ’16). Association for Computing Machinery, New York, NY, USA, 785–794. doi:10. 1145/2939672.2939785
arXiv 2016
-
[17]
Elyssa L Collins, Georgina M Sanchez, Adam Terando, Charles C Stillwell, He- lena Mitasova, Antonia Sebastian, and Ross K Meentemeyer. 2022. Predicting flood damage probability across the conterminous United States.Environmental Research Letters17, 3 (Feb. 2022), 034006. doi:10.1088/1748-9326/ac4f0f
-
[18]
Brian Cosgrove, David Gochis, Trey Flowers, Aubrey Dugger, Fred Ogden, Tom Graziano, Ed Clark, Ryan Cabell, Nick Casiday, Zhengtao Cui, Kelley Eicher, Greg Fall, Xia Feng, Katelyn Fitzgerald, Nels Frazier, Camaron George, Rich Gibbs, Liliana Hernandez, Donald Johnson, Ryan Jones, Logan Karsten, Henok Kefelegn, David Kitzmiller, Haksu Lee, Yuqiong Liu, Has...
arXiv 2024
-
[19]
Elena Cristiano, Marie-Claire ten Veldhuis, and Nick van de Giesen. 2017. Spatial and temporal variability of rainfall and their effects on hydrological response in urban areas – a review.Hydrology and Earth System Sciences21, 7 (July 2017), 3859–3878. doi:10.5194/hess-21-3859-2017
-
[20]
European Space Agency and Sinergise. 2021. Copernicus Digital Elevation Model (DEM). Registry of Open Data on AWS. https://registry.opendata.aws/copernicus- dem/ Accessed: 2026-05-18
2021
-
[21]
Laurent, Carl Trypaluk, Wanru Wu, and Dennis Miller
Greg Fall, David Kitzmiller, Sandra Pavlovic, Ziya Zhang, Nathan Patrick, Michael St. Laurent, Carl Trypaluk, Wanru Wu, and Dennis Miller. 2023. The Office of Water Prediction’s Analysis of Record for Calibration, ver- sion 1.1: Dataset description and precipitation evaluation.JA WRA Jour- nal of the American Water Resources Association59, 6 (2023), 1246–...
arXiv 2023
-
[22]
Federal Emergency Management Agency. 2021. FEMA Flood Zone. FEMA-NFHL. https://msc.fema.gov Publication Date: December 26, 2021
2021
-
[23]
Federal Emergency Management Agency. 2024. The Cost of Flooding. https: //www.floodsmart.gov/know-your-risk/cost-of-flooding. Accessed: 2026-06-19
2024
-
[24]
Federal Emergency Management Agency. 2026. OpenFEMA Dataset: FIMA NFIP Redacted Claims - v2. https://www.fema.gov/openfema-data-page/fima-nfip- redacted-claims-v2
2026
-
[25]
Federal Emergency Management Agency. 2026. OpenFEMA Dataset: FIMA NFIP Redacted Policies - v2. https://www.fema.gov/openfema-data-page/fima-nfip- redacted-policies-v2
2026
-
[26]
Garcia, Antonia Sebastian, Kieran P
Helena M. Garcia, Antonia Sebastian, Kieran P. Fitzmaurice, Miyuki Hino, Elyssa L. Collins, and Gregory W. Characklis. 2025. Reconstructing Repeti- tive Flood Exposure Across 78 Events From 1996 to 2020 in North Carolina, USA. Earth’s Future13, 7 (July 2025), e2025EF006026. doi:10.1029/2025EF006026
-
[27]
Dan Hendrycks and Kevin Gimpel. 2016. Bridging Nonlinearities and Stochastic Regularizers with Gaussian Error Linear Units.CoRRabs/1606.08415 (2016). arXiv:1606.08415 http://arxiv.org/abs/1606.08415
Pith/arXiv arXiv 2016
-
[28]
Hans Hersbach, Bill Bell, Paul Berrisford, Shoji Hirahara, András Horányi, Joaquín Muñoz-Sabater, Julien Nicolas, Carole Peubey, Raluca Radu, Dinand Schepers, Adrian Simmons, Cornel Soci, Saleh Abdalla, Xavier Abellan, Gi- anpaolo Balsamo, Peter Bechtold, Gionata Biavati, Jean Bidlot, Massimo Bonavita, Giovanna De Chiara, Per Dahlgren, Dick Dee, Michail D...
2020
-
[29]
Zachary H. Hoylman. 2021. A 30m Topographic Wetness Index Dataset for the Continental United States. doi:10.5281/zenodo.4460354
-
[30]
Chia-Yu Hsu and Wenwen Li. 2023. Explainable GeoAI: can saliency maps help interpret artificial intelligence’s learning process? An empirical study on natural Conference acronym ’XX, June 03–05, 2018, Woodstock, NY Kawakami et al. feature detection.International Journal of Geographical Information Science37, 5 (May 2023), 963–987. doi:10.1080/13658816.202...
arXiv 2023
-
[31]
George Huffman, David Bolvin, Dan Braithwaite, Kuolin Hsu, Robert Joyce, Chris Kidd, Eric Nelkin, Soroosh Sorooshian, Erich Stocker, Jackson Tan, and David Wolff. 2020.Integrated Multi-satellite Retrievals for the Global Precipitation Measurement (GPM) Mission (IMERG). 343–353. doi:10.1007/978-3-030-24568- 9_19
-
[32]
Sergey Ioffe and Christian Szegedy. 2015. Batch normalization: accelerating deep network training by reducing internal covariate shift. InProceedings of the 32nd International Conference on Machine Learning - Volume 37(Lille, France) (ICML’15). JMLR.org, 448–456
2015
-
[33]
Hadi H. Jaafar, Farah A. Ahmad, and Naji El Beyrouthy. 2019. GCN250, new global gridded curve numbers for hydrologic modeling and design.Scientific Data6, 1 (Aug. 2019), 145. doi:10.1038/s41597-019-0155-x
-
[34]
Eric P. James and Russ S. Schumacher. 2024. Precipitation Proxies for Flash Flooding: A Seven-Year Analysis over the Contiguous United States.Journal of Hydrometeorology25, 9 (Sept. 2024), 1323–1344. doi:10.1175/JHM-D-23-0203.1
-
[35]
Arnold Kazadi, James Doss-Gollin, Antonia Sebastian, and Arlei Silva. 2024. FloodGNN-GRU: a spatio-temporal graph neural network for flood prediction. Environmental Data Science3 (2024), e21. doi:10.1017/eds.2024.19
-
[36]
Guolin Ke, Qi Meng, Thomas Finley, Taifeng Wang, Wei Chen, Weidong Ma, Qiwei Ye, and Tie-Yan Liu. 2017. LightGBM: a highly efficient gradient boosting decision tree. InProceedings of the 31st International Conference on Neural Information Processing Systems(Long Beach, California, USA)(NIPS’17). Curran Associates Inc., Red Hook, NY, USA, 3149–3157
2017
-
[37]
Mehta, and Karan Singh
Vijendra Kumar, Kul Vaibhav Sharma, Tommaso Caloiero, Darshan J. Mehta, and Karan Singh. 2023. Comprehensive Overview of Flood Modeling Approaches: A Review of Recent Advances.Hydrology10, 7 (July 2023), 141. doi:10.3390/ hydrology10070141
2023
-
[38]
Hyunho Lee and Wenwen Li. 2024. Improving interpretability of deep active learning for flood inundation mapping through class ambiguity indices using multi-spectral satellite imagery.Remote Sensing of Environment309 (Aug. 2024). doi:10.1016/j.rse.2024.114213
arXiv 2024
-
[39]
Wenzhong Li, Chengshuai Liu, Yingying Xu, Chaojie Niu, Runxi Li, Ming Li, Caihong Hu, and Lu Tian. 2024. An interpretable hybrid deep learning model for flood forecasting based on Transformer and LSTM.Journal of Hydrology: Regional Studies54 (Aug. 2024), 101873. doi:10.1016/j.ejrh.2024.101873
arXiv 2024
-
[40]
Gourley, Changhai Liu, Andreas F
Zhi Li, Shang Gao, Mengye Chen, Jonathan J. Gourley, Changhai Liu, Andreas F. Prein, and Yang Hong. 2022. The conterminous United States are projected to become more prone to flash floods in a high-end emissions scenario.Communica- tions Earth & Environment3, 1 (April 2022), 86. doi:10.1038/s43247-022-00409-6
-
[41]
Yaoxing Liao, Zhaoli Wang, Xiaohong Chen, and Chengguang Lai. 2023. Fast simulation and prediction of urban pluvial floods using a deep convolutional neural network model.Journal of Hydrology624 (2023), 129945. doi:10.1016/j. jhydrol.2023.129945
arXiv 2023
-
[42]
Tsung-Yi Lin, Priya Goyal, Ross Girshick, Kaiming He, and Piotr Dollár. 2020. Focal Loss for Dense Object Detection.IEEE Transactions on Pattern Analysis and Machine Intelligence42, 2 (Feb. 2020), 318–327. doi:10.1109/TPAMI.2018.2858826
arXiv 2020
-
[43]
Chia-Fu Liu, Lipai Huang, Kai Yin, Sam Brody, and Ali Mostafavi. 2024. Flood- DamageCast: Building flood damage nowcasting with machine-learning and data augmentation.International Journal of Disaster Risk Reduction114 (Nov. 2024), 104971. doi:10.1016/j.ijdrr.2024.104971
arXiv 2024
-
[44]
Ilya Loshchilov and Frank Hutter. 2019. Decoupled Weight Decay Regularization. doi:10.48550/arXiv.1711.05101 arXiv:1711.05101 [cs.LG]
-
[45]
Lundberg and Su-In Lee
Scott M. Lundberg and Su-In Lee. 2017. A unified approach to interpreting model predictions. InProceedings of the 31st International Conference on Neural Information Processing Systems(Long Beach, California, USA)(NIPS’17). Curran Associates Inc., Red Hook, NY, USA, 4768–4777
2017
-
[46]
Roland Löwe and Karsten Arnbjerg-Nielsen. 2020. Urban pluvial flood risk assess- ment – data resolution and spatial scale when developing screening approaches on the microscale.Natural Hazards and Earth System Sciences20, 4 (April 2020), 981–997. doi:10.5194/nhess-20-981-2020
-
[47]
Rotem Mayo, Oleg Zlydenko, Moral Bootbool, Shmuel Fronman, Oren Gilon, Avinatan Hassidim, Frederik Kratzert, Gila Loike, Yossi Matias, Yonatan Nakar, Grey Nearing, Reuven Sayag, Amitay Sicherman, Ido Zemach, and Deborah Cohen. 2026. Groundsource: A Dataset of Flood Events from News. doi:10.5281/ ZENODO.18647054
2026
-
[48]
Deo, Ramendra Prasad, Nawin Raj, and Shahab Abdulla
Mohammed Moishin, Ravinesh C. Deo, Ramendra Prasad, Nawin Raj, and Shahab Abdulla. 2021. Designing Deep-Based Learning Flood Forecast Model With ConvLSTM Hybrid Algorithm.IEEE Access9 (2021), 50982–50993. doi:10.1109/ ACCESS.2021.3065939
arXiv 2021
-
[49]
J. E. Nash. 1959. Systematic determination of unit hydrograph parame- ters.Journal of Geophysical Research (1896-1977)64, 1 (1959), 111–115. arXiv:https://agupubs.onlinelibrary.wiley.com/doi/pdf/10.1029/JZ064i001p00111 doi:10.1029/JZ064i001p00111
-
[50]
Grey Nearing, Deborah Cohen, Vusumuzi Dube, Martin Gauch, Oren Gilon, Shaun Harrigan, Avinatan Hassidim, Daniel Klotz, Frederik Kratzert, Asher Metzger, Sella Nevo, Florian Pappenberger, Christel Prudhomme, Guy Shalev, Shlomo Shenzis, Tadele Yednkachw Tekalign, Dana Weitzner, and Yossi Matias. 2024. Global prediction of extreme floods in ungauged watershe...
-
[51]
Benjamin Nelson-Mercer, Taeho Kim, Vinh Ngoc Tran, and Valeriy Ivanov. 2025. Pluvial flood impacts and policyholder responses throughout the United States. npj Natural Hazards2, 1 (Jan. 2025), 8. doi:10.1038/s44304-025-00058-7
-
[52]
Perry C. Oddo, John D. Bolten, Sujay V. Kumar, and Brian Cleary. 2024. Deep Convolutional LSTM for improved flash flood prediction.Frontiers in Water6 (Feb. 2024). doi:10.3389/frwa.2024.1346104
arXiv 2024
-
[53]
Ivan Petkov and Francesc Ortega. 2025. Learning from experience: Flooding and insurance take-up in the flood zone and its periphery.Journal of Risk and Insurance92, 2 (2025), 312–356. doi:10.1111/jori.70002
-
[54]
Supattra Puttinaovarat and Paramate Horkaew. 2020. Flood Forecasting System Based on Integrated Big and Crowdsource Data by Using Machine Learning Techniques.IEEE Access8 (2020), 5885–5905. doi:10.1109/ACCESS.2019.2963819
arXiv 2020
-
[55]
Mashrekur Rahman. 2026. Physically interpretable AlphaEarth foundation model embeddings enable LLM-based land surface intelligence.Remote Sensing Appli- cations: Society and Environment42 (April 2026), 102045. doi:10.1016/j.rsase.2026. 102045
-
[56]
Clément Rambour, Nicolas Audebert, Elise Koeniguer, Bertrand Le Saux, Michel Crucianu, and Mihai Datcu. 2020. SEN12-FLOOD : a SAR and Multispectral Dataset for Flood Detection. doi:10.21227/w6xz-s898
-
[57]
Youtong Rong, Paul Bates, Jeffrey Neal, Leanne Archer, Simbi Hatchard, and Elizabeth Kendon. 2024. Impact of Soil Moisture Dynamics and Precipitation Pattern on UK Urban Pluvial Flood Hazards Under Climate Change.Earth’s Future12, 5 (2024), e2023EF004073. doi:10.1029/2023EF004073
-
[58]
Bernice R. Rosenzweig, Lauren McPhillips, Heejun Chang, Chingwen Cheng, Claire Welty, Marissa Matsler, David Iwaniec, and Cliff I. Davidson. 2018. Plu- vial flood risk and opportunities for resilience.WIREs Water5, 6 (2018), e1302. arXiv:https://wires.onlinelibrary.wiley.com/doi/pdf/10.1002/wat2.1302 doi:10.1002/wat2.1302
-
[59]
Cédric Roussel and Klaus Böhm. 2025. Introducing Geo-Glocal Explainable Artificial Intelligence.IEEE Access13 (2025), 30952–30964. doi:10.1109/ACCESS. 2025.3541781
arXiv 2025
-
[60]
Cynthia Rudin. 2019. Stop explaining black box machine learning models for high stakes decisions and use interpretable models instead.Nature Machine Intelligence1, 5 (May 2019), 206–215. doi:10.1038/s42256-019-0048-x
-
[61]
Aishwarya Sarkar, Autrin Hakimi, Xiaoqiong Chen, Hai Huang, Chaoqun Lu, Ibrahim Demir, and Ali Jannesari. 2025. HydroGAT: Distributed Heterogeneous Graph Attention Transformer for Spatiotemporal Flood Prediction. InProceedings of the 33rd ACM International Conference on Advances in Geographic Information Systems(The Graduate Hotel Minneapolis, Minneapolis...
arXiv 2025
-
[62]
D. W. Shin, Steven Cocke, and Baek-Min Kim. 2022. A Systematic Revision of the NFIP Claims Hazard Data in Florida for Flood Risk Assessment.Applied Sciences 12, 7 (Jan. 2022), 3537. doi:10.3390/app12073537
-
[63]
Xinyi Shu, Zongxue Xu, Silong Zhang, Chenlei Ye, and Lei Yu. 2026. Assessing Pluvial Flooding Risk in Urban Areas with High Spatial Heterogeneity Using a Fused Physically-Based and Data-Driven Framework.International Journal of Disaster Risk Science(May 2026). doi:10.1007/s13753-026-00728-8
-
[64]
Sanah Suri and Maike Sonnewald. 2026. Trusting machine learning with physics: A fidelity verification framework for complex systems.ESS Open Archive2026, 0120 (2026). doi:10.22541/essoar.176894678.89831689/v1
arXiv 2026
-
[65]
Daniela Szwarcman, Sujit Roy, Paolo Fraccaro, Þorsteinn Elí Gíslason, Benedikt Blumenstiel, Rinki Ghosal, Pedro Henrique de Oliveira, Joao Lucas de Sousa Almeida, Rocco Sedona, Yanghui Kang, Srija Chakraborty, Sizhe Wang, Carlos Gomes, Ankur Kumar, Vishal Gaur, Myscon Truong, Denys Godwin, Sam Khallaghi, Hyunho Lee, Chia-Yu Hsu, Ata Akbari Asanjan, Besart...
arXiv 2026
-
[66]
Mehdi Taghizadeh, Zanko Zandsalimi, Mohammad Amin Nabian, Ma- jid Shafiee-Jood, and Negin Alemazkoor. 2025. Interpretable physics- informed graph neural networks for flood forecasting.Computer- Aided Civil and Infrastructure Engineering40, 18 (2025), 2629–
2025
-
[67]
Wright, Pedro Restrepo, and Valeriy Y
Vinh Ngoc Tran, Taeho Kim, Donghui Xu, Hoang Tran, Manh-Hung Le, Thanh- Nhan-Duc Tran, Jongho Kim, Trung Duc Tran, Daniel B. Wright, Pedro Restrepo, and Valeriy Y. Ivanov. 2025. AI Improves the Accuracy, Reliability, and Economic Value of Continental-Scale Flood Predictions.AGU Advances6, 3 (June 2025), e2025AV001678. doi:10.1029/2025AV001678 DELUGE: Towa...
-
[68]
Pankaj Upreti and CSP Ojha. 2021. Comparison of antecedent precipitation based rainfall-runoff models.Water Supply21, 5 (2021), 2122–2138
2021
-
[69]
Army Corps of Engineers
U.S. Army Corps of Engineers. 2022. National Structure Inventory (NSI) Base Data. https://www.hec.usace.army.mil/confluence/nsi
2022
-
[70]
U.S. Geological Survey (USGS). 2024. Annual NLCD Collection 1 Science Products. doi:10.5066/P94UXNTS
-
[71]
Gomez, Łukasz Kaiser, and Illia Polosukhin
Ashish Vaswani, Noam Shazeer, Niki Parmar, Jakob Uszkoreit, Llion Jones, Aidan N. Gomez, Łukasz Kaiser, and Illia Polosukhin. 2017. Attention is all you need. InProceedings of the 31st International Conference on Neural Information Processing Systems(Long Beach, California, USA)(NIPS’17). Curran Associates Inc., Red Hook, NY, USA, 6000–6010
2017
-
[72]
Markus Weiler, Julia Krumm, Ingo Haag, Hannes Leistert, Max Schmit, Andreas Steinbrich, and Andreas Hänsler. 2025. The Pluvial Flood Index (PFI): a new instrument for evaluating flash flood hazards and facilitating real-time warning. doi:10.5194/egusphere-2025-1519
-
[73]
Oliver E. J. Wing, Paul D. Bates, Niall D. Quinn, James T. S. Savage, Peter F. Uhe, Anthony Cooper, Thomas P. Collings, Nans Addor, Natalie S. Lord, Simbi Hatchard, Jannis M. Hoch, Joe Bates, Izzy Probyn, Sam Himsworth, Josué Ro- dríguez González, Malcolm P. Brine, Hamish Wilkinson, Christopher C. Samp- son, Andrew M. Smith, Jeffrey C. Neal, and Ivan D. H...
-
[74]
Oliver E. J. Wing, Nicholas Pinter, Paul D. Bates, and Carolyn Kousky. 2020. New insights into US flood vulnerability revealed from flood insurance big data.Nature Communications11, 1 (March 2020), 1444. doi:10.1038/s41467-020-15264-2
-
[75]
Woznicki, Jeremy Baynes, Stephanie Panlasigui, Megan Mehaffey, and Anne Neale
Sean A. Woznicki, Jeremy Baynes, Stephanie Panlasigui, Megan Mehaffey, and Anne Neale. 2019. Development of a spatially complete floodplain map of the conterminous United States using random forest.Science of The Total Environment 647 (Jan. 2019), 942–953. doi:10.1016/j.scitotenv.2018.07.353
-
[76]
Anagnostou, Kang He, Chongxun Mo, Hojjat Seyyedi, Albert J
Qing Yang, Xinyi Shen, Feifei Yang, Emmanouil N. Anagnostou, Kang He, Chongxun Mo, Hojjat Seyyedi, Albert J. Kettner, and Qingyuan Zhang. 2022. Predicting Flood Property Insurance Claims over CONUS, Fusing Big Earth Ob- servation Data.Bulletin of the American Meteorological Society103, 3 (March 2022), E791–E809. doi:10.1175/BAMS-D-21-0082.1
-
[77]
Stefano Zanardo and Jose Luis Salinas. 2022. An introduction to flood modeling for catastrophe risk management.WIREs Water9, 1 (2022), e1568. arXiv:https://wires.onlinelibrary.wiley.com/doi/pdf/10.1002/wat2.1568 doi:10.1002/wat2.1568
-
[78]
Lin Zhang, Huapeng Qin, Junqi Mao, Xiaoyan Cao, and Guangtao Fu. 2023. High temporal resolution urban flood prediction using attention-based LSTM models. Journal of Hydrology620 (May 2023), 129499. doi:10.1016/j.jhydrol.2023.129499
arXiv 2023
-
[79]
Stewart, Konrad Heidler, Yuanyuan Wang, Zhenghang Yuan, Thomas Dujardin, Qingsong Xu, and Yilei Shi
Xiao Xiang Zhu, Zhitong Xiong, Yi Wang, Adam J. Stewart, Konrad Heidler, Yuanyuan Wang, Zhenghang Yuan, Thomas Dujardin, Qingsong Xu, and Yilei Shi. 2026. On the foundations of Earth foundation models.Communications Earth & Environment7, 1 (Jan. 2026), 103. doi:10.1038/s43247-025-03127-x Conference acronym ’XX, June 03–05, 2018, Woodstock, NY Kawakami et ...
-
[2020]
2020), 024011
Leveraging machine learning for predicting flash flood damage in the Southeast US.Environmental Research Letters15, 2 (Feb. 2020), 024011. doi:10. 1088/1748-9326/ab6edd
2020
discussion (0)
Sign in with ORCID, Apple, or X to comment. Anyone can read and Pith papers without signing in.