REVIEW 1 major objections 6 minor 73 references
Galaxies with radio sources show double the hot-gas signal
Reviewed by Pith at T0; open to challenge. T0 means a machine referee read the full paper against a public rubric. the ladder, T0–T4 →
T0 review · glm-5.2
2026-07-10 02:17 UTC pith:GMO3U3GD
load-bearing objection Solid tSZ measurement with a real systematic finding; the central excess claim is probably real but the physical interpretation is unresolved. the 1 major comments →
Thermal Sunyaev-Zel'dovich Measurements of Locally Bright Galaxies with ACT DR6: Radio Source Contamination and Excess Compton-y Signal
The pith
A machine-rendered reading of the paper's core claim, the machinery that carries it, and where it could break.
Core claim
At fixed stellar mass, galaxies hosting co-spatial radio sources produce approximately twice the cylindrical Compton-y signal as those without, an excess that persists to halo scales (≥6 arcminutes) and is recovered independently in both ACT and Planck data. This is either a signature of radio-loud galaxies residing in more massive halos or of AGN feedback heating the circumgalactic medium.
What carries the argument
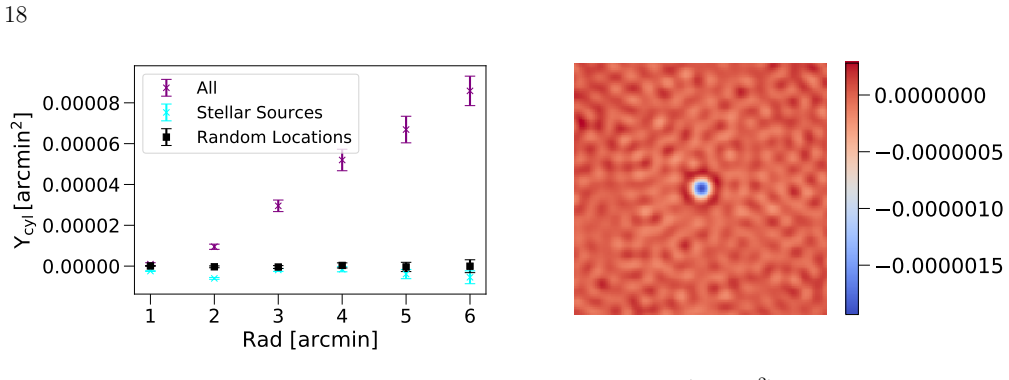
The argument rests on compensated aperture photometry (CAP) applied to component-separated Compton-y maps, which extracts the tSZ signal without assuming a gas pressure profile. The factor-of-two excess is established by subdividing the Locally Bright Galaxy sample using a 1-arcminute cross-match to a 1.4 GHz radio survey, then comparing the tSZ flux of the two subsamples within matched stellar mass bins. An empirical contamination test using stellar radio sources (which have no intrinsic tSZ signal) confirms that spurious Compton-y from residual radio emission is subdominant at the relevant radii.
Load-bearing premise
The correction for central radio source contamination — which subtracts the flux difference within 2 arcminutes between the two subsamples — is acknowledged by the authors to carry systematic uncertainties of roughly 50%, and the headline factor-of-two excess depends on this correction being approximately right.
What would settle it
A galaxy-galaxy lensing measurement showing that the two subsamples have identical halo mass distributions at fixed stellar mass would not falsify the excess itself (which is directly measured) but would shift the interpretation decisively toward the AGN-feedback explanation. Conversely, a measurement showing that radio-loud galaxies are ~50% more massive in halo mass at fixed stellar mass would attribute the entire excess to halo mass differences rather than feedback.
If this is right
- Future tSZ cross-correlation studies must characterize and report the radio source fraction in their galaxy samples, or risk conflating an astrophysical signal with a systematic contaminant.
- Galaxy-galaxy lensing measurements of the two subsamples (with and without radio sources) at fixed stellar mass would directly test whether the excess is a halo-mass difference or an AGN feedback effect.
- Upcoming radio surveys at ~1 GHz (e.g., DSA-2000) could identify the full population of contaminating radio sources and enable cleaner tSZ measurements.
- Higher-frequency CMB data from upcoming instruments (FYST, Simons Observatory) will reduce both dust contamination and the noise penalty of moment-based deprojection methods.
- If the excess is confirmed as AGN feedback, it provides a direct observational constraint on the thermal energy budget that AGN inject into the circumgalactic medium.
Where Pith is reading between the lines
- If the halo-mass explanation dominates, the result would imply that the stellar-to-halo mass relation has a previously unmeasured dependence on radio-loud AGN activity, which would affect how tSZ scaling relations are interpreted as mass proxies.
- If the AGN-feedback explanation dominates, the persistence of the excess to 6 arcminutes would imply that AGN jets deposit thermal energy well beyond the interstellar medium and into the outer circumgalactic medium, constraining the spatial coupling efficiency of feedback.
- The few-percent-level radio contamination, if uncorrected, could bias tSZ-derived scaling relations at a level comparable to current systematic-error budgets, particularly for galaxy samples selected at high stellar mass where the radio source fraction rises to ~30%.
- The inability of CMB halo lensing to distinguish the halo masses of the two subsamples at current signal-to-noise suggests that the question is answerable with next-generation optical weak lensing surveys (LSST, Euclid) but not with current CMB data.
Editorial analysis
A structured set of objections, weighed in public.
Referee Report
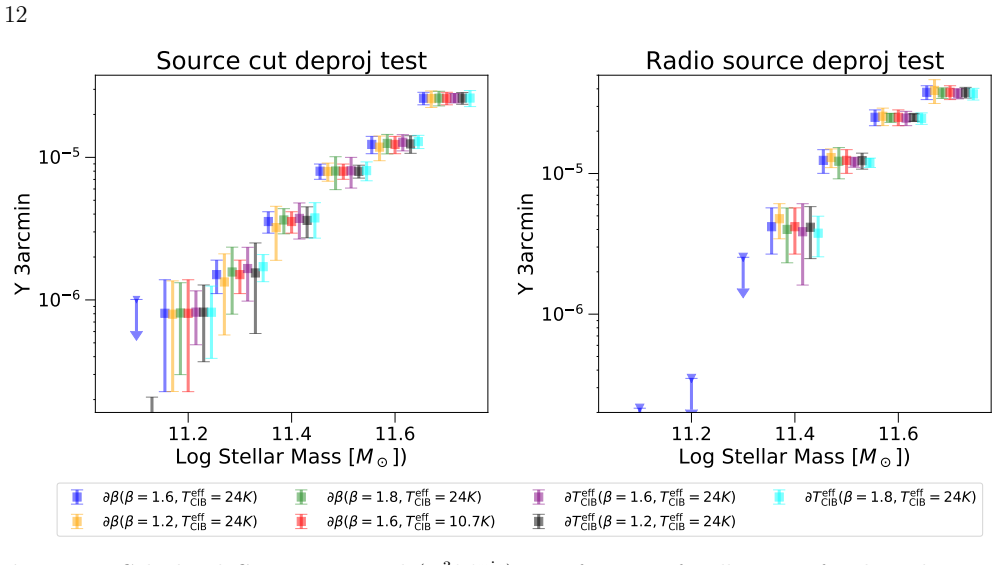
Summary. This paper re-examines the Planck measurement of the thermal Sunyaev-Zel'dovich (tSZ) signal from the Locally Bright Galaxy (LBG) sample using the ACT DR6 component-separated Compton-$y$ maps, which offer higher angular resolution and lower noise than Planck. The authors recover a power-law scaling between cylindrical Compton-$y$ and stellar mass, consistent with the original Planck result. The central new finding is a factor-of-two excess in $Y^{3'}_{cyl}$ in LBGs hosting co-spatial radio sources (identified via NVSS cross-matching) relative to those without, at fixed stellar mass. This excess persists to at least 6 arcmin, suggesting a halo-scale effect rather than a central point-source artifact. The authors consider two explanations: a systematic difference in halo mass at fixed stellar mass (consistent with Mandelbaum et al. 2009), or thermal energy injected into the CGM by AGN feedback. The result is independently recovered in the original Planck data when the same radio-source subselection is applied. Systematic tests in Appendix A, including single-frequency checks, stellar radio source cross-correlations, and CIB SED parameter variations, support the interpretation that the excess is intrinsic rather than an ILC artifact.
Significance. The identification of residual radio source contamination in component-separated tSZ maps and, more importantly, the factor-of-two excess Compton-$y$ signal in radio-source-hosting LBGs, is a timely and broadly relevant result for tSZ cross-correlation science. The analysis is grounded in public data (ACT DR6 $y$-maps, LBG sample, NVSS) with no fitting to the target result, and the consistency across three ILC methods and independent Planck data lends credibility. The systematic tests are thorough: the stellar radio source cross-correlation (Appendix A.2) is a particularly clean null test, and the single-frequency second-derivative analysis (Appendix A.1) provides compelling spectral evidence that the central residual is synchrotron rather than dust. The discussion of AGN energetics (Section 5) is appropriately circumspect, acknowledging the inability to distinguish between the halo-mass and AGN-feedback explanations. The recommendation that radio-source subselection become a standard systematic check is well-motivated by the evidence presented.
major comments (1)
- The paper does not explicitly verify that the two subsamples (with and without co-spatial radio sources) have comparable redshift distributions within each stellar mass bin. Because the tSZ measurement is angular ($Y_{cyl}$ in arcmin$^2$), a systematic difference in redshift would produce an apparent excess in the radio-source subsample even if the physical halos were identical: lower-redshift halos subtend larger angles. Radio-loud AGN are known to preferentially reside in massive ellipticals in denser environments, which could correlate with redshift within a fixed stellar-mass bin. The authors state that the stellar mass distributions are 'practically identical' (Appendix A.4, Figure 8) and adopt $z=0.25$ for the $E_{th}$ calculation (Section 5), but no direct comparison of the redshift distributions of the two subsamples is shown. A simple histogram or Kolmogorov-Smirnov test of the红
minor comments (6)
- Section 2.2: The statement that the two most massive bins contain 40 and 131 galaxies and are dropped is slightly ambiguous — it would help to state the stellar mass ranges of these dropped bins explicitly.
- Figure 1 caption: The label 'CIB' for Row 2 is potentially confusing given that Row 3 is labeled 'CIB moment'; consider 'CIB deproj.' for Row 2 to match the text terminology.
- Table 1: The column header 'U' is described as 'estimate of the binding energy' but the caption does not specify the redshift or halo mass assumptions used beyond the reference to Planck Collaboration et al. (2013); a brief note in the caption would aid reproducibility.
- Section 5: The ADAF energetics estimate (Eq. for $E_{inj}$) uses fiducial values $f_{acc}=0.02$, $M_{BH}=10^9 M_*$, $Delta t=2$ Gyr, but the text does not discuss how sensitive the conclusion ($E_{inj}$ sufficient in most bins) is to these choices beyond stating they scale linearly. A sentence noting the range of plausible values would strengthen this.
- Appendix A.4: The CMB lensing cross-spectrum (Figure 9) has S/N~2 and cannot distinguish the two subsamples; this is honestly stated, but the text could note that this null result does not rule out a ~50% halo mass difference given the measurement precision.
- Minor typographical: 'Universi´ e Paris-Saclay' in the affiliation list should be 'Universit´ e Paris-Saclay'.
Circularity Check
No circularity: measurements derived directly from public data products, comparisons are genuine cross-checks, energetics uses standard physics
full rationale
The paper's central claims are derived from independent, publicly available data products: ACT DR6 Compton-y maps, the LBG galaxy sample (from SDSS/NYU-VAGC), and the NVSS radio catalog for subsample definition. The power-law scaling (Figure 2, left) is measured directly via compensated aperture photometry on stacked maps and compared to—not derived from—Planck results. The factor-of-two excess in radio-source LBGs (Figure 2, right; Figure 3; Table 1) is a direct differential measurement between two subsamples defined by an external catalog cross-match, and the paper explicitly states the qualitative excess exists even without the admittedly approximate radio contamination correction ('without these corrections, sources with co-spatial radio sources still show more Compton-y flux than those without'). The energetics calculation (Eqs. 5-7) uses standard SZ physics with stated assumptions (z=0.25, electron fraction, binding energy formula), and the stellar-to-halo mass relation is cited from Planck Collaboration et al. (2013) as an external input. The systematic tests in Appendix A use genuinely independent tracers (FIRST stellar radio sources as a null test, ACT CMB lensing maps for halo mass comparison, Planck MMF with different weights). Self-citations to Battaglia et al. (2010, 2012, 2017) provide methodological context but are not load-bearing for the measurement chain. No step in the derivation reduces to its own inputs by construction.
Axiom & Free-Parameter Ledger
free parameters (6)
- Aperture radius theta_ap =
3 arcmin
- Radio contamination correction method =
Difference in CAP fluxes within 2 arcmin between subsamples
- AGN accretion efficiency epsilon_acc =
0.02
- Black hole mass M_BH =
10^9 M_sun
- AGN duty cycle timescale Delta_t =
2 Gyr
- Redshift z for E_th calculation =
0.25
axioms (6)
- domain assumption The tSZ spectral function f(nu) is known and relativistic corrections are negligible for galaxy-scale gas temperatures
- domain assumption The CAP filter with 3 arcmin aperture captures the majority of the tSZ signal while minimizing background
- domain assumption Radio sources identified by 1 arcmin NVSS cross-match are genuinely co-spatial with LBGs, not chance projections
- domain assumption The stellar radio sources from FIRST have no intrinsic Compton-y signal
- domain assumption The needlet ILC weights do not introduce scale-dependent radio leakage that mimics a halo-scale signal
- domain assumption The universal pressure profile (UPP) from Arnaud et al. (2010) is adequate for converting Planck MMF fluxes to CAP-equivalent fluxes
read the original abstract
The Planck collaboration found a remarkable power-law relation between stellar mass and the thermal Sunyaev-Zeldovich (tSZ) signal for the Locally Bright Galaxy (LBG) sample, spanning over a decade in stellar mass. We re-examine this measurement using the Atacama Cosmology Telescope (ACT) DR6 component-separated Compton-$y$ maps, which provide lower noise and higher angular resolution than Planck, on a footprint spanning one-third of the sky. We recover a consistent power-law scaling between the cylindrical Compton-$y$ signal and stellar mass. Additionally, we identify residual contamination in the tSZ signal from radio sources at the few percent-level, which has not been considered previously. In parallel, we identify a factor-of-two excess in the Compton-$y$ signal in LBGs hosting co-spatial radio sources relative to those without, at fixed stellar mass. This excess persists to radii of at least 6 arcminutes, suggesting a halo-scale effect, and is recovered in the original Planck results when the same radio source subselection is applied. We consider two physical explanations: a systematic difference in halo mass at fixed stellar mass, or thermal energy injected into the circumgalactic medium by Active Galactic Nuclei, although we cannot currently distinguish between the two. This result has direct implications for tSZ cross-correlation measurements more broadly, and necessitates careful characterization of the radio source fraction in galaxy samples in future analyses.
Figures





Reference graph
Works this paper leans on
-
[1]
The Seventh Data Release of the Sloan Digital Sky Survey
Abazajian, K. N., Adelman-McCarthy, J. K., Ag¨ ueros, M. A., et al. 2009, ApJS, 182, 543, doi: 10.1088/0067-0049/182/2/543
work page internal anchor Pith review doi:10.1088/0067-0049/182/2/543 2009
-
[2]
2025, JCAP, 2025, 034, doi: 10.1088/1475-7516/2025/08/034 21
Abitbol, M., Abril-Cabezas, I., Adachi, S., et al. 2025, JCAP, 2025, 034, doi: 10.1088/1475-7516/2025/08/034 21
-
[3]
2019, JCAP, 2019, 056, doi: 10.1088/1475-7516/2019/02/056
Ade, P., Aguirre, J., Ahmed, Z., et al. 2019, JCAP, 2019, 056, doi: 10.1088/1475-7516/2019/02/056
-
[4]
2020, JCAP, 2020, 047, doi: 10.1088/1475-7516/2020/12/047
Aiola, S., Calabrese, E., Maurin, L., et al. 2020, JCAP, 2020, 047, doi: 10.1088/1475-7516/2020/12/047
-
[5]
Allison, R., Lindsay, S. N., Sherwin, B. D., et al. 2015, MNRAS, 451, 849, doi: 10.1093/mnras/stv991
-
[6]
2021, PhRvD, 103, 063514, doi: 10.1103/PhysRevD.103.063514
Amodeo, S., Battaglia, N., Schaan, E., et al. 2021, PhRvD, 103, 063514, doi: 10.1103/PhysRevD.103.063514
-
[7]
Angulo, R. E., & White, S. D. M. 2010, MNRAS, 405, 143, doi: 10.1111/j.1365-2966.2010.16459.x
-
[8]
Arnaud, M., Pratt, G. W., Piffaretti, R., et al. 2010, A&A, 517, A92, doi: 10.1051/0004-6361/200913416
-
[9]
Sievers, J. L. 2012, ApJ, 758, 74, doi: 10.1088/0004-637X/758/2/74
-
[10]
Battaglia, N., Bond, J. R., Pfrommer, C., Sievers, J. L., & Sijacki, D. 2010, ApJ, 725, 91, doi: 10.1088/0004-637X/725/1/91
-
[11]
Battaglia, N., Ferraro, S., Schaan, E., & Spergel, D. N. 2017, JCAP, 2017, 040, doi: 10.1088/1475-7516/2017/11/040
-
[12]
Blanton, M. R., Schlegel, D. J., Strauss, M. A., et al. 2005, AJ, 129, 2562, doi: 10.1086/429803
-
[13]
Bleem, L. E., Crawford, T. M., Ansarinejad, B., et al. 2022, ApJS, 258, 36, doi: 10.3847/1538-4365/ac35e9 CCAT-Prime Collaboration, Aravena, M.,
-
[14]
Austermann, J. E., et al. 2023, ApJS, 264, 7, doi: 10.3847/1538-4365/ac9838
-
[15]
Chluba, J., Hill, J. C., & Abitbol, M. H. 2017, MNRAS, 472, 1195, doi: 10.1093/mnras/stx1982
-
[16]
Chluba, J., Nagai, D., Sazonov, S., & Nelson, K. 2012, MNRAS, 426, 510, doi: 10.1111/j.1365-2966.2012.21741.x
-
[17]
2022, A&A, 666, A156, doi: 10.1051/0004-6361/202243101
Comparat, J., Truong, N., Merloni, A., et al. 2022, A&A, 666, A156, doi: 10.1051/0004-6361/202243101
-
[18]
Condon, J. J., Cotton, W. D., Greisen, E. W., et al. 1996, Astronomy Data Image Library
work page 1996
-
[19]
Duivenvoorden, A. J., et al. 2024, PhRvD, 109, 063530, doi: 10.1103/PhysRevD.109.063530
-
[20]
Coulton, W. R., Duivenvoorden, A. J., Atkins, Z., et al. 2026, PhRvD, 113, 043520, doi: 10.1103/n7p5-pc66
-
[21]
Crichton, D., Gralla, M. B., Hall, K., et al. 2016, MNRAS, 458, 1478, doi: 10.1093/mnras/stw344
-
[22]
2009, title Clustering of luminous red galaxies - III
Cunha, C. E., Lima, M., Oyaizu, H., Frieman, J., & Lin, H. 2009, MNRAS, 396, 2379, doi: 10.1111/j.1365-2966.2009.14908.x Dark Energy Survey Collaboration, Abbott, T.,
-
[23]
Abdalla, F. B., et al. 2016, MNRAS, 460, 1270, doi: 10.1093/mnras/stw641 Dav´ e, R., Angl´ es-Alc´ azar, D., Narayanan, D., et al. 2019, MNRAS, 486, 2827, doi: 10.1093/mnras/stz937 de Jong, J. T. A., Verdoes Kleijn, G. A., Kuijken, K. H., & Valentijn, E. A. 2013, Experimental Astronomy, 35, 25, doi: 10.1007/s10686-012-9306-1
-
[24]
Delabrouille, J., Cardoso, J.-F., & Patanchon, G. 2003, MNRAS, 346, 1089, doi: 10.1111/j.1365-2966.2003.07069.x
-
[25]
Dicker, S. R., Battistelli, E. S., Bhandarkar, T., et al. 2021, MNRAS, 508, 2600, doi: 10.1093/mnras/stab2679
-
[26]
R., Perez Sarmiento, K., Mason, B., et al
Dicker, S. R., Perez Sarmiento, K., Mason, B., et al. 2024, ApJ, 970, 84, doi: 10.3847/1538-4357/ad4e35 Euclid Collaboration, Mellier, Y., Abdurro’uf, et al. 2025, A&A, 697, A1, doi: 10.1051/0004-6361/202450810
-
[27]
2023, ApJ, 957, 17, doi: 10.3847/1538-4357/acfd26
Grayson, S., Scannapieco, E., & Dav´ e, R. 2023, ApJ, 957, 17, doi: 10.3847/1538-4357/acfd26
-
[28]
2015, ApJ, 808, 151, doi: 10.1088/0004-637X/808/2/151
Battaglia, N. 2015, ApJ, 808, 151, doi: 10.1088/0004-637X/808/2/151
-
[29]
Guo, Q., White, S., Boylan-Kolchin, M., et al. 2011, MNRAS, 413, 101, doi: 10.1111/j.1365-2966.2010.18114.x
-
[30]
Hadzhiyska, B., Ferraro, S., Farren, G. S., Sailer, N., & Zhou, R. 2025, PhRvD, 112, 123507, doi: 10.1103/mdhz-fgj8
-
[31]
Hall, K. R., Zakamska, N. L., Addison, G. E., et al. 2019, MNRAS, 490, 2315, doi: 10.1093/mnras/stz2751
-
[32]
The DSA-2000 -- A Radio Survey Camera
Hallinan, G., Ravi, V., Weinreb, S., et al. 2019, in Bulletin of the American Astronomical Society, Vol. 51, 255, doi: 10.48550/arXiv.1907.07648
work page internal anchor Pith review Pith/arXiv arXiv doi:10.48550/arxiv.1907.07648 2019
-
[33]
Hand, N., Appel, J. W., Battaglia, N., et al. 2011, ApJ, 736, 39, doi: 10.1088/0004-637X/736/1/39
-
[34]
Helfand, D. J., White, R. L., & Becker, R. H. 2015, ApJ, 801, 26, doi: 10.1088/0004-637X/801/1/26 22
-
[35]
2007, New Journal of Physics, 9, 441, doi: 10.1088/1367-2630/9/12/441
Hu, W., DeDeo, S., & Vale, C. 2007, New Journal of Physics, 9, 441, doi: 10.1088/1367-2630/9/12/441
-
[36]
1998, ApJ, 502, 7, doi: 10.1086/305876 Ivezi´ c,ˇZ., Kahn, S
Itoh, N., Kohyama, Y., & Nozawa, S. 1998, ApJ, 502, 7, doi: 10.1086/305876 Ivezi´ c,ˇZ., Kahn, S. M., Tyson, J. A., et al. 2019, ApJ, 873, 111, doi: 10.3847/1538-4357/ab042c
-
[37]
Kadir, S., Ried Guachalla, B., Yuan, S., Schaan, E., & Wechsler, R. H. 2026, arXiv e-prints, arXiv:2603.04397, doi: 10.48550/arXiv.2603.04397
-
[38]
Peacock, J. A. 2020, MNRAS, 491, 5464, doi: 10.1093/mnras/stz3351 Le Brun, A. M. C., McCarthy, I. G., & Melin, J.-B. 2015, MNRAS, 451, 3868, doi: 10.1093/mnras/stv1172
-
[39]
H., Ferraro, S., Schaan, E., et al
Liu, R. H., Ferraro, S., Schaan, E., et al. 2025, PhRvD, 112, 083561, doi: 10.1103/jqn8-19gx
-
[40]
Madhavacheril, M. S., Qu, F. J., Sherwin, B. D., et al. 2024, ApJ, 962, 113, doi: 10.3847/1538-4357/acff5f
-
[41]
White, S. D. M. 2009, MNRAS, 393, 377, doi: 10.1111/j.1365-2966.2008.14235.x
-
[42]
McCarthy, F., & Hill, J. C. 2024, PhRvD, 109, 023528, doi: 10.1103/PhysRevD.109.023528
-
[43]
Holder, G. P. 2014, MNRAS, 440, 3645, doi: 10.1093/mnras/stu543
-
[44]
G., Amon, A., Schaye, J., et al
McCarthy, I. G., Amon, A., Schaye, J., et al. 2025, MNRAS, 540, 143, doi: 10.1093/mnras/staf731
-
[45]
2021, ApJ, 913, 88, doi: 10.3847/1538-4357/abf2b4
Meinke, J., B¨ ockmann, K., Cohen, S., et al. 2021, ApJ, 913, 88, doi: 10.3847/1538-4357/abf2b4
-
[46]
Melin, J.-B., Bartlett, J. G., & Delabrouille, J. 2006, A&A, 459, 341, doi: 10.1051/0004-6361:20065034
-
[47]
2021, ApJ, 919, 2, doi: 10.3847/1538-4357/ac0cea
Moser, E., Amodeo, S., Battaglia, N., et al. 2021, ApJ, 919, 2, doi: 10.3847/1538-4357/ac0cea
-
[48]
2022, ApJ, 933, 133, doi: 10.3847/1538-4357/ac70c6
Moser, E., Battaglia, N., Nagai, D., et al. 2022, ApJ, 933, 133, doi: 10.3847/1538-4357/ac70c6
-
[49]
The Atacama Cosmology Telescope: DR6 Maps
Naess, S., Guan, Y., Duivenvoorden, A. J., et al. 2025, arXiv e-prints, arXiv:2503.14451, doi: 10.48550/arXiv.2503.14451
work page internal anchor Pith review Pith/arXiv arXiv doi:10.48550/arxiv.2503.14451 2025
-
[50]
1994, ApJL, 428, L13, doi: 10.1086/187381 National Academies of Sciences, Engineering, and Medicine
Narayan, R., & Yi, I. 1994, ApJL, 428, L13, doi: 10.1086/187381 National Academies of Sciences, Engineering, and Medicine. 2023, Pathways to Discovery in Astronomy and Astrophysics for the 2020s (Washington, DC: The National Academies Press), doi: 10.17226/26141
-
[51]
2022, PhRvD, 105, 123526, doi: 10.1103/PhysRevD.105.123526
Pandey, S., Gatti, M., Baxter, E., et al. 2022, PhRvD, 105, 123526, doi: 10.1103/PhysRevD.105.123526
-
[52]
Simulating Galaxy Formation with the IllustrisTNG Model
Pillepich, A., Springel, V., Nelson, D., et al. 2018, MNRAS, 473, 4077, doi: 10.1093/mnras/stx2656 Planck Collaboration, Ade, P. A. R., Aghanim, N., et al. 2013, A&A, 557, A52, doi: 10.1051/0004-6361/201220941 Planck Collaboration, Aghanim, N., Arnaud, M., et al. 2016, A&A, 594, A22, doi: 10.1051/0004-6361/201525826 Planck Collaboration, Akrami, Y., Ander...
work page internal anchor Pith review doi:10.1093/mnras/stx2656 2018
-
[53]
2025, JCAP, 2025, 051, doi: 10.1088/1475-7516/2025/10/051
Popik, C., Battaglia, N., Kusiak, A., Bolliet, B., & Colin Hill, J. 2025, JCAP, 2025, 051, doi: 10.1088/1475-7516/2025/10/051
-
[54]
Qu, F. J., Sherwin, B. D., Madhavacheril, M. S., et al. 2024, ApJ, 962, 112, doi: 10.3847/1538-4357/acfe06
-
[55]
2023, ApJ, 954, 83, doi: 10.3847/1538-4357/ace0c6
Raghunathan, S., & Omori, Y. 2023, ApJ, 954, 83, doi: 10.3847/1538-4357/ace0c6
-
[56]
Remazeilles, M., Delabrouille, J., & Cardoso, J.-F. 2011, MNRAS, 418, 467, doi: 10.1111/j.1365-2966.2011.19497.x
-
[57]
2021, MNRAS, 503, 2478, doi: 10.1093/mnras/stab648
Remazeilles, M., Rotti, A., & Chluba, J. 2021, MNRAS, 503, 2478, doi: 10.1093/mnras/stab648
-
[58]
J., McQuinn, M., & Anderson, S
Ruan, J. J., McQuinn, M., & Anderson, S. F. 2015, ApJ, 802, 135, doi: 10.1088/0004-637X/802/2/135 S´ anchez, J., Omori, Y., Chang, C., et al. 2023, MNRAS, 522, 3163, doi: 10.1093/mnras/stad1167
-
[59]
Scannapieco, E., Thacker, R. J., & Couchman, H. M. P. 2008, ApJ, 678, 674, doi: 10.1086/528948
-
[60]
2021, PhRvD, 103, 063513, doi: 10.1103/PhysRevD.103.063513
Schaan, E., Ferraro, S., Amodeo, S., et al. 2021, PhRvD, 103, 063513, doi: 10.1103/PhysRevD.103.063513
-
[61]
2023, MNRAS, 526, 4978, doi: 10.1093/mnras/stad2419 23
Schaye, J., Kugel, R., Schaller, M., et al. 2023, MNRAS, 526, 4978, doi: 10.1093/mnras/stad2419 23
-
[62]
D., Das, S., Hajian, A., et al
Sherwin, B. D., Das, S., Hajian, A., et al. 2012, PhRvD, 86, 083006, doi: 10.1103/PhysRevD.86.083006
-
[63]
2019, MNRAS, 483, 342, doi: 10.1093/mnras/sty3162
Shirasaki, M. 2019, MNRAS, 483, 342, doi: 10.1093/mnras/sty3162
-
[64]
Siegel, J. C., Amon, A., McCarthy, I. G., et al. 2026, ApJ, 1003, 151, doi: 10.3847/1538-4357/ae5dc2
-
[65]
2017, MNRAS, 468, 577, doi: 10.1093/mnras/stx492
Puchwein, E., & Sijacki, D. 2017, MNRAS, 468, 577, doi: 10.1093/mnras/stx492
-
[66]
2016, ApJ, 819, 128, doi: 10.3847/0004-637X/819/2/128
Spacek, A., Scannapieco, E., Cohen, S., Joshi, B., & Mauskopf, P. 2016, ApJ, 819, 128, doi: 10.3847/0004-637X/819/2/128
-
[67]
Springel, V., White, S. D. M., Jenkins, A., et al. 2005, Nature, 435, 629, doi: 10.1038/nature03597
-
[68]
Sunyaev, R. A., & Zeldovich, Y. B. 1970, Ap&SS, 7, 3, doi: 10.1007/BF00653471
-
[69]
Surrao, K. M., & Hill, J. C. 2024, PhRvD, 110, 063509, doi: 10.1103/PhysRevD.110.063509
-
[70]
Tumlinson, J., Peeples, M. S., & Werk, J. K. 2017, ARA&A, 55, 389, doi: 10.1146/annurev-astro-091916-055240
work page internal anchor Pith review doi:10.1146/annurev-astro-091916-055240 2017
-
[71]
Verdier, L., Melin, J.-B., Bartlett, J. G., et al. 2016, A&A, 588, A61, doi: 10.1051/0004-6361/201527431
-
[72]
Worpel, H., Brown, M. J. I., Jones, D. H., Floyd, D. J. E., & Beutler, F. 2013, ApJ, 772, 64, doi: 10.1088/0004-637X/772/1/64
-
[73]
2024, A&A, 690, A267, doi: 10.1051/0004-6361/202449412
Zhang, Y., Comparat, J., Ponti, G., et al. 2024, A&A, 690, A267, doi: 10.1051/0004-6361/202449412
discussion (0)
Sign in with ORCID, Apple, or X to comment. Anyone can read and Pith papers without signing in.