REVIEW 4 major objections 6 minor 16 references
Evaluation of Machine Learning Models in Student Academic Performance Prediction
T0 review · 4 major / 6 minor · reviewed 2026-08-07 · deepseek-v4-flash
Pith's one-line read On 480 student records, a standard multilayer perceptron reaches 86.46% maximum test accuracy and the best 10-fold average accuracy, arguing that simple neural networks can be data-efficient for small tabular datasets.
desk verdict A cleanly written benchmark undone by a load-bearing flaw: feature selection leaks test information into the folds, and the headline 86.46% accuracy is not backed by the reported tables. read the letter →
The pith
A machine-rendered reading of the paper's core claim, the machinery that carries it, and where it could break.
The reading
What carries the argument
The mechanism carrying the argument is the feature-selection protocol (chi-square test on categorical features, exploratory data analysis and Pearson correlation on numerical features) combined with a consistent evaluation regime: 5-fold cross-validation for hyperparameter tuning, repeated hold-out validation, and 10-fold cross-validation repeated ten times, across three feature protocols (FS, WBF, WOBF). The MLPC is a standard multilayer perceptron with relu activation, learning rate 0.0001, batch size 100, and a pyramid architecture of [128,64,32,16,8]. SHAP values are the interpretation mechanism used to attribute predictions to features and to cross-check the feature-selection choices.
What would settle it
Re-run the experiments with feature selection performed inside each cross-validation fold and compare the FS protocol's average accuracy with WBF's; if the gap disappears or reverses, the reported feature-selection gain comes from test-set leakage rather than from the method itself.
Extended reading notes
Core claim
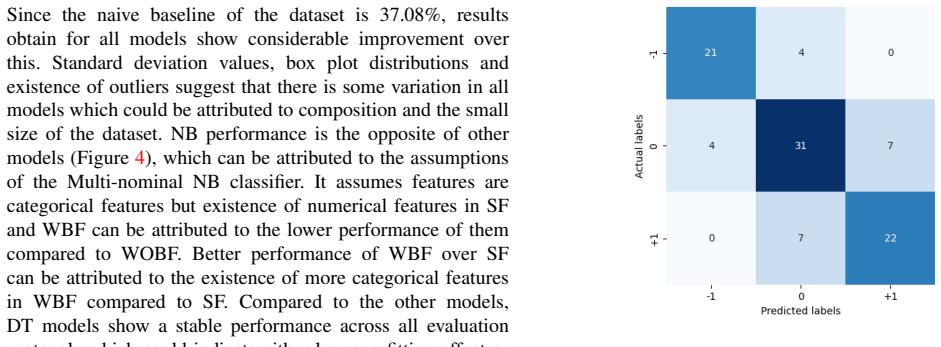
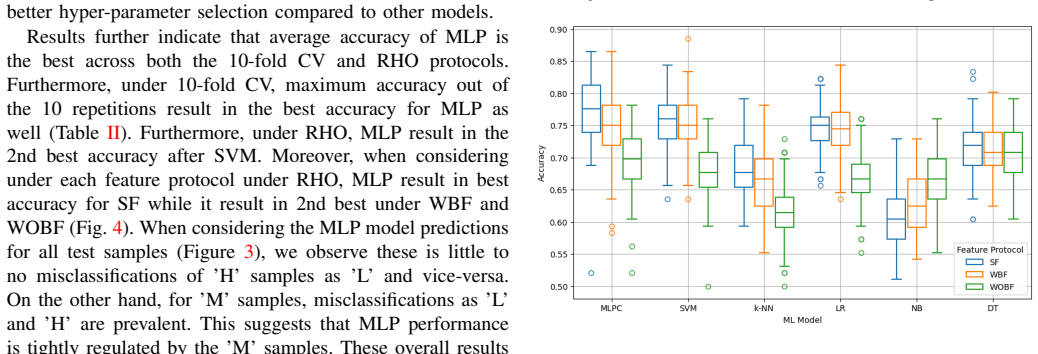
The central claim is that the MLPC model, a multilayer perceptron with a pyramid structure of up to five layers and 256 nodes, is the strongest performer on SAPData: it attains the highest 10-fold cross-validation average accuracy (79.58% test, 99.65% train) and the second-highest maximum accuracy overall (86.46%, behind SVM's 88.65%), while maintaining best or near-best accuracy under repeated hold-out validation. The paper further claims that the introduced feature-selection protocol, which removes four categorical features flagged by the chi-square test and keeps behavioral features flagged by exploratory data analysis, improves average accuracy for most models relative to using all features or dropping behavioral features. SHAP analysis is presented as corroborating evidence: behavioral features, especially student absence, dominate model predictions, and this matches the feature-selection outcome. The conclusion drawn is that neural networks have potential as data-efficient models for small tabular educational datasets.
Load-bearing premise
The claim that feature selection improves accuracy rests on the assumption that the chi-square-based feature selection is applied only to training folds, with no test-fold information leaking into the chosen features.
Editorial extensions
If this is right
- If the MLP result holds, schools with small local datasets can use a simple feed-forward network for early-warning predictions instead of requiring tens of thousands of records.
- The reported accuracy gains of the FS protocol over WBF and WOBF imply that a small amount of statistical feature screening can improve model performance on this dataset.
- SHAP-based explanations identify behavioral features, including student absence, as the dominant predictors, implying that behavioral data should be collected in school datasets.
- On the WOBF protocol, the authors' implementations beat published benchmarks by 10-20 percentage points, suggesting the tuned hyperparameters transfer well to simpler feature sets.
Reading between the lines
- If the data-efficiency finding generalizes, local early-warning systems in schools could be built from routine attendance and participation logs, which are cheaper to collect than long academic histories.
- A natural robustness check is to run the same feature-selection protocol nested inside the cross-validation folds; the paper does not report this, so the FS advantage could shrink or disappear if test information leaks into feature selection.
- The dominance of absence in SHAP values suggests a testable causal hypothesis: absence may proxy engagement and drive performance, which could be examined with intervention or quasi-experimental data rather than correlation alone.
- Comparing MLP against modern tabular baselines on the same protocols would clarify whether the MLP advantage is specific to this dataset or a general small-data property.
Editorial analysis
A structured set of objections, weighed in public.
Referee Report
Summary. The paper benchmarks six classifiers (MLPC, SVM, k-NN, LR, NB, DT) on the SAPData student-performance dataset (480 records) under three feature protocols (FS, WBF, WOBF) and three evaluation protocols (5-fold CV, 10-fold CV repeated 10 times, and repeated hold-out). The central claims are that a chi-square-based feature-selection protocol improves accuracy, that MLPC is the best-performing and 'data-efficient' model with a claimed 86.46% maximum test accuracy, and that SHAP analysis validates the feature choices. The paper also compares its results with prior work on SAPData.
Significance. If the claims held, the paper would provide a useful benchmark for classical ML models on a small educational dataset and evidence that MLPs can be competitive on tabular data. The paper does make a constructive attempt to combine multiple evaluation protocols and to address leakage for feature scaling (Section III-C). It also applies SHAP to give model-level explanations, which is a positive step for interpretability. However, the main empirical claims are undermined by methodological problems in the evaluation protocol, and the headline accuracy is not reproducible from the reported tables.
major comments (4)
- [Sections III-B and III-E] The chi-square-based feature selection is described in Section III-B as a fixed preprocessing step, but Section III-E does not state that feature selection is nested inside each cross-validation fold. Because the feature mask is chosen using the full 480-record dataset, test-fold label information enters the selection process. This leaks label information into the FS protocol and biases all FS-protocol accuracies upward, directly affecting the comparison between FS, WBF, and WOBF and the ranking of models. The authors explicitly avoid leakage for scaling (Section III-C) but not for feature selection; the manuscript must either demonstrate that FS was nested inside the training folds or rerun the experiments with nested feature selection.
- [Abstract and Section V] The headline claim that 'MLPC obtained 86.46% maximum accuracy for test set' is not traceable to any table. Table II reports, for 10-fold CV, a maximum of 80.00 for MLPC under SF, and the RHO column reports only mean and standard deviation, not maxima. If 86.46% is a maximum over RHO repeats, that maximum is not reported, and using a maximum rather than the average for the central claim is a post-hoc selection that overstates the model's typical performance. This issue is load-bearing because the abstract and conclusion rest on this number.
- [Section IV-C and Table III] The comparison with previous work uses the maximum accuracy over the 10 repeats of 10-fold CV ('(Our)' in Table III), while the cited prior results are single estimates. This is an unfair comparison because the maximum of a set of runs is an order statistic that is biased upward relative to a single run, and the paper uses this to claim margins of 10%-20% under the WOBF protocol. The comparison should use the average accuracy (or a confidence interval) and report the variation across the repeats.
- [Abstract and Section IV-B] The abstract reports a training accuracy of 99.65% versus a test accuracy of 79.58% under 10-fold CV for MLPC. This large gap indicates substantial overfitting, which is not reconciled with the paper's claim that the MLP is a 'data-efficient' model. The authors do not discuss regularization, early stopping, or model complexity in light of this gap; at minimum, the overfitting should be acknowledged as a limitation when claiming data efficiency.
minor comments (6)
- [Section III-A] The table cross-reference appears as 'Table??' in the text; a proper table number is missing.
- [Section III-D] There is a typo in 'we chose not to use and bagging' — 'and' should be 'any'.
- [Section IV-B] The statement that 'under RHO, MLP result in the 2nd best accuracy after SVM' is contradicted by Table II, where MLPC has the highest RHO mean under the SF protocol (77.25 vs 75.42 for SVM). This sentence should be clarified or corrected.
- [Section IV-A] The acronym is inconsistent: the paper introduces 'FS' but later uses 'SF' in Table II and Figure 5; please unify the notation.
- [Section V] The conclusion mentions '1986 experiments' without explaining how this number is derived; please provide a calculation or citation.
- [Section IV-D] The SHAP discussion refers to '48 samples of test set' but the evaluation was repeated hold-out with 90:10 splits on 480 records; the specific test set size should be clarified if this refers to a single run.
Circularity Check
No significant circularity: the paper is an empirical benchmark whose claims do not reduce to their own inputs.
full rationale
This paper makes no mathematical derivation whose output is definitionally tied to its input. The central claims are empirical: feature selection is implemented with chi-square tests and EDA, models are trained and evaluated under three protocols, and MLP is reported to obtain the highest average accuracy. No fitted parameter is renamed as a prediction: hyperparameters tuned under 5-fold CV are explicitly described as hyperparameters and are then reused in other protocols, which is a transfer, not a prediction of the tuned values themselves. The FS protocol is chosen from statistical tests and EDA, not from the reported accuracies, so the accuracy comparison is not a self-definitional fit. The SHAP analysis interprets the trained model and checks feature importance; it is not the source of the accuracy results, and the claim that SHAP 'validates' feature selection is an internal consistency check rather than a circular derivation. The paper contains no load-bearing self-citations: references [3], [7], and other prior work are external to the present authors. Potential leakage in applying feature selection before cross-validation folds is a methodological validity concern, and the unreported 86.46% maximum is a traceability concern, but neither is a circularity of the derivation chain. Therefore the circularity score is 0.
Assumptions & free parameters
free parameters (8)
- MLP hyperparameters (learning rate, architecture, batch size) =
lr=0.0001, layers=[128,64,32,16,8], batch=100
- k-NN hyperparameters (k, p) =
k=15, p=1
- SVM regularization C =
C=1
- LR regularization C and type =
C=0.1, L2
- NB smoothing alpha =
alpha=1
- DT hyperparameters (max depth, split criteria, etc.) =
criterion=gini, splitter=random, max_depth=6, max_samples_split=4, max_samples_leaf=4
- Chi-square feature selection significance threshold =
0.05 (5%)
- Decision to include all four numerical behavioral features =
included RaisedHands, VisitedResources, AnnouncementsView, Discussion
assumptions (5)
- domain assumption SAPData is representative of high school settings and its features cover the four factor categories.
- ad hoc to paper Label encoding is acceptable for nominal categorical features in this dataset.
- ad hoc to paper Hyperparameters tuned on the FS protocol with 5-fold CV transfer to all other protocols and feature sets.
- domain assumption Accuracy is the primary evaluation metric despite class imbalance.
- domain assumption The original SAPData label thresholds (L<70, M 70-89, H>=90) define meaningful classes.
Cite this review
Pith. "Pith review of Evaluation of Machine Learning Models in Student Academic Performance Prediction." pith.science (2026). https://pith.science/paper/HW2XJZ3A
@misc{pith2026250608047,
  author       = {Pith},
  title        = {Pith review of: Evaluation of Machine Learning Models in Student Academic Performance Prediction},
  year         = {2026},
  howpublished = {\url{https://pith.science/paper/HW2XJZ3A}},
  note         = {Machine review of arXiv:2506.08047}
}
read the original abstract
This research investigates the use of machine learning methods to forecast students' academic performance in a school setting. Students' data with behavioral, academic, and demographic details were used in implementations with standard classical machine learning models including multi-layer perceptron classifier (MLPC). MLPC obtained 86.46% maximum accuracy for test set across all implementations. Under 10-fold cross validation, MLPC obtained 79.58% average accuracy for test set while for train set, it was 99.65%. MLP's better performance over other machine learning models strongly suggest the potential use of neural networks as data-efficient models. Feature selection approach played a crucial role in improving the performance and multiple evaluation approaches were used in order to compare with existing literature. Explainable machine learning methods were utilized to demystify the black box models and to validate the feature selection approach.
Figures


Figures from the paper (2 more)

Reference graph
Works this paper leans on
-
[1]
A. Abu Saa, M. Al-Emran, and K. Shaalan, “Factors affecting students’ performance in higher education: a systematic review of predictive data mining techniques,”Technology, Knowledge and Learning, vol. 24, no. 4, pp. 567–598, 2019
work page 2019
-
[2]
A. I. Beltr ´an-Velasco, M. Donoso-Gonz´alez, and V . J. Clemente-Su´arez, “Analysis of perceptual, psychological, and behavioral factors that affect the academic performance of education university students.”Physiology & Behavior, vol. 238, p. 113497, 2021
work page 2021
-
[3]
Mining educational data to predict student’s academic performance using ensemble methods,
E. A. Amrieh, T. Hamtini, and I. Aljarah, “Mining educational data to predict student’s academic performance using ensemble methods,” International journal of database theory and application, vol. 9, no. 8, pp. 119–136, 2016
work page 2016
-
[4]
Open university learning analytics dataset,
J. Kuzilek, M. Hlosta, and Z. Zdrahal, “Open university learning analytics dataset,”Scientific Data, vol. 4, no. 1, 2017
work page 2017
- [5]
-
[6]
Predicting student outcomes in online courses using machine learning techniques: A review,
A. Alhothali, M. Albsisi, H. Assalahi, and T. Aldosemani, “Predicting student outcomes in online courses using machine learning techniques: A review,”Sustainability, vol. 14, no. 6199, 2017
work page 2017
-
[7]
Preprocessing and analyzing educational data set using x-api for improving student’s performance,
E. A. Amrieh, T. Hamtini, and Aljarah, “Preprocessing and analyzing educational data set using x-api for improving student’s performance,” IEEE Jordan Conference on Applied Electrical Engineering and Com- puting Technologies (AEECT), pp. 1–5, 2015
work page 2015
-
[8]
M. Wafi, U. Faruq, and A. A. Supianto, “Automatic feature selection for modified k-nearest neighbor to predict student’s academic perfor- mance,” in2019 International Conference on Sustainable Information Engineering and Technology (SIET). IEEE, 2019, pp. 44–48
work page 2019
Show all 16 references
-
[9]
Finding key integer values in many features for learners’ academic performance prediction,
Y . Tanabe, K. Kagari, Y . Kitanaka, K. Takeuchi, and S. Hirokawa, “Finding key integer values in many features for learners’ academic performance prediction,” in2017 9th International Conference on Edu- cation Technology and Computers. ACM, 2017, pp. 167–171
2017
-
[10]
Predict student’s academic perfor- mance and evaluate the impact of different attributes on the performance using data mining techniques,
M. H. Rahman and M. R. Islam, “Predict student’s academic perfor- mance and evaluate the impact of different attributes on the performance using data mining techniques,” in2017 2nd international conference on electrical & electronic engineering (iceee). IEEE, 2017, pp. 1–4
2017
-
[11]
Predicting academic performance of students using a hybrid data mining approach,
B. K. Francis and S. S. Babu, “Predicting academic performance of students using a hybrid data mining approach,”Journal of medical systems, vol. 43, no. 6, p. 162, 2019
2019
-
[12]
An adaptive feature selection algorithm for student performance prediction,
K. Roy and D. M. Farid, “An adaptive feature selection algorithm for student performance prediction,”IEEE Access, 2024
2024
-
[13]
A unified approach to interpreting model predictions
S. Lundberg and S. I. Lee, “A unified approach to interpreting model predictions.” arXiv, 2017
2017
-
[14]
Academic achievement prediction in higher education through interpretable modeling,
S. Wang and B. Luo, “Academic achievement prediction in higher education through interpretable modeling,”PLOS ONE, vol. 19, no. 9, 2024
2024
-
[15]
Explainable ai for data driven learning analytics: A holistic approach to engage advisors in knowledge discovery,
N. Nur, A. Benedict, O. Eltayeby, W. Dou, M. Dorodchi, X. Niu, M. L. Macher, and C. N. Chambers, “Explainable ai for data driven learning analytics: A holistic approach to engage advisors in knowledge discovery,”EDULEARN22 Proc, pp. 10 300—-10 306, 2022
2022
-
[16]
Predicting and interpreting student performance using ensemble models and shapley additive explanations,
H. Sahlaoui, E. A. A. Alaoui, A. Nayyar, S. Agoujil, and M. M. Jaber, “Predicting and interpreting student performance using ensemble models and shapley additive explanations,”IEEE Access, pp. 152 688— -152 703, 2021
2021
Reviewed August 7, 2026 · model on record in the stance chip above.
Discussion (0). Sign in to comment.