REVIEW 2 major objections 4 minor 77 references
This paper reports the first large-sample clustering measurement of Lyα blobs, showing they occupy dark matter halos of roughly 10^12 solar masses at z≈2.4 and 3.1.
Reviewed by Pith at T0; open to challenge. T0 means a machine referee read the full paper against a public rubric. the ladder, T0–T4 →
T0 review · deepseek-v4-flash
2026-08-03 12:38 UTC pith:KN4YYOJA
load-bearing objection Largest LAB clustering sample to date, but the ACF and CCF don't agree and the paper's headline halo-mass claim rests on the ACF side. the 2 major comments →
ODIN: Clustering Properties of Lyα Blobs at z sim 2.4 and 3.1
The pith
A machine-rendered reading of the paper's core claim, the machinery that carries it, and where it could break.
Core claim
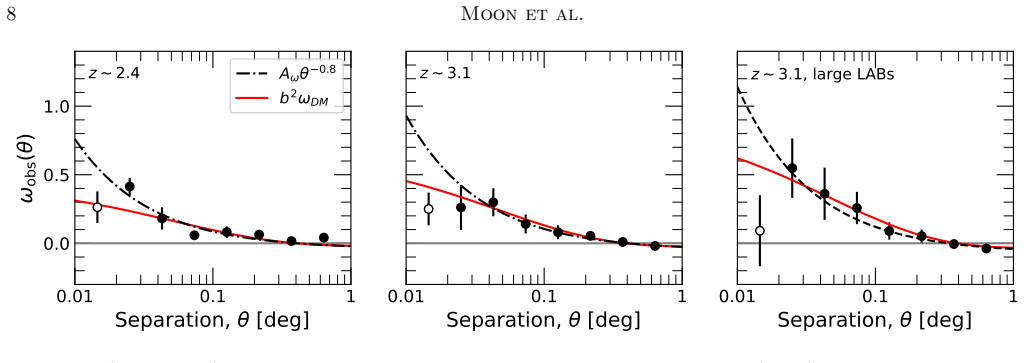
From the angular auto-correlation functions of 103 and 112 Lyα blobs at z≈2.4 and 3.1, the paper reports bias factors b = 4.0±0.8 and 3.8±0.7, correlation lengths r0 = 6.5±1.0 and 5.2±1.4 h^-1 Mpc, and infers median halo masses of 4.2×10^12 and 1.1×10^12 solar masses. A simplified halo-occupation model gives minimum halo masses of 2.8×10^12 and 7.4×10^11 solar masses and occupation fractions of roughly 11% and 3% of all halos above those thresholds. The authors conclude that blobs inhabit massive dark matter halos and likely trace proto-group environments that evolve into present-day ~10^13-solar-mass halos, where massive elliptical galaxies or low-mass galaxy groups reside.
What carries the argument
The analysis is carried by the angular two-point correlation function (measured with the Landy-Szalay estimator), which is converted to a galaxy bias b through the relation ω_LAB = b^2 ω_m using Limber's equation and a linear matter power spectrum. The bias is then mapped to halo mass via a Sheth-Tormen-style bias-halo mass relation, with a halo mass function and a constant occupation fraction used to derive minimum and median halo masses. A cross-correlation with the more abundant Lyα emitters serves as an independent check on the auto-correlation result.
Load-bearing premise
The analysis converts the measured clustering amplitude to a halo mass using a deterministic, linear bias model—assuming blobs trace the dark matter density field exactly, with no nonlinear or stochastic scatter—and the paper's own cross-correlation measurement is 2.1σ lower at z≈2.4, so if that difference is intrinsic, the linear-bias conversion fails and the quoted halo masses are not valid.
What would settle it
Measure the auto- and cross-correlation functions of the full ~1,000-blob ODIN sample (or an equivalent large sample) and compute the ratio b_CCF^2 / b_ACF^2; if it remains below unity by more than 3σ at either redshift, the deterministic linear-bias assumption is ruled out and the halo masses derived from the ACF amplitude are overestimates.
If this is right
- Lyα blobs join submillimeter galaxies and quasars as tracers of ~10^12-solar-mass halos at z~2–3, while Lyα emitters and Lyman-break galaxies trace far less massive halos.
- The inferred present-day halo mass of ~10^13 solar masses implies blobs are ancestors of low-mass galaxy groups or central galaxies of massive ellipticals, not of typical field galaxies.
- Bright or large blobs at z≈3.1 appear to live in halos about five times more massive than the full blob sample, suggesting size or luminosity correlates with halo mass.
- If the auto-correlation result is correct, only a few to ten percent of halos above the minimum mass actually host a detectable blob, making blobs a rare but highly biased tracer of the densest structures.
- The discrepancy between auto- and cross-correlation biases implies that a joint analysis with the full ~1,000-blob survey sample will be needed to decide whether the simple linear-bias model is adequate.
Where Pith is reading between the lines
- A persistent gap between cross-correlation and auto-correlation biases would not only lower the quoted halo masses but also reveal that blobs cluster nonlinearly or stochastically, likely tied to their preference for cosmic filaments—an effect the current measurement is not powerful enough to separate from sampling noise.
- The linear-bias conversion implicitly assumes blobs are a representative subset of halos at a given mass; a testable extension is to measure the environment-dependent clustering of blobs relative to filaments and nodes, which should show stronger stochasticity if the filament association is physically important.
- The halo occupation fraction derived here (3–11%) could be checked against hydrodynamical simulations that predict how often a massive halo's gas reservoir produces observable extended Lyα emission; if simulations give much higher fractions, the blob sample may be missing many faint or low-surface-brightness members.
- The method of using a redshift distribution adopted from Lyα emitters for the blobs could be improved by spectroscopic follow-up of a blob subsample; if blobs live at slightly different redshifts within the narrowband, the correlation length and bias would shift, changing the inferred halo masses.
Editorial analysis
A structured set of objections, weighed in public.
Referee Report
Summary. This paper reports angular auto-correlation function (ACF) measurements for 103 Lyα blobs at z≈2.4 and 112 at z≈3.1 from the ODIN survey in the extended COSMOS field. Using a power-law fit with slope fixed to β=0.8, after excluding the smallest angular bin, the authors derive correlation lengths r0=6.5±1.0 and 5.2±1.4 h⁻¹ Mpc, respectively, and bias factors b=4.0±0.8 and 3.8±0.7 from the ratio of the LAB ACF to the linear matter ACF. These bias values are converted to halo masses through the Mo & White/Sheth–Tormen bias–mass relation, giving median halo masses of 4.2×10¹² M⊙ and 1.1×10¹² M⊙, and the paper concludes that LABs trace massive, proto-group-scale halos that evolve to ~10¹³ M⊙ by z=0. As a cross-check, the paper also measures the cross-correlation between LABs and LAEs, obtaining b=1.9±0.6 and 2.6±0.3, which imply an order-of-magnitude lower halo mass; the discrepancy is discussed but not quantitatively resolved.
Significance. If the ACF-based result holds, this is a significant step: it would establish LABs as statistical tracers of ~10¹² M⊙ halos at z≈2–3, connecting them to proto-groups and massive present-day ellipticals. The paper's strengths include the largest uniform LAB sample used for clustering to date, a contiguous 9 deg² field, a standard Landy–Szalay estimator with jackknife errors, an explicit cross-correlation check with LAEs, and comparisons with previous counts-in-cells and stellar-to-halo-mass-relation estimates. The authors are also candid about the ACF–CCF tension and the limitations of the simple linear bias model. However, the central scientific claim is conditional on resolving that internal tension, so the paper's impact is currently limited.
major comments (2)
- [§3.2.1, Tables 1–3; §4.1] The paper's central claim that LABs occupy ~10¹² M⊙ halos rests entirely on the ACF-derived biases b=4.0±0.8 and 3.8±0.7 via Eq. (6). The CCF analysis in §3.2.1 gives b_LAB=1.9±0.6 and 2.6±0.3, corresponding to halo masses ~2×10¹¹ M⊙, an order of magnitude lower. The discrepancy is 2.1σ and 1.6σ and is discussed in §4.1, but the paper does not present a joint ACF+CCF fit, the cross-covariance between the two estimators, or a quantitative model of stochastic/nonlinear bias. As written, the abstract and Section 5 assert the ACF-based conclusion without making the resolution of this internal tension a condition. This is load-bearing: if the CCF is correct, the 'massive halo' conclusion fails; if the ACF is correct, the CCF must be explained. The authors should either present a joint analysis that captures the covariance and quantifies the significance of the difference, or substantially wea
- [§3.1.2, Eq. (6), Eq. (7)] The halo mass conversion assumes deterministic linear bias (ω_LAB=b²ω_m) and the Mo & White/Sheth–Tormen bias–mass relation. Section 4.1 correctly notes that if the ACF–CCF discrepancy is intrinsic, LAB clustering is not described by the simple linear bias model. But the bias-to-mass step is not tested for this possibility. The paper should demonstrate that the inferred masses are robust to (i) a scale-dependent/nonlinear bias term, and (ii) the choice of halo bias model and mass definition; otherwise the 10¹² M⊙ values are only as good as the linear-bias assumption that the paper itself calls into question. A simple HOD or simulation-calibrated bias model would address this.
minor comments (4)
- [§5, §4.2, Table 2] There are internal number inconsistencies: Section 5 bullet 2 calls 5.1×10¹² and 1.4×10¹² M⊙ 'median halo masses,' but Table 2 lists these as the single-mass M_h values, with M_h,med = 4.2×10¹² and 1.1×10¹² M⊙. Section 4.2 quotes the ODIN z≈3.1 median as 2.1×10¹² M⊙ and M_h,min as 9.4×10¹¹ M⊙, whereas Table 2 gives 1.1×10¹² M⊙ and 7.4×10¹¹ M⊙, respectively. These need correction.
- [§3.1, Eq. (4)] The redshift distribution of LABs is assumed identical to that of ODIN LAEs from White et al. (2024). Because LABs are selected by a different surface-brightness criterion, this assumption could bias the Limber inversion. A brief sensitivity test with an alternative dN/dz (e.g., a top-hat filter profile) would make the robustness of r0 and b transparent.
- [§3.1, Figure 2] The ACF fit excludes the first angular bin (40″–70″) as a suspected one-halo term. The authors state that the results are insensitive to this choice, but the supporting tests are not shown. Including a figure or table with β free, or with the first bin included, would help readers assess the stability of the fit given the short baseline of the fitted range.
- [§3.1.3, Eq. (9)] The HOD modeling assumes a constant occupation fraction above a sharp minimum mass and at most one LAB per halo. This simplification is acknowledged, but the inferred f_LAB and median mass are quoted with formal uncertainties that do not include model uncertainty. A sentence noting that model choice dominates the systematic error would be appropriate.
Circularity Check
No significant circularity: LAB clustering analysis uses external bias-mass relations and independent cross-checks.
full rationale
The derivation chain runs: observed pair counts (Eq. 1) to power-law ACF with integral constraint (Eqs. 2-3); bias via b^2 = omega/omega_m (Eq. 6), with omega_m from the linear CCL matter power spectrum and Limber projection applied to an adopted dN/dz from external DESI LAE observations (White et al. 2024); halo mass via the analytic Mo & White (2002) bias-mass relation (Eq. 7) and Sheth & Tormen (1999) mass function (Eqs. 9-10). None of these steps defines its output in terms of the paper's own fitted parameters; the conversion relations are external analytic results and the redshift distribution is an external measurement. The CCF analysis (Section 3.2.1) provides an independent cross-check using LAE bias from White et al. (2024); the fact that it gives lower bias (b = 1.9 +/- 0.6, 2.6 +/- 0.3 vs. b = 4.0 +/- 0.8, 3.8 +/- 0.7) and the paper's own Section 4.1 caveat that an intrinsic difference would imply non-linear/stochastic bias is a robustness limitation, not a circular reduction. Self-citations (Moon et al. 2025 for selection; Ramakrishnan et al. for random-catalog construction and protocluster bias) supply data provenance and comparison values, not the load-bearing theoretical premise. The central halo-mass claim therefore does not reduce, by construction or by self-citation, to its inputs.
Axiom & Free-Parameter Ledger
free parameters (2)
- Power-law slope β =
0.8 (fixed)
- LAB redshift distribution dN/dz =
adopted from ODIN LAEs (White et al. 2024)
axioms (7)
- domain assumption Flat ΛCDM cosmology with ΩΛ=0.7, Ωm=0.3, ns=0.95, h=0.7, σ8=0.8
- domain assumption LABs have the same redshift distribution dN/dz as ODIN LAEs from DESI (White et al. 2024)
- domain assumption The angular correlation function is a power law with fixed slope β=0.8 (γ=1.8) over fitted scales
- domain assumption Linear deterministic bias: ω_LAB = b^2 ω_m, with scale-independent bias on the fitted range
- domain assumption Simplified HOD: at most one LAB per halo above M_h,min, with constant occupation fraction f_LAB
- standard math Sheth-Tormen mass function and Mo & White (2002) bias formula with a=0.707, b=0.5, c=0.6, δc=1.69
- domain assumption Mean halo mass growth from the Millennium simulation (Fakhouri et al. 2010) applies to LAB host halos
read the original abstract
Spatially extended Ly$\alpha$ nebulae, known as Ly$\alpha$ blobs (LABs), are a rare population at $z > 2$ that are thought to trace proto-groups or the progenitors of massive galaxies in the present-day universe. However, their dark matter halo properties (e.g., halo mass) are still uncertain due to their rarity and strong field-to-field variation. The One-hundred-deg$^2$ DECam Imaging in Narrowbands (ODIN) survey has discovered 103 and 112 LABs in the extended ($\sim$9~\sqdeg) COSMOS field at $z\sim2.4$ and 3.1, respectively, enabling estimation of their bias and host halo masses through clustering analysis. We measure the angular auto-correlation functions (ACFs) of LABs and derive galaxy bias factors of $b$ = $4.0\pm0.8$ and $3.8\pm0.7$, corresponding to minimum halo masses of $2.8^{+3.0}_{-1.8}$ and $0.7^{+0.8}_{-0.5}\times10^{12}~M_\odot$ and median halo masses of $4.2^{+3.8}_{-2.5}$ and $1.1^{+1.1}_{-0.7}\times10^{12}~M_\odot$ at $z\sim2.4$ and 3.1, respectively. LABs occupy $\sim$11$^{+39}_{-8}$\% and $\sim$3$^{+9}_{-2}$\% of all dark matter halos above these minimum halo masses. These findings suggest that LABs inhabit massive dark matter halos, likely tracing proto-group environments that evolve into present-day massive halos ($\sim$10$^{13}~M_\odot$), where massive elliptical galaxies or galaxy groups reside, by $z=0$.
Figures


Reference graph
Works this paper leans on
-
[1]
Alexander, D. M., Simpson, J. M., Harrison, C. M., et al. 2016, MNRAS, 461, 2944, doi: 10.1093/mnras/stw1509
-
[2]
2017, ApJ, 850, 178, doi: 10.3847/1538-4357/aa960f Arrigoni Battaia, F., Prochaska, J
Ao, Y., Matsuda, Y., Henkel, C., et al. 2017, ApJ, 850, 178, doi: 10.3847/1538-4357/aa960f Arrigoni Battaia, F., Prochaska, J. X., Hennawi, J. F., et al. 2018, MNRAS, 473, 3907, doi: 10.1093/mnras/stx2465
-
[3]
Bardeen, J. M., Bond, J. R., Kaiser, N., & Szalay, A. S. 1986, ApJ, 304, 15, doi: 10.1086/164143
doi:10.1086/164143 1986
-
[4]
Berlind, A. A., & Weinberg, D. H. 2002, ApJ, 575, 587, doi: 10.1086/341469
doi:10.1086/341469 2002
-
[5]
Borisova, E., Cantalupo, S., Lilly, S. J., et al. 2016, ApJ, 831, 39, doi: 10.3847/0004-637X/831/1/39 B˘ adescu, T., Yang, Y., Bertoldi, F., et al. 2017, ApJ, 845, 172, doi: 10.3847/1538-4357/aa8220
-
[6]
E., Alonso, D., Krause, E., et al
Chisari, N. E., Alonso, D., Krause, E., et al. 2019, ApJS, 242, 2, doi: 10.3847/1538-4365/ab1658
-
[7]
Daddi, E., Valentino, F., Rich, R. M., et al. 2021, A&A, 649, A78, doi: 10.1051/0004-6361/202038700
-
[8]
Daddi, E., Rich, R. M., Valentino, F., et al. 2022, ApJL, 926, L21, doi: 10.3847/2041-8213/ac531f
-
[9]
1999, ApJ, 520, 24, doi: 10.1086/307428
Dekel, A., & Lahav, O. 1999, ApJ, 520, 24, doi: 10.1086/307428
-
[10]
Dey, A., Bian, C., Soifer, B. T., et al. 2005, ApJ, 629, 654, doi: 10.1086/430775
-
[11]
2015, A&A, 576, L7, doi: 10.1051/0004-6361/201425532
Durkalec, A., Le F` evre, O., de la Torre, S., et al. 2015, A&A, 576, L7, doi: 10.1051/0004-6361/201425532
-
[12]
Eftekharzadeh, S., Myers, A. D., White, M., et al. 2015, MNRAS, 453, 2779, doi: 10.1093/mnras/stv1763
-
[13]
2010, MNRAS, 406, 2267, doi: 10.1111/j.1365-2966.2010.16859.x 12Moon et al
Fakhouri, O., Ma, C.-P., & Boylan-Kolchin, M. 2010, MNRAS, 406, 2267, doi: 10.1111/j.1365-2966.2010.16859.x 12Moon et al
arXiv 2010
-
[14]
M., Gawiser, E., Ramakrishnan, V., et al
Firestone, N. M., Gawiser, E., Ramakrishnan, V., et al. 2024, ApJ, 974, 217, doi: 10.3847/1538-4357/ad71c9
-
[15]
Fry, J. N., & Gaztanaga, E. 1993, ApJ, 413, 447, doi: 10.1086/173015
doi:10.1086/173015 1993
-
[16]
2007, ApJ, 671, 278, doi: 10.1086/522955
Gawiser, E., Francke, H., Lai, K., et al. 2007, ApJ, 671, 278, doi: 10.1086/522955
doi:10.1086/522955 2007
-
[17]
Geach, J. E., Sobral, D., Hickox, R. C., et al. 2012, MNRAS, 426, 679, doi: 10.1111/j.1365-2966.2012.21725.x
arXiv 2012
-
[18]
Geach, J. E., Alexander, D. M., Lehmer, B. D., et al. 2009, ApJ, 700, 1, doi: 10.1088/0004-637X/700/1/1 Gonz´ alez Lobos, J., Arrigoni Battaia, F., Chang, S.-J., et al. 2023, A&A, 679, A41, doi: 10.1051/0004-6361/202346879
-
[19]
2010, ApJ, 714, 255, doi: 10.1088/0004-637X/714/1/255
Guaita, L., Gawiser, E., Padilla, N., et al. 2010, ApJ, 714, 255, doi: 10.1088/0004-637X/714/1/255
-
[20]
2018, PASJ, 70, S33, doi: 10.1093/pasj/psx129
He, W., Akiyama, M., Bosch, J., et al. 2018, PASJ, 70, S33, doi: 10.1093/pasj/psx129
-
[21]
2025, ApJL, 988, L57, doi: 10.3847/2041-8213/adec82
Herrera, D., Gawiser, E., Benda, B., et al. 2025, ApJL, 988, L57, doi: 10.3847/2041-8213/adec82
-
[22]
Hickox, R. C., Wardlow, J. L., Smail, I., et al. 2012, MNRAS, 421, 284, doi: 10.1111/j.1365-2966.2011.20303.x
arXiv 2012
-
[23]
2019, MNRAS, 483, 3950, doi: 10.1093/mnras/sty3219
Hong, S., Dey, A., Lee, K.-S., et al. 2019, MNRAS, 483, 3950, doi: 10.1093/mnras/sty3219
-
[24]
1984, ApJL, 284, L9, doi: 10.1086/184341
Kaiser, N. 1984, ApJL, 284, L9, doi: 10.1086/184341
doi:10.1086/184341 1984
-
[25]
2018, PASJ, 70, L6, doi: 10.1093/pasj/psy087
Kato, Y., Matsuda, Y., Iono, D., et al. 2018, PASJ, 70, L6, doi: 10.1093/pasj/psy087
-
[26]
1999, AJ, 118, 2547, doi: 10.1086/301139
Waddington, I. 1999, AJ, 118, 2547, doi: 10.1086/301139
-
[27]
2019, PASJ, 71, L2, doi: 10.1093/pasj/psz055 Kovaˇ c, K., Somerville, R
Kikuta, S., Matsuda, Y., Cen, R., et al. 2019, PASJ, 71, L2, doi: 10.1093/pasj/psz055 Kovaˇ c, K., Somerville, R. S., Rhoads, J. E., Malhotra, S., &
-
[28]
2007, ApJ, 668, 15, doi: 10.1086/520668
Wang, J. 2007, ApJ, 668, 15, doi: 10.1086/520668
doi:10.1086/520668 2007
-
[29]
2016, MNRAS, 455, 3333, doi: 10.1093/mnras/stv2392
Kubo, M., Yamada, T., Ichikawa, T., et al. 2016, MNRAS, 455, 3333, doi: 10.1093/mnras/stv2392
-
[30]
2018, PASJ, 70, 4, doi: 10.1093/pasj/psx148
Kusakabe, H., Shimasaku, K., Ouchi, M., et al. 2018, PASJ, 70, 4, doi: 10.1093/pasj/psx148
-
[31]
Landy, S. D., & Szalay, A. S. 1993, ApJ, 412, 64, doi: 10.1086/172900
doi:10.1086/172900 1993
-
[32]
Lee, K.-S., Giavalisco, M., Gnedin, O. Y., et al. 2006, ApJ, 642, 63, doi: 10.1086/500387
doi:10.1086/500387 2006
-
[33]
2024, ApJ, 962, 36, doi: 10.3847/1538-4357/ad165e
Lee, K.-S., Gawiser, E., Park, C., et al. 2024, ApJ, 962, 36, doi: 10.3847/1538-4357/ad165e
-
[34]
2024, ApJS, 275, 27, doi: 10.3847/1538-4365/ad812c
Li, M., Zhang, H., Cai, Z., et al. 2024, ApJS, 275, 27, doi: 10.3847/1538-4365/ad812c
-
[35]
Limber, D. N. 1953, ApJ, 117, 134, doi: 10.1086/145672
doi:10.1086/145672 1953
-
[36]
2004, AJ, 128, 569, doi: 10.1086/422020
Matsuda, Y., Yamada, T., Hayashino, T., et al. 2004, AJ, 128, 569, doi: 10.1086/422020
doi:10.1086/422020 2004
-
[37]
2011, MNRAS, 410, L13, doi: 10.1111/j.1745-3933.2010.00969.x
Matsuda, Y., Yamada, T., Hayashino, T., et al. 2011, MNRAS, 410, L13, doi: 10.1111/j.1745-3933.2010.00969.x
arXiv 2011
-
[38]
Metchnik, M. V. L. 2009, PhD thesis, University of Arizona
2009
-
[39]
Mo, H. J., & White, S. D. M. 1996, MNRAS, 282, 347, doi: 10.1093/mnras/282.2.347
-
[40]
Mo, H. J., & White, S. D. M. 2002, MNRAS, 336, 112, doi: 10.1046/j.1365-8711.2002.05723.x
arXiv 2002
-
[41]
2025, arXiv e-prints, arXiv:2512.17368
Moon, B., Yang, Y., Lee, K.-S., et al. 2025, arXiv e-prints, arXiv:2512.17368. https://arxiv.org/abs/2512.17368
Pith/arXiv arXiv 2025
-
[42]
Myers, A. D., Brunner, R. J., Nichol, R. C., et al. 2007, ApJ, 658, 85, doi: 10.1086/511519
-
[43]
M., Gazta˜ naga, E., & Croton, D
Norberg, P., Baugh, C. M., Gazta˜ naga, E., & Croton, D. J. 2009, MNRAS, 396, 19, doi: 10.1111/j.1365-2966.2009.14389.x
arXiv 2009
-
[44]
2008, ApJS, 176, 301, doi: 10.1086/527673
Ouchi, M., Shimasaku, K., Akiyama, M., et al. 2008, ApJS, 176, 301, doi: 10.1086/527673
doi:10.1086/527673 2008
-
[45]
2010, ApJ, 723, 869, doi: 10.1088/0004-637X/723/1/869
Ouchi, M., Shimasaku, K., Furusawa, H., et al. 2010, ApJ, 723, 869, doi: 10.1088/0004-637X/723/1/869
-
[46]
2018, PASJ, 70, S13, doi: 10.1093/pasj/psx074
Ouchi, M., Harikane, Y., Shibuya, T., et al. 2018, PASJ, 70, S13, doi: 10.1093/pasj/psx074
-
[47]
Peebles, P. J. E. 1980, The large-scale structure of the universe
1980
-
[48]
2015, A&A, 579, A132, doi: 10.1051/0004-6361/201424715
Popesso, P., Biviano, A., Finoguenov, A., et al. 2015, A&A, 579, A132, doi: 10.1051/0004-6361/201424715
-
[49]
Prescott, M. K. M., Dey, A., Brodwin, M., et al. 2012, ApJ, 752, 86, doi: 10.1088/0004-637X/752/2/86
-
[50]
Press, W. H., & Schechter, P. 1974, ApJ, 187, 425, doi: 10.1086/152650
doi:10.1086/152650 1974
-
[51]
Ramakrishnan, V., Moon, B., Im, S. H., et al. 2023, ApJ, 951, 119, doi: 10.3847/1538-4357/acd341
-
[52]
Ramakrishnan, V., Lee, K.-S., Artale, M. C., et al. 2024, ApJ, 977, 119, doi: 10.3847/1538-4357/ad83cb
-
[53]
2025a, ApJ, 982, 74, doi: 10.3847/1538-4357/adb624
Ramakrishnan, V., Lee, K.-S., Firestone, N., et al. 2025a, ApJ, 982, 74, doi: 10.3847/1538-4357/adb624
-
[54]
ODIN: Characterizing the Three-dimensional Structure of Two Protocluster Complexes at $z = 3.1$
Ramakrishnan, V., Ortiz, A., Moon, B., et al. 2025b, arXiv e-prints, arXiv:2511.11826, doi: 10.48550/arXiv.2511.11826
work page internal anchor Pith review Pith/arXiv arXiv doi:10.48550/arxiv.2511.11826
-
[56]
Shen, Y., Strauss, M. A., Oguri, M., et al. 2007, AJ, 133, 2222, doi: 10.1086/513517
doi:10.1086/513517 2007
-
[58]
Sheth, R. K., & Tormen, G. 1999, MNRAS, 308, 119, doi: 10.1046/j.1365-8711.1999.02692.x
arXiv 1999
-
[59]
2018, PASJ, 70, S14, doi: 10.1093/pasj/psx122
Shibuya, T., Ouchi, M., Konno, A., et al. 2018, PASJ, 70, S14, doi: 10.1093/pasj/psx122
-
[60]
S., Lemson, G., Sigad, Y., et al
Somerville, R. S., Lemson, G., Sigad, Y., et al. 2001, MNRAS, 320, 289, doi: 10.1046/j.1365-8711.2001.03894.x
arXiv 2001
-
[61]
Steidel, C. C., Adelberger, K. L., Shapley, A. E., et al. 2000, ApJ, 532, 170, doi: 10.1086/308568 Clustering Analysis For Lyman Alpha Blobs13
doi:10.1086/308568 2000
-
[62]
1999, ApJ, 522, 46, doi: 10.1086/307612
Taruya, A., & Soda, J. 1999, ApJ, 522, 46, doi: 10.1086/307612
-
[63]
2018, PASJ, 70, S12, doi: 10.1093/pasj/psx102
Toshikawa, J., Uchiyama, H., Kashikawa, N., et al. 2018, PASJ, 70, S12, doi: 10.1093/pasj/psx102
-
[64]
K., Yamada, T., Kajisawa, M., et al
Uchimoto, Y. K., Yamada, T., Kajisawa, M., et al. 2012, ApJ, 750, 116, doi: 10.1088/0004-637X/750/2/116
-
[65]
2025, ApJS, 277, 37, doi: 10.3847/1538-4365/adb1c0
Umeda, H., Ouchi, M., Kikuta, S., et al. 2025, ApJS, 277, 37, doi: 10.3847/1538-4365/adb1c0
-
[66]
2019, Science, 366, 97, doi: 10.1126/science.aaw5949
Umehata, H., Fumagalli, M., Smail, I., et al. 2019, Science, 366, 97, doi: 10.1126/science.aaw5949
-
[67]
Umehata, H., Smail, I., Steidel, C. C., et al. 2021, ApJ, 918, 69, doi: 10.3847/1538-4357/ac1106
-
[68]
Wang, Y., Yang, X., Mo, H. J., & van den Bosch, F. C. 2007, ApJ, 664, 608, doi: 10.1086/519245
-
[69]
2024, JCAP, 2024, 020, doi: 10.1088/1475-7516/2024/08/020
White, M., Raichoor, A., Dey, A., et al. 2024, JCAP, 2024, 020, doi: 10.1088/1475-7516/2024/08/020
-
[70]
White, S. D. M., & Rees, M. J. 1978, MNRAS, 183, 341, doi: 10.1093/mnras/183.3.341
-
[71]
2017, MNRAS, 464, 1380, doi: 10.1093/mnras/stw2405
Wilkinson, A., Almaini, O., Chen, C.-C., et al. 2017, MNRAS, 464, 1380, doi: 10.1093/mnras/stw2405
-
[72]
2012, ApJ, 751, 29, doi: 10.1088/0004-637X/751/1/29
Yamada, T., Matsuda, Y., Kousai, K., et al. 2012, ApJ, 751, 29, doi: 10.1088/0004-637X/751/1/29
-
[73]
2014a, ApJ, 784, 171, doi: 10.1088/0004-637X/784/2/171
Yang, Y., Walter, F., Decarli, R., et al. 2014a, ApJ, 784, 171, doi: 10.1088/0004-637X/784/2/171
-
[74]
2010, ApJ, 719, 1654, doi: 10.1088/0004-637X/719/2/1654
Yang, Y., Zabludoff, A., Eisenstein, D., & Dav´ e, R. 2010, ApJ, 719, 1654, doi: 10.1088/0004-637X/719/2/1654
-
[75]
2014b, ApJ, 793, 114, doi: 10.1088/0004-637X/793/2/114
Yang, Y., Zabludoff, A., Jahnke, K., & Dav´ e, R. 2014b, ApJ, 793, 114, doi: 10.1088/0004-637X/793/2/114
-
[76]
2011, ApJ, 735, 87, doi: 10.1088/0004-637X/735/2/87
Yang, Y., Zabludoff, A., Jahnke, K., et al. 2011, ApJ, 735, 87, doi: 10.1088/0004-637X/735/2/87
-
[77]
2009, ApJ, 693, 1579, doi: 10.1088/0004-637X/693/2/1579
Yang, Y., Zabludoff, A., Tremonti, C., Eisenstein, D., & Dav´ e, R. 2009, ApJ, 693, 1579, doi: 10.1088/0004-637X/693/2/1579
-
[78]
Zehavi, I., Zheng, Z., Weinberg, D. H., et al. 2011, ApJ, 736, 59, doi: 10.1088/0004-637X/736/1/59
-
[79]
2025, ApJ, 981, 70, doi: 10.3847/1538-4357/adb41b
Zhang, H., Cai, Z., Li, M., et al. 2025, ApJ, 981, 70, doi: 10.3847/1538-4357/adb41b
discussion (0)
Sign in with ORCID, Apple, or X to comment. Anyone can read and Pith papers without signing in.