REVIEW 4 major objections 6 minor 56 references
Towards Evaluating Robustness of Prompt Adherence in Text to Image Models
T0 review · 4 major / 6 minor · reviewed 2026-08-06 · deepseek-v4-flash
Pith's one-line read Current text-to-image models can reproduce a requested shape at high resolution but cannot reliably place it in the requested quadrant of a simple binary image; even at guidance scale 9.0, best quadrant F1 is 0.41 for Stable Diffusion and…
desk verdict A useful new benchmark dataset and a plausible but unvalidated headline: models fail at spatial prompt adherence, but the F1 ceilings depend on gpt-4o judging its own prompts, and no human validation or artifacts are provided. read the letter →
The pith
A machine-rendered reading of the paper's core claim, the machinery that carries it, and where it could break.
The reading
What carries the argument
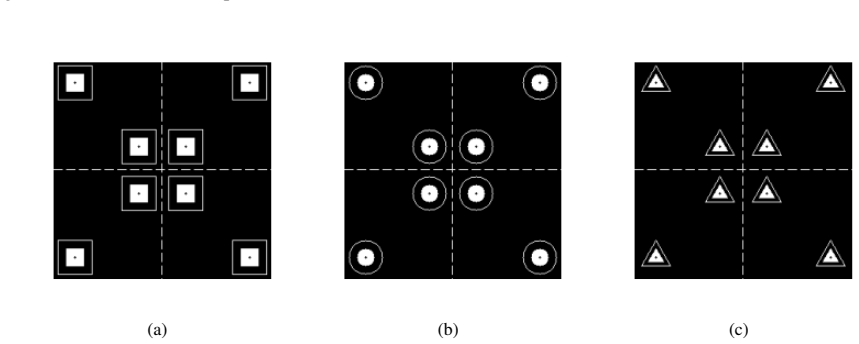
The central machinery is a closed-loop generate-and-describe evaluation: gpt-4o turns a ground-truth image into a text prompt; a text-to-image model renders an image from that prompt; the same gpt-4o system prompt re-describes the rendered image; and the two descriptions are compared for shape and quadrant, with the loop run twice. Supporting this is a purpose-built dataset of 1.4 million 256×256 binary images—white squares, circles, and triangles on black—with controlled position, scale, shape, and a single orientation. A set of pre-trained VAE models, including β-TCVAE, a variational autoencoder whose training separates total-correlation loss to encourage disentangled latents, provides reconstruction loss as a second, distribution-level measure of whether generated images still fit the input distribution. The F1 scores quantify how much shape and quadrant information survives each text-to-image pass.
What would settle it
Show a human rater or an independent object detector the generated images and ask for quadrant labels; if human-assigned quadrants agree with the ground-truth prompt far more often than gpt-4o's labels do, the degradation is an artifact of the judge, whereas if human labels confirm gpt-4o's low quadrant F1, the failure is real.
Extended reading notes
Core claim
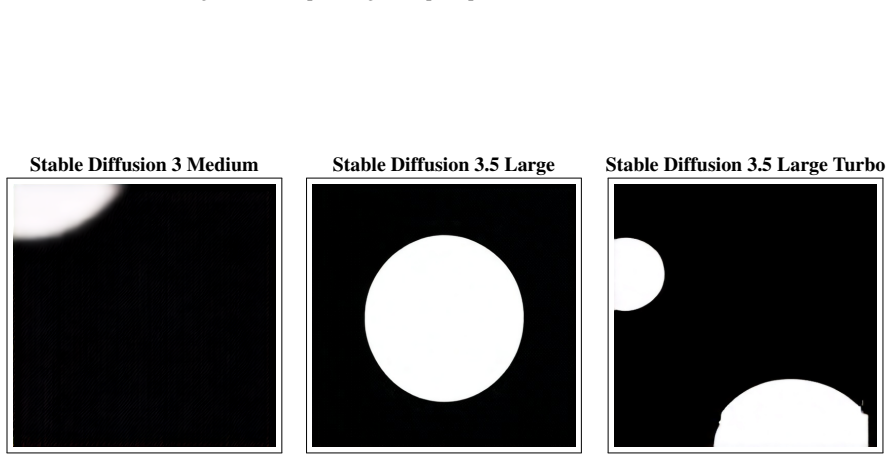
The paper's central claim is that the tested text-to-image models—three Stable Diffusion variants and two Janus Pro variants—do not achieve rigid prompt adherence even for maximally simple binary images containing a single geometric shape. Shape identity is reproduced reasonably at 1024×1024 (F1 around 0.96 in the first iteration), but quadrant placement, the second factor of variation, collapses: the best F1 is 0.41 for diffusion models and 0.5 for Janus Pro models. Performance degrades further at lower resolutions and across a second generate-describe iteration, and pre-trained VAEs reconstruct the generated images progressively worse. The paper concludes that these models are unable to generate images with rigid prompt adherence for simple binary images with one geometric shape, despite the straightforwardness of the text prompts.
Load-bearing premise
The whole pipeline assumes gpt-4o's shape and quadrant readouts are a faithful, neutral judge of image content, and the same model both writes the prompts and scores the results; if gpt-4o systematically misdescribes what it sees, the reported F1 drops measure the judge's bias rather than the generators' failure.
Editorial extensions
If this is right
- Spatial placement is the bottleneck: shape is preserved at high resolution but quadrant position is not, so prompt-adherence failures are concentrated in location rather than object identity.
- Raising the guidance scale to 9.0 does not buy positional adherence, so the failure is not a matter of insufficient prompt conditioning strength.
- Resolution strongly modulates adherence; dropping from 1024 to 512 or 256 sharply reduces even shape F1, so evaluation claims about prompt adherence should always state resolution.
- Errors compound in iterate-and-regenerate loops: the second generation round loses another 3–28% F1 depending on resolution and attribute, so any downstream use that regenerates from model descriptions accumulates drift.
- Reconstruction loss alone can mislead: blank images from one model looked like good reconstructions under MSE, so distribution-fit metrics must be paired with content-level checks.
Reading between the lines
- The minimal, unambiguous prompt design suggests the difficulty is not prompt ambiguity but a missing spatial grounding mechanism in how these models bind text tokens to image coordinates; a testable extension would be to check whether attention maps in the diffusion transformer concentrate on location words.
- Because gpt-4o both writes the prompts and scores the results, the method inherits its blind spots; an independent human or detection-based audit on a small subsample would calibrate how much of the reported degradation is real.
- Quadrants are a coarse 2×2 grid; extending the same loop to 3×3 grids or 'left of / right of' relational prompts would map the boundary where spatial adherence begins to break.
- The authors' own suggestion that scalable fixes would need architectural changes in pre-training rather than fine-tuning implies that simple fine-tuning on spatial prompts is unlikely to transfer to unseen shapes; a direct test would be to fine-tune on quadrant-labeled prompts and check whether performance generalizes.
Editorial analysis
A structured set of objections, weighed in public.
Referee Report
Summary. The paper introduces a new 256x256 binary-image dataset inspired by dSprites, containing squares, circles, and triangles with controlled scale and position, and proposes an automated evaluation pipeline for prompt adherence in text-to-image models. In the pipeline, gpt-4o generates text descriptions of ground-truth images, five text-to-image models (Stable Diffusion 3 Medium, 3.5 Large, 3.5 Large Turbo, Janus Pro 1B, and Janus Pro 7B) generate images from those descriptions, and gpt-4o is then used again to describe and classify the generated images by shape and quadrant. The paper reports F1-score degradation for shape and quadrant prediction over two image-generation iterations, as well as VAE reconstruction losses, and concludes that the tested models cannot reliably place a single geometric shape in a specified quadrant, with best F1 scores of 0.41 for Stable Diffusion models and 0.5 for Janus Pro models.
Significance. If the reported negative result is validated, the paper is significant: it challenges the prompt-adherence claims of current text-to-image models with a deliberately simple, controlled test where failure is easy to interpret. The new dataset and the automated evaluation pipeline are potentially reusable assets, and the paper is unusually candid about its own limitations, notably the SD3 Medium blank-image problem and the VAE reconstruction-loss caveat. The main significance-level concern is that all headline F1 numbers rest on gpt-4o as the sole judge of generated images, with no human validation, no independent evaluator, and no repeated-seed statistics; until those are supplied, the quantitative claims are conditional on gpt-4o's out-of-distribution reliability.
major comments (4)
- [Section 4 (pipeline) and Section 5 (F1 results)] The central claim that no Stable Diffusion model exceeds F1=0.41, and no Janus Pro model exceeds F1=0.5, for quadrant placement is computed entirely from gpt-4o's predictions on generated images, but gpt-4o is also the model that wrote the prompts, and its predictions on generated images are never validated against human labels or an independent evaluator. The paper itself reports a ground-truth quadrant F1 of 0.95, so the judge already shows measurable error on easy source images; on generated images, which contain artifacts and unfamiliar textures, the judge's error could be larger and would directly lower the reported F1 independently of generator behavior. Please add a human-annotated (or independently scored) random subset of generated images, report agreement and a confusion matrix for gpt-4o on both source and generated images, and show that the quadrant F1 ceilings are not an artifact of evaluator bias.
- [Section 5 (all F1 and reconstruction-loss figures)] Every F1 value and reconstruction-loss value is reported as a single point estimate, with no repeated seeds, confidence intervals, or significance tests. Text-to-image sampling is stochastic, and the manuscript does not state which random seeds or sampler hyperparameters were used for the Stable Diffusion or Janus Pro generations, so the specific ceilings of 0.41 and 0.5, and the iteration-over-iteration degradation percentages, may not be reproducible. Please report means with standard deviations or bootstrap confidence intervals over at least three seeds per model-resolution-iteration condition, and state the seeds and sampling configuration.
- [Section 5, first paragraph] The text says 'the ground truth value of 1.0 for shapes and 0.95 for quadrant' and then states that gpt-4o predicted these attributes 'with 100% accuracy'; these statements are mutually inconsistent, because a quadrant F1 of 0.95 implies that some ground-truth images were misclassified. This matters because all subsequent F1-degradation numbers are interpreted relative to the starting F1, and the true baseline for quadrant prediction is not 1.0. Please correct the description and report the full confusion matrix for gpt-4o on the ground-truth test set.
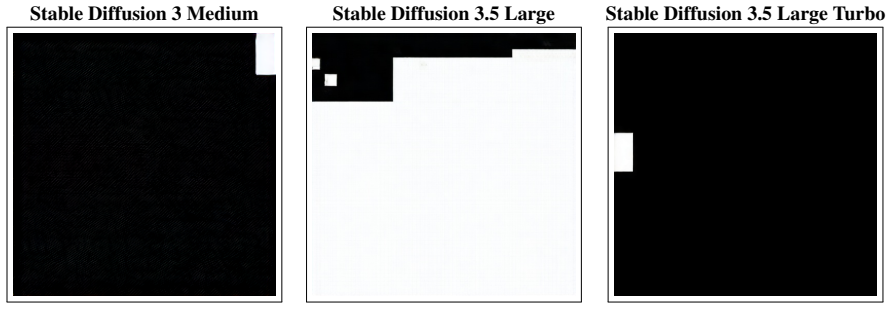
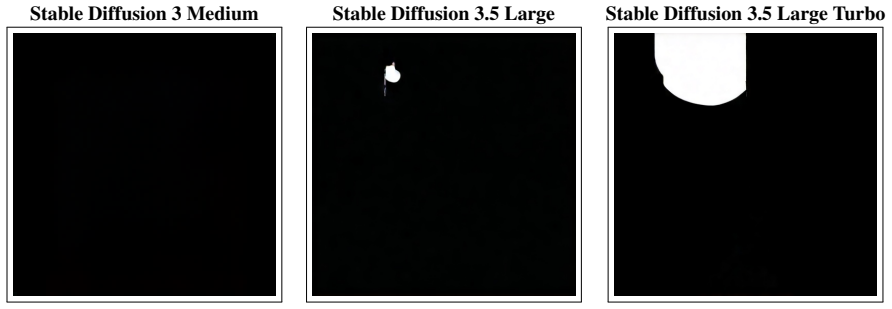
- [Abstract and Section 6 (conclusion) vs. Section 5.2 caveat] The abstract and conclusion state that the VAE experiments show the models 'fail to generate images that follow our input dataset distribution,' but Section 5.2 explicitly cautions that reconstruction loss is misleading because SD3 Medium frequently generates blank images and recommends against interpreting those results as evidence of image quality. Blank images can have artificially low pixel error relative to ground-truth images with small white shapes, so the reconstruction-loss evidence conflates blank outputs with distribution adherence. Please either restrict the VAE-based claim to models without the blank-image bias or replace it with a content-based distribution metric, such as shape-presence detection or a foreground pixel statistic, that is not dominated by blank images.
minor comments (6)
- [Section 3 and Section 6] The conclusion says the models are 'unable to generate images with rigid prompt adherence,' but the position factor of variation is evaluated only at the level of four coarse quadrants, and Section 3 notes that gpt-4o cannot describe exact pixel positions; please qualify the conclusion as 'quadrant-level location adherence' to avoid overclaiming.
- [Section 9.1 (prompt)] The instruction 'limit it to 60 words, whichever is higher' is ambiguous and logically odd; please clarify whether the intended limit is a minimum of 60 words, a maximum of 60 words, or some other rule, since this directly affects the prompts used in the pipeline.
- [Section 10.1.3] The cross-reference to '8.1.3' for the VAE hyperparameters should instead point to Section 10.1.3.
- [Section 5.1] The text mixes 'accuracy' and 'F1-Score' in phrases such as 'around 90% accuracy in F1-Scores'; please choose one consistent terminology throughout the results.
- [Figures 3-6 and Appendix E] The referenced figures are not self-contained in the current text: they lack axis labels, legends, and error bars in the visible form. Please ensure the camera-ready figures identify each model, resolution, iteration, and threshold clearly.
- [Reproducibility statement] The paper does not state whether the new dataset, trained VAE checkpoints, generated images, or evaluation prompts will be released; since the dataset is a proposed contribution, please add an availability statement or explain why they cannot be shared.
Circularity Check
No significant circularity; the gpt-4o-based evaluation loop is a measurement-validity concern, not a derivation that reduces to its own inputs.
full rationale
The paper is an empirical evaluation, not a derivation; its headline F1 scores are computed by a defined pipeline (Section 4) in which gpt-4o writes descriptions of ground-truth images, image models generate from those descriptions, and gpt-4o again labels shape and quadrant. The F1 metric is explicitly 'the degradation of the F1-Score for quadrant predictions made by gpt-4o' (Section 4), and the paper does not hide that the same model is the evaluator. No equation in the paper reduces the reported F1 to an input by construction: the ground-truth labels (shape, quadrant) are fixed by the dataset definition (Section 3), and the prompt described by gpt-4o is a separate text string that could, in principle, be followed or not followed independently of gpt-4o's later judgment. The paper even reports a ground-truth quadrant F1 of 0.95 (Section 5), acknowledging evaluator noise, and admits the SD3 Medium blank-image bias in reconstruction loss (Section 5.2). These are validity limitations, not circularity. There are no load-bearing self-citations: the cited prior works [21, 22] are by different authors and are used only to contrast the paper's goal. The score is 0.
Assumptions & free parameters
free parameters (4)
- guidance_scale =
9.0
- binarization_threshold =
160 to 250 range scanned
- VAE hyperparameters =
beta=4 for beta-VAE; alpha=1, beta=6, gamma=1 for beta-TCVAE; 8 and 10 latent dimensions
- test subset sampling =
3 scales, 32 X positions, 32 Y positions, 9,216 images
assumptions (4)
- domain assumption gpt-4o produces accurate and unbiased image descriptions and shape and quadrant labels for both ground-truth and generated images.
- domain assumption Reconstruction loss of a VAE trained on the synthetic dataset is a valid proxy for prompt adherence and distribution fit.
- domain assumption Downscaling generated images to 256x256 preserves the shape and quadrant information needed for VAE evaluation.
- standard math The Gaussian latent-space assumption and the KL decomposition used for beta-TCVAE are appropriate for the synthetic image distribution.
Cite this review
Pith. "Pith review of Towards Evaluating Robustness of Prompt Adherence in Text to Image Models." pith.science (2026). https://pith.science/paper/KP3XJGMU
@misc{pith2026250708039,
  author       = {Pith},
  title        = {Pith review of: Towards Evaluating Robustness of Prompt Adherence in Text to Image Models},
  year         = {2026},
  howpublished = {\url{https://pith.science/paper/KP3XJGMU}},
  note         = {Machine review of arXiv:2507.08039}
}
read the original abstract
The advancements in the domain of LLMs in recent years have surprised many, showcasing their remarkable capabilities and diverse applications. Their potential applications in various real-world scenarios have led to significant research on their reliability and effectiveness. On the other hand, multimodal LLMs and Text-to-Image models have only recently gained prominence, especially when compared to text-only LLMs. Their reliability remains constrained due to insufficient research on assessing their performance and robustness. This paper aims to establish a comprehensive evaluation framework for Text-to-Image models, concentrating particularly on their adherence to prompts. We created a novel dataset that aimed to assess the robustness of these models in generating images that conform to the specified factors of variation in the input text prompts. Our evaluation studies present findings on three variants of Stable Diffusion models: Stable Diffusion 3 Medium, Stable Diffusion 3.5 Large, and Stable Diffusion 3.5 Large Turbo, and two variants of Janus models: Janus Pro 1B and Janus Pro 7B. We introduce a pipeline that leverages text descriptions generated by the gpt-4o model for our ground-truth images, which are then used to generate artificial images by passing these descriptions to the Text-to-Image models. We then pass these generated images again through gpt-4o using the same system prompt and compare the variation between the two descriptions. Our results reveal that these models struggle to create simple binary images with only two factors of variation: a simple geometric shape and its location. We also show, using pre-trained VAEs on our dataset, that they fail to generate images that follow our input dataset distribution.
Figures


Figures from the paper (14 more)




Reference graph
Works this paper leans on
-
[1]
Spice: Semantic propositional image caption evaluation
Peter Anderson et al. “Spice: Semantic propositional image caption evaluation”. In: Computer Vision–ECCV 2016: 14th European Conference, Amsterdam, The Netherlands, October 11-14, 2016, Proceedings, Part V 14. Springer. 2016, pp. 382–398
work page 2016
-
[2]
dSprites: Disentanglement testing Sprites dataset
Loic Matthey et al. dSprites: Disentanglement testing Sprites dataset . https://github.com/deepmind/dsprites- dataset/. 2017
work page 2017
-
[3]
Isolating sources of disentanglement in variational autoencoders
Ricky TQ Chen et al. “Isolating sources of disentanglement in variational autoencoders”. In: Advances in neural information processing systems 31 (2018)
work page 2018
-
[4]
Tiger: Text-to-image grounding for image caption evaluation
Ming Jiang et al. “Tiger: Text-to-image grounding for image caption evaluation”. In: arXiv preprint arXiv:1909.02050 (2019)
arXiv 2019
-
[5]
Semantic object accuracy for generative text-to-image synthesis
Tobias Hinz, Stefan Heinrich, and Stefan Wermter. “Semantic object accuracy for generative text-to-image synthesis”. In: IEEE transactions on pattern analysis and machine intelligence 44.3 (2020), pp. 1552–1565
work page 2020
-
[6]
Denoising diffusion probabilistic models
Jonathan Ho, Ajay Jain, and Pieter Abbeel. “Denoising diffusion probabilistic models”. In: Advances in neural information processing systems 33 (2020), pp. 6840–6851
work page 2020
-
[7]
ViLBERTScore: Evaluating Image Caption Using Vision-and-Language BERT
Hwanhee Lee et al. “ViLBERTScore: Evaluating Image Caption Using Vision-and-Language BERT”. In: Proceedings of the First Workshop on Evaluation and Comparison of NLP Systems . Online: Association for Computational Linguistics, Nov. 2020, pp. 34–39. DOI: 10.18653/v1/2020.eval4nlp-1.4
-
[8]
Clipscore: A reference-free evaluation metric for image captioning
Jack Hessel et al. “Clipscore: A reference-free evaluation metric for image captioning”. In: arXiv preprint arXiv:2104.08718 (2021)
arXiv 2021
Show all 56 references
-
[9]
Learning transferable visual models from natural language supervision
Alec Radford et al. “Learning transferable visual models from natural language supervision”. In: International conference on machine learning. PMLR. 2021, pp. 8748–8763
2021
-
[10]
Pali: A jointly-scaled multilingual language-image model
Xi Chen et al. “Pali: A jointly-scaled multilingual language-image model”. In: arXiv preprint arXiv:2209.06794 (2022)
2022 arXiv
-
[11]
Scaling Instruction-Finetuned Language Models
Hyung Won Chung et al. Scaling Instruction-Finetuned Language Models. 2022. arXiv: 2210.11416 [cs.LG]
2022 arXiv
-
[12]
Tise: Bag of metrics for text-to-image synthesis evaluation
Tan M Dinh, Rang Nguyen, and Binh-Son Hua. “Tise: Bag of metrics for text-to-image synthesis evaluation”. In: European Conference on Computer Vision. Springer. 2022, pp. 594–609
2022
-
[13]
Benchmarking spatial relationships in text-to-image generation
Tejas Gokhale et al. “Benchmarking spatial relationships in text-to-image generation”. In: arXiv preprint arXiv:2212.10015 (2022)
2022 arXiv
-
[14]
Blip: Bootstrapping language-image pre-training for unified vision-language understanding and generation
Junnan Li et al. “Blip: Bootstrapping language-image pre-training for unified vision-language understanding and generation”. In: International conference on machine learning. PMLR. 2022, pp. 12888–12900
2022
-
[15]
Perceptual artifacts localization for inpainting
Lingzhi Zhang et al. “Perceptual artifacts localization for inpainting”. In: European Conference on Computer Vision. Springer. 2022, pp. 146–164
2022
-
[16]
X-IQE: eXplainable Image Quality Evaluation for Text-to-Image Generation with Visual Large Language Models
Yixiong Chen. “X-IQE: eXplainable Image Quality Evaluation for Text-to-Image Generation with Visual Large Language Models”. In: arXiv preprint arXiv:2305.10843 (2023)
2023 arXiv
-
[17]
TIFA: Accurate and Interpretable Text-to-Image Faithfulness Evaluation with Question Answer- ing
Yushi Hu et al. “TIFA: Accurate and Interpretable Text-to-Image Faithfulness Evaluation with Question Answer- ing”. In: arXiv preprint arXiv:2303.11897 (2023)
2023 arXiv
-
[18]
T2I-CompBench: A Comprehensive Benchmark for Open-world Compositional Text-to- image Generation
Kaiyi Huang et al. “T2I-CompBench: A Comprehensive Benchmark for Open-world Compositional Text-to- image Generation”. In: arXiv preprint arXiv: 2307.06350 (2023)
2023 arXiv
-
[19]
Divide, Evaluate, and Refine: Evaluating and Improving Text-to-Image Alignment with Iterative VQA Feedback
Jaskirat Singh and Liang Zheng. “Divide, Evaluate, and Refine: Evaluating and Improving Text-to-Image Alignment with Iterative VQA Feedback”. In: arXiv preprint arXiv:2307.04749 (2023)
2023 arXiv
-
[20]
Stable Diffusion 3.5 Release
Stability AI. Stable Diffusion 3.5 Release . 2024. URL: https : / / stability . ai / news / introducing - stable-diffusion-3-5
2024
-
[21]
Explaining Latent Representations Of Generative Models With Large Multimodal Models
Mengdan Zhu et al. “Explaining Latent Representations Of Generative Models With Large Multimodal Models”. In: ICLR Workshop (2024)
2024
-
[22]
LatentExplainer: Explaining Latent Representations in Deep Generative Models with Multi-modal Foundation Models
Mengdan Zhu et al. “LatentExplainer: Explaining Latent Representations in Deep Generative Models with Multi-modal Foundation Models”. In: arXiv preprint arXiv:2406.14862 (2024)
2024
-
[23]
Scaling rectified flow transformers for high-resolution image synthesis
Patrick Esser et al. “Scaling rectified flow transformers for high-resolution image synthesis”. In: Forty-first International Conference on Machine Learning. 2024
2024
-
[24]
TIAM-A metric for evaluating alignment in Text-to-Image generation
Paul Grimal et al. “TIAM-A metric for evaluating alignment in Text-to-Image generation”. In:Proceedings of the IEEE/CVF Winter Conference on Applications of Computer Vision. 2024, pp. 2890–2899. 11
2024
-
[25]
Evaluating Text to Image Synthesis: Survey and Taxonomy of Image Quality Metrics
Sebastian Hartwig et al. “Evaluating Text to Image Synthesis: Survey and Taxonomy of Image Quality Metrics”. In: arXiv preprint arXiv:2403.11821 (2024)
2024 arXiv
-
[26]
MMGenBench: Evaluating the Limits of LMMs from the Text-to-Image Generation Perspective
Hailang Huang et al. “MMGenBench: Evaluating the Limits of LMMs from the Text-to-Image Generation Perspective”. In: arXiv preprint arXiv:2411.14062 (2024)
2024 arXiv
-
[27]
Evaluating Text-to-Visual Generation with Image-to-Text Generation
Zhiqiu Lin et al. Evaluating Text-to-Visual Generation with Image-to-Text Generation. 2024. arXiv: 2404.01291 [cs.CV]
2024 arXiv
-
[28]
Playground v3: Improving text-to-image alignment with deep-fusion large language models
Bingchen Liu et al. “Playground v3: Improving text-to-image alignment with deep-fusion large language models”. In: arXiv preprint arXiv:2409.10695 (2024)
2024 arXiv
-
[29]
Janusflow: Harmonizing autoregression and rectified flow for unified multimodal understanding and generation
Yiyang Ma et al. “Janusflow: Harmonizing autoregression and rectified flow for unified multimodal understanding and generation”. In: arXiv preprint arXiv:2411.07975 (2024)
2024 arXiv
-
[30]
What you see is what you read? improving text-image alignment evaluation
Michal Yarom et al. “What you see is what you read? improving text-image alignment evaluation”. In: Advances in Neural Information Processing Systems 36 (2024)
2024
-
[31]
Janus-pro: Unified multimodal understanding and generation with data and model scaling
Xiaokang Chen et al. “Janus-pro: Unified multimodal understanding and generation with data and model scaling”. In: arXiv preprint arXiv:2501.17811 (2025)
2025 arXiv
-
[32]
square" at 64x64 resolution 12 Stable Diffusion 3 Medium Stable Diffusion 3.5 Large Stable Diffusion 3.5 Large Turbo Figure 8: Sample images for prompt
FLUX.1-dev. URL: https://huggingface.co/black-forest-labs/FLUX.1-dev . 8 Appendix A: Sample generated images In this section we show images generated at 4 different resolutions viz. 64x64, 256x256, 512x512, 1024x1024 for three sample prompts by all three stable diffusion model...
-
[33]
Give a detailed description of the image which can be used as a text prompt to generate this image using any text to image model. Include features like background and foreground, main object of the image and their positioning and orientation, solid fill or outline etc among ot...
-
[34]
Provide the following encoding of shapes if a geometric shape is present as main object of the image with the following encoding: - S for Square or Rectangle (only if the image contains a complete square or rectangle shape as the main object, output O if the shape is partial) ...
-
[35]
9.2 Hardware The section describes the hardware requirements to conduct our experiments successfully
Provide the position of the center point of the main foreground object identified in the image with the following encoding: - TL for Top Left quadrant (If your answer to question 2 is either S or C or T and the center of that shape falls in top left quadrant) - TR for Top Righ...
-
[36]
NVIDIA A6000 workstation (a) Intel Xeon w9-3475X 72 core processor (b) Nvidia 6000 Ada with 50GB VRAM (c) 256GB RAM (d) Operating System - Linux
-
[37]
3 NVIDIA H100 instances
-
[38]
Pytorch version - 2.2.0
-
[39]
Python version - 3.11.5
-
[40]
A combination of these 6 factors can completely define each image
CUDA version 12.1 9.3 Factors of Variation The dataset was configured to have 6 factors of variation. A combination of these 6 factors can completely define each image. Out of these 6 factors, only 4 vary in value: shape, scale, x co-ordinate and y co-ordinate of the center of...
-
[41]
Shape: [0,1,2] corresponding to Square, Circle and Triangle
-
[42]
Each value represents the exact pixel value in the 256 x 256 image
X co-ordinate: 32 values starting from 25 to 205 with a jump of 5. Each value represents the exact pixel value in the 256 x 256 image
-
[43]
Y co-ordinate: Same as the X co-ordinate
-
[44]
White shape on a black background
Color: Only 1 color scheme. White shape on a black background
-
[45]
Every possible combination of these factors lead to a 9216 image test dataset
Orientation: Only 1 orientation with 0 degree tilt. Every possible combination of these factors lead to a 9216 image test dataset. 9.4 Binarization of Images After transforms our dataset consists of binary grayscale images, i.e, each pixel is 0 or 1. However, the images genera...
-
[46]
Bernoulli: translates to binary cross entropy loss between the reconstructed images and the original dataset images
-
[47]
Gaussian: translates to Mean Squared error loss between the reconstructed images and the original dataset images We note that for the Bernoulli distribution assumption, we could not get feasible results which led to us only working with the Gaussian assumption. 10.1.5 KL Diver...
-
[48]
This can be readily accomplished with statistical tests
Each latent dimension must adhere to a normal distribution. This can be readily accomplished with statistical tests. The Anderson-Darling test is a widely utilized approach that produces a confidence statistic for a dataset to be assessed against a distribution with specified ...
-
[49]
Anderson statistic
A one-to-one correspondence between each factor of variation and latent dimension. Latent traversal, which examines the impact of altering a single latent dimension on the generated images, is a conventional technique employed in various studies pertaining to representation le...
-
[50]
Dimensions belonging to this category do not capture anything meaningful in image generation
Category 1: No noticeable changes. Dimensions belonging to this category do not capture anything meaningful in image generation
-
[51]
We observe only 1 factor of variation with change in values
Category 2: Linear changes - a perfect traversal. We observe only 1 factor of variation with change in values. Dimensions belonging to this category are completely disentangled
-
[52]
Dimensions in this category form sub-groups which encode a particular factor of variation
Category 3 - Entangled changes - we observe multiple factors of variation with change in values. Dimensions in this category form sub-groups which encode a particular factor of variation. To show the affect of β, we shall show traversals for different types of V AEs as well. N...
-
[53]
Vanilla V AE: Figure 29 22
-
[54]
β-V AE: Figure 30 12.2 Impact of Resolution over Iterations Here we see the behavior of the effect of resolution on reconstruction of images with the rest of the trained V AEs
-
[55]
Vanilla V AE: Figure 31
-
[56]
β-V AE: 23 Figure 32 24
Reviewed August 6, 2026 · model on record in the stance chip above.
Discussion (0). Sign in to comment.