Tunneling phase diagram: A machine-learning framework for multidimensional kinetic isotope effects
Pith reviewed 2026-06-29 07:12 UTC · model grok-4.3
The pith
A machine-learning framework decouples the true tunneling factor kappa from composite kinetic isotope effects.
A machine-rendered reading of the paper's core claim, the machinery that carries it, and where it could break.
Core claim
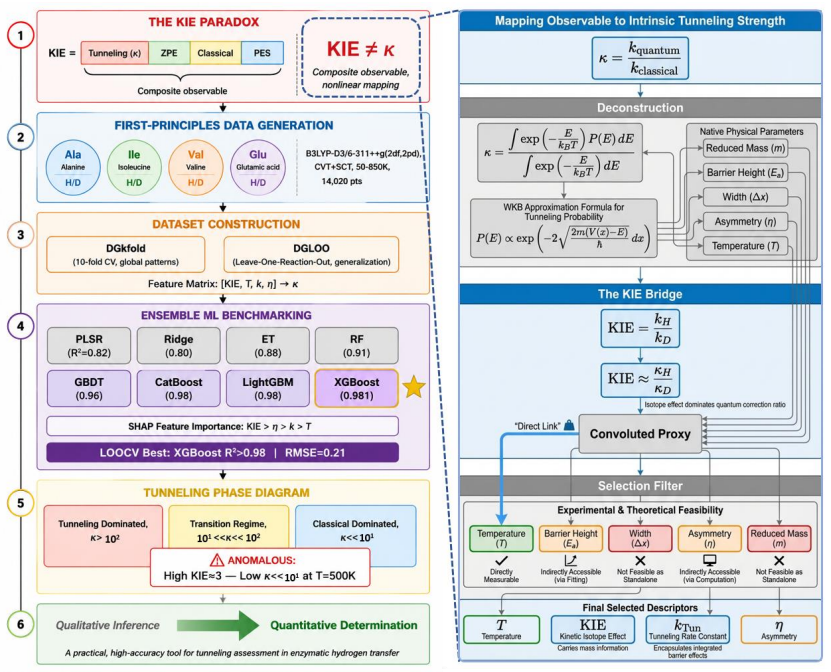
The tunneling phase diagram is a machine-learning framework that decodes the nonlinear relationship between KIE and the tunneling factor kappa. Trained to isolate kappa, the model achieves R^2 greater than 0.98 and RMSE of 0.21 on test data. Application of the diagram uncovers an anomalous high-KIE low-kappa regime spanning 300-600 K, supplying a quantitative tool for assessing tunneling independent of other kinetic contributions.
What carries the argument
The tunneling phase diagram, a machine-learning model that maps observed KIE values onto the isolated tunneling factor kappa by learning their nonlinear dependence.
If this is right
- Tunneling strength can be quantified in multidimensional systems without conflating it with zero-point or classical contributions.
- An anomalous regime of high KIE yet low kappa exists between 300 and 600 K.
- The framework supplies a reproducible numerical paradigm for ranking tunneling importance across different reactions and temperatures.
- KIE data can be re-interpreted to yield standalone kappa estimates at scale.
Where Pith is reading between the lines
- The same mapping approach could be retrained on experimental KIE tables from enzyme reactions to test whether biological tunneling signatures appear in the same anomalous region.
- If the low-kappa high-KIE band proves robust, rate theories that assume monotonic KIE-kappa growth may need temperature-dependent correction terms.
- Extending the diagram to pressure or solvent variables would allow direct comparison of tunneling dominance under different physical conditions.
Load-bearing premise
The machine-learning model can extract the true tunneling factor kappa from composite KIE data without being misled by zero-point energy, classical kinetics, or gaps in its training examples.
What would settle it
Apply the trained model to a set of reactions whose kappa values have already been computed independently from exact quantum-dynamics simulations and check whether the predicted kappa matches the simulation values within the reported RMSE.
Figures
read the original abstract
The kinetic isotope effect (KIE) is the conventional probe for quantum tunneling, yet its composite nature conflates tunneling with zero-point energy and classical kinetics. Here, we introduce the tunneling phase diagram, a machine-learning framework that decouples true tunneling strength by decoding the nonlinear relationship between KIE and the tunneling factor (\k{appa}). With exceptional fidelity (R^2 > 0.98, RMSE = 0.21), this framework reveals an anomalous high KIE-low \k{appa} spanning 300-600 K, thereby defining a paradigm for the quantitative assessment of quantum tunneling.
Editorial analysis
A structured set of objections, weighed in public.
Referee Report
Summary. The manuscript introduces a machine-learning framework called the 'tunneling phase diagram' to decouple the true tunneling factor κ from the composite kinetic isotope effect (KIE) by modeling their nonlinear relationship. It reports high fidelity with R² > 0.98 and RMSE = 0.21, and identifies an anomalous high-KIE low-κ regime spanning 300-600 K as a new paradigm for quantitative assessment of quantum tunneling.
Significance. If the ML model can be shown to isolate κ independently of zero-point energy and classical contributions, the framework would offer a useful tool for interpreting multidimensional KIE data in quantum chemistry and reaction dynamics.
major comments (2)
- [Abstract] Abstract: The reported fidelity metrics (R² > 0.98, RMSE = 0.21) and the anomalous regime are presented without any description of the training data, model architecture, feature representation of KIE, train/test split, cross-validation, or how independent ground-truth κ labels were generated. This information is load-bearing for the central claim that the model decouples true tunneling strength.
- [Methods] Methods (or equivalent section describing the framework): No details are supplied on whether the training distribution covers the claimed 300-600 K anomalous regime or on controls for confounding factors such as zero-point energy contributions, making it impossible to assess whether the high fidelity reflects genuine isolation of κ or reproduction of correlations present in the (unspecified) training set.
Simulated Author's Rebuttal
We thank the referee for their detailed review and for identifying areas where methodological transparency must be improved. We address each major comment below and will make the corresponding revisions to the manuscript.
read point-by-point responses
-
Referee: [Abstract] Abstract: The reported fidelity metrics (R² > 0.98, RMSE = 0.21) and the anomalous regime are presented without any description of the training data, model architecture, feature representation of KIE, train/test split, cross-validation, or how independent ground-truth κ labels were generated. This information is load-bearing for the central claim that the model decouples true tunneling strength.
Authors: We agree that the abstract (and the current Methods description) lacks these essential details. The revised manuscript will incorporate a concise summary of the training data generation, model architecture, KIE feature representation, train/test split, cross-validation protocol, and the procedure used to obtain independent ground-truth κ labels. These additions will directly support the central claim regarding decoupling of tunneling strength. revision: yes
-
Referee: [Methods] Methods (or equivalent section describing the framework): No details are supplied on whether the training distribution covers the claimed 300-600 K anomalous regime or on controls for confounding factors such as zero-point energy contributions, making it impossible to assess whether the high fidelity reflects genuine isolation of κ or reproduction of correlations present in the (unspecified) training set.
Authors: We acknowledge that the submitted version provides no information on training-distribution coverage of the 300-600 K range or on explicit controls for zero-point energy and other confounders. The revised manuscript will add these specifications, including the temperature range represented in the training set and any ablation or baseline comparisons used to isolate κ from classical and zero-point contributions. revision: yes
Circularity Check
No significant circularity; derivation self-contained
full rationale
The abstract describes an ML framework trained to decode the relationship between composite KIE and tunneling factor κ, reporting performance metrics R² > 0.98 and RMSE = 0.21, then applying the model to identify an anomalous regime. No equations, self-citations, or steps are quoted that reduce the reported fidelity or the anomalous regime to a fitted parameter by construction, a self-definition, or a load-bearing self-citation chain. The performance metrics are standard supervised-learning validation quantities; the anomalous regime is presented as an output of the trained model rather than an input. Absent explicit reduction of the central claim to its own training labels or prior author work, the derivation does not meet the criteria for circularity and remains self-contained against external benchmarks of ML regression accuracy.
Axiom & Free-Parameter Ledger
Reference graph
Works this paper leans on
-
[1]
This equation indicates that the classical rate is governed solely by temperature and the barrier height, exhibiting exponential growth with increasing temperature
Theoretical Framework and Feature Selection Within the framework of transition state theory (TST), the quantum reaction rate constant kTun(T) is defined as the product of κ and the classical reaction rate constant kCla(T): kTun(T)=κ(T)⋅kCla(T) The classical rate constant kCla(T), dominated by the Arrhenius equation, is given by: kCla(T)= kBT h ⅇ-βE where ...
-
[2]
These calculations were performed at the B3LYP -D3/6-311++g(2df,2pd) theoretical level [42] with tunneling corrections to construct the PESs
Dataset Construction and Augmentation The dataset was constructed using DFT computational results for the rate-limiting step of chiral inversion in four amino acid molecules (alanine, isoleucine, valine, and glutamic acid). These calculations were performed at the B3LYP -D3/6-311++g(2df,2pd) theoretical level [42] with tunneling corrections to construct t...
-
[3]
Datasets obtained through different partitioning methods to achieve distinct training objectives
Machine Learning Models and Evaluation Framework Table 2. Datasets obtained through different partitioning methods to achieve distinct training objectives. Dataset Dataset Composition Sample size DGLOO Training 19 reaction pathways 38000 Validation Test One of the reaction pathways 2000 DGkfold Training 90% Data 36000 Validation Test 10% Data 4000 A tiere...
2000
-
[4]
3, which compares the Mean Absolute Error (MAE), Mean Squared Error (MSE), and Root Mean Squared Error (RMSE) for different algorithms on both the training and test sets
Comparative Model Performance and Benchmark Evaluation The performance of the trained models on the DGkfold dataset is summarized in Fig. 3, which compares the Mean Absolute Error (MAE), Mean Squared Error (MSE), and Root Mean Squared Error (RMSE) for different algorithms on both the training and test sets. In terms of MAE, however, traditional linear mod...
-
[5]
The performance was assessed using root mean squared error (RMSE) and deviation distribution analysis across the eight algorithms (Fig
Validation of Model Generalization Capability To systematically evaluate the generalization capability of the machine learning models to unseen reaction systems, a rigorous validation was performed using the leave -one-out cross-validation (LOOCV) dataset, DGLOO. The performance was assessed using root mean squared error (RMSE) and deviation distribution ...
-
[6]
Feature Importance Analysis and Physical Interpretation A comparative analysis of feature contributions across multiple models reveals algorithm-specific differences in interpretability regarding the key drivers for reaction rate constant prediction, as illustrated in Fig. S2. Within tree -based ensemble models, temperature (T) and the KIE exhibit signifi...
-
[7]
Tunneling Phase Diagram: Revealing the Nonlinear KIE–κ Relationship Building upon the discussions of algorithmic reliability and generalization, we used the best-performing XGBoost algorithm to construct a quantitative KIE –κ mapping, as shown in Fig. 7. Having established that KIE alone is insufficient to predict κ, we constructed a tunneling phase diagr...
2022
discussion (0)
Sign in with ORCID, Apple, or X to comment. Anyone can read and Pith papers without signing in.