Automated High-Precision Extraction and Forensic Verification of Data-Bearing Vector Figures
Pith reviewed 2026-07-01 05:37 UTC · model grok-4.3
The pith
Vector figures from standard scientific toolchains encode data at a precision exceeding the plotted values, enabling automated one-pass recovery with a re-rendering certificate for forensic verification.
A machine-rendered reading of the paper's core claim, the machinery that carries it, and where it could break.
Core claim
When a figure is produced by a dominant scientific renderer, each marker and vertex is written at a printed precision that exceeds the data's own. An automatic extractor decodes the figure in one pass, and a verification theory establishes that the mapping from data to figure is injective except on a vanishingly small interval near zero. Accidental agreement is astronomically unlikely, and a re-rendering certificate ties the recovered values directly to the graphical elements, making the result non-repudiable without using ground truth during recovery.
What carries the argument
The re-rendering certificate that binds recovered numerical values to the markers, lines, and ticks drawn in the figure.
If this is right
- Automated extraction replaces slow point-by-point manual digitization of figures.
- Recovered values match external archives such as Planck 2018 to 10^-9 and Keeling CO2 to 5*10^-4 without ground truth during the process.
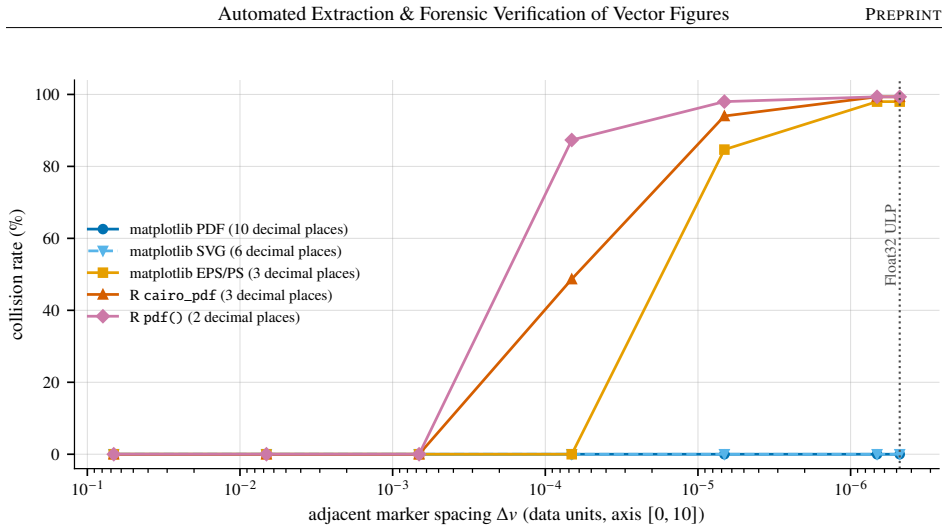
- Recovery reaches bit-exact float32 for matplotlib markers and three to four significant figures end to end across PDF, SVG, and EPS.
- The result is non-repudiable because the certificate binds values to drawn graphical elements rather than text.
Where Pith is reading between the lines
- Published figures could be accompanied by extraction certificates as a standard for data provenance in papers.
- Systematic re-extraction of figures across a corpus might reveal inconsistencies in reported data without needing original source files.
- The method could be extended to audit scaling-law figures or other derived claims by checking recovered values against the plotted elements.
Load-bearing premise
The figure must be produced by a dominant scientific toolchain such as matplotlib whose renderer writes each marker and vertex at a printed precision that exceeds the data's own precision.
What would settle it
Finding two unrelated datasets that, when plotted with the claimed renderer and format, produce a figure from which the extractor returns identical values within the stated precision, or failing to recover Planck 2018 data to 10^-9 accuracy from its published figure.
Figures
read the original abstract
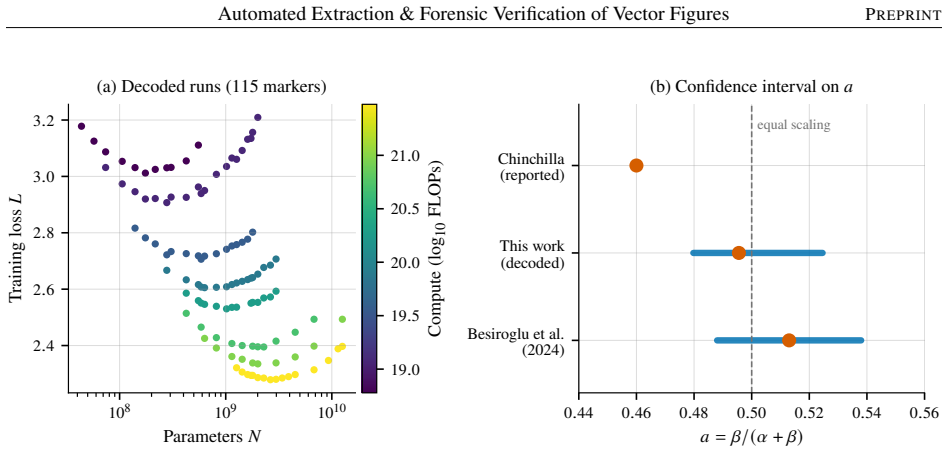
The quantitative record of science and engineering is increasingly carried by figures rather than text or tables, and a reader who needs the underlying numbers must usually re-digitize them by hand: slowly, imprecisely, and with no way to prove the result is faithful. Yet when a figure is stored as vector graphics, its data are not approximated by the picture but encoded in it: the renderer writes each marker and vertex at a printed precision that, for the dominant scientific toolchain, exceeds the data's own. We turn this into three contributions, one per shortcoming of hand digitization. First, a precision theory bounding how accurately data can be recovered for a given renderer and export format: bit-exact float32 for matplotlib markers, and a calibration-limited three to four significant figures end to end. Second, an automatic extractor that decodes a figure in one pass with no human in the loop, in place of the slow point-by-point tracing a digitizer demands. Third, a verification theory: recovery is injective except on a characterized, vanishingly small interval near zero; accidental agreement between unrelated data is astronomically unlikely; and a re-rendering certificate binds the recovered values to the markers, lines, and ticks the figure draws, not its text, making a result non-repudiable. With no ground truth used during recovery, decoded figures match external archives (Planck 2018 to 10^-9; the Keeling CO2 record to 5*10^-4, and one decoded figure independently reproduces a correction to the Chinchilla scaling-law confidence interval. We map the achievable precision across common renderers and their PDF, SVG, and EPS formats. What we deliver is certified data; the scientific significance of any particular dataset lies outside this paper's scope, and recovered values are candidates for human review, never accusations.
Editorial analysis
A structured set of objections, weighed in public.
Referee Report
Summary. The paper claims that vector figures from dominant scientific toolchains (e.g., matplotlib) encode data at printed precision exceeding the source data, enabling an automatic one-pass extractor, a precision theory (bit-exact float32 for matplotlib markers; 3-4 significant figures end-to-end), and a verification theory establishing injectivity (except on a characterized vanishingly small near-zero interval), astronomically low accidental agreement probability, and non-repudiable re-rendering certificates that bind recovered values to drawn markers/lines/ticks rather than text. Empirical checks against external archives (Planck 2018 to 10^-9; Keeling CO2 to 5*10^-4) and reproduction of a Chinchilla scaling-law correction are provided without using ground truth during extraction; the work also maps achievable precision across common renderers and PDF/SVG/EPS formats.
Significance. If the central claims hold, the work supplies a practical route to certified, high-precision recovery of quantitative data from published vector figures together with forensic non-repudiation, directly addressing the reproducibility gap created by hand digitization. The absence of free parameters, the renderer-precision axiom, and the post-recovery archive matches constitute concrete strengths that would make the extractor and certificate useful tools for data archaeology and verification.
minor comments (1)
- [Abstract] The abstract states the injectivity result and the vanishingly small near-zero interval but does not name the section or theorem that supplies the full characterization; a pointer would help readers locate the derivation.
Simulated Author's Rebuttal
We thank the referee for their positive summary, significance assessment, and recommendation to accept the manuscript. The report lists no major comments.
Circularity Check
No significant circularity in the derivation chain
full rationale
The paper's precision theory is grounded in external properties of dominant renderers (matplotlib writing markers/vertices at printed precision exceeding source data precision), the extractor is a one-pass decoding algorithm, and the verification theory uses injectivity (except on a characterized near-zero interval) plus a re-rendering certificate that binds recovered values to graphical elements (markers, lines, ticks) rather than text. No load-bearing step reduces by construction to fitted inputs, self-definitions, or self-citation chains; matches to external archives (Planck, Keeling) are independent post-recovery checks performed without ground truth during extraction. The derivation is therefore self-contained against external benchmarks.
Axiom & Free-Parameter Ledger
axioms (1)
- domain assumption Vector graphics from dominant scientific toolchains encode marker and vertex coordinates at a printed precision exceeding the data's own precision.
Reference graph
Works this paper leans on
-
[1]
WebPlotDigitizer.https://automeris.io/WebPlotDigitizer, 2017
Ankit Rohatgi. WebPlotDigitizer.https://automeris.io/WebPlotDigitizer, 2017
2017
-
[2]
John D. Hunter. Matplotlib: A 2d graphics environment.Computing in Science & Engineering, 9(3):90–95, 2007. doi: 10.1109/MCSE.2007.55
-
[3]
Chartdetective: Easy and accurate interactive data extraction from complex vector charts
Damien Masson, Sylvain Malacria, Daniel V ogel, Edward Lank, and Géry Casiez. Chartdetective: Easy and accurate interactive data extraction from complex vector charts. InProceedings of the 2023 CHI Conference on Human Factors in Computing Systems, CHI ’23, New York, NY , USA, 2023. Association for Computing Machinery. ISBN 9781450394215. doi: 10.1145/3544...
-
[4]
svgdigitizer.https://github.com/echemdb/svgdigitizer, 2022
echemdb. svgdigitizer.https://github.com/echemdb/svgdigitizer, 2022
2022
- [5]
-
[6]
Bik, Arturo Casadevall, and Ferric C
Elisabeth M. Bik, Arturo Casadevall, and Ferric C. Fang. The prevalence of inappropriate image duplication in biomedical research publications.mBio, 7(3):10.1128/mbio.00809–16, 2016. doi: 10.1128/mbio.00809-16. URL https://journals.asm.org/doi/abs/10.1128/mbio.00809-16
-
[7]
IEEE. IEEE Standard for Floating-Point Arithmetic.IEEE Std 754-2019 (Revision of IEEE 754-2008), pages 1–84, 2019. doi: 10.1109/IEEESTD.2019.8766229
-
[8]
Planck Collaboration, N. Aghanim, et al. Planck 2018 results: Vi. cosmological parameters.Astronomy & Astrophysics, 641:A6, September 2020. ISSN 1432-0746. doi: 10.1051/0004-6361/201833910. URL http://dx.doi.org/10.1051/0004-6361/201833910
-
[9]
Trends in co2, ch4, n2o, sf6
NOAA Global Monitoring Laboratory. Trends in co2, ch4, n2o, sf6. https://gml.noaa.gov/ccgg/trends/, 2026
2026
-
[10]
Chinchilla scaling: A replication attempt, 2024
Tamay Besiroglu, Ege Erdil, Matthew Barnett, and Josh You. Chinchilla scaling: A replication attempt, 2024. URLhttps://arxiv.org/abs/2404.10102
-
[11]
Training Compute-Optimal Large Language Models
Jordan Hoffmann, Sebastian Borgeaud, Arthur Mensch, Elena Buchatskaya, Trevor Cai, Eliza Rutherford, Diego de Las Casas, Lisa Anne Hendricks, Johannes Welbl, Aidan Clark, Tom Hennigan, Eric Noland, Katie Millican, George van den Driessche, Bogdan Damoc, Aurelia Guy, Simon Osindero, Karen Simonyan, Erich Elsen, Jack W. Rae, Oriol Vinyals, and Laurent Sifre...
work page internal anchor Pith review Pith/arXiv arXiv 2022
discussion (0)
Sign in with ORCID, Apple, or X to comment. Anyone can read and Pith papers without signing in.