REVIEW 2 major objections 6 minor 26 references
Using stochastic thermodynamics with internal variables to capture orientational spreading in cell populations undergoing cyclic stretch
T0 review · 2 major / 6 minor · reviewed 2026-08-06 · deepseek-v4-flash
Pith's one-line read Cells that start sharply aligned with an energy maximum first spread out and then refocus at the energy minimum, according to a two-variable reduction of the Fokker-Planck model for cyclic-stretch reorientation.
desk verdict A von-Mises reduction of the cell reorientation Fokker-Planck equation that is worth reading, but the proposed switch experiment starts on an invariant line where the reduced model does not produce the two-stage prediction. read the letter →
The pith
A machine-rendered reading of the paper's core claim, the machinery that carries it, and where it could break.
The reading
What carries the argument
The load-bearing object is the $\pi$-periodic rescaled von Mises family $\tilde p(\theta|\mu,\kappa)$, the circular analogue of a Gaussian wrapped onto $(0,\pi)$, with internal variables $\mu$ (mean orientation) and $\kappa$ (order parameter). The projection machinery of [15] turns the Fokker-Planck operator into evolution equations for these internal variables; because the cross-metric term $\langle \partial \tilde s/\partial \mu, \partial \tilde s/\partial \kappa\rangle_{\tilde p}$ vanishes, the resulting system (13) is diagonal and autonomous, with drift and diffusion coefficients expressed through modified Bessel functions. Phase-plane analysis of this two-dimensional system is what reveals the non-monotone $\kappa(t)$ path underlying two-stage reorientation.
What would settle it
Run the switch experiment described in Remark 8: stretch cells cyclically along one axis until they reach steady alignment, then rotate the stretch axis by 90 degrees and follow the orientation histogram. Two-stage reorientation predicts an immediate transient broadening, meaning the order parameter must dip before recovering; its absence would falsify the central claim. Alternatively, repeat the protocol of [21] at decreasing stretch frequencies: if the spreading of orientations keeps increasing as frequency drops, the period-averaged constant-noise assumption fails, as the paper concedes.
Extended reading notes
Core claim
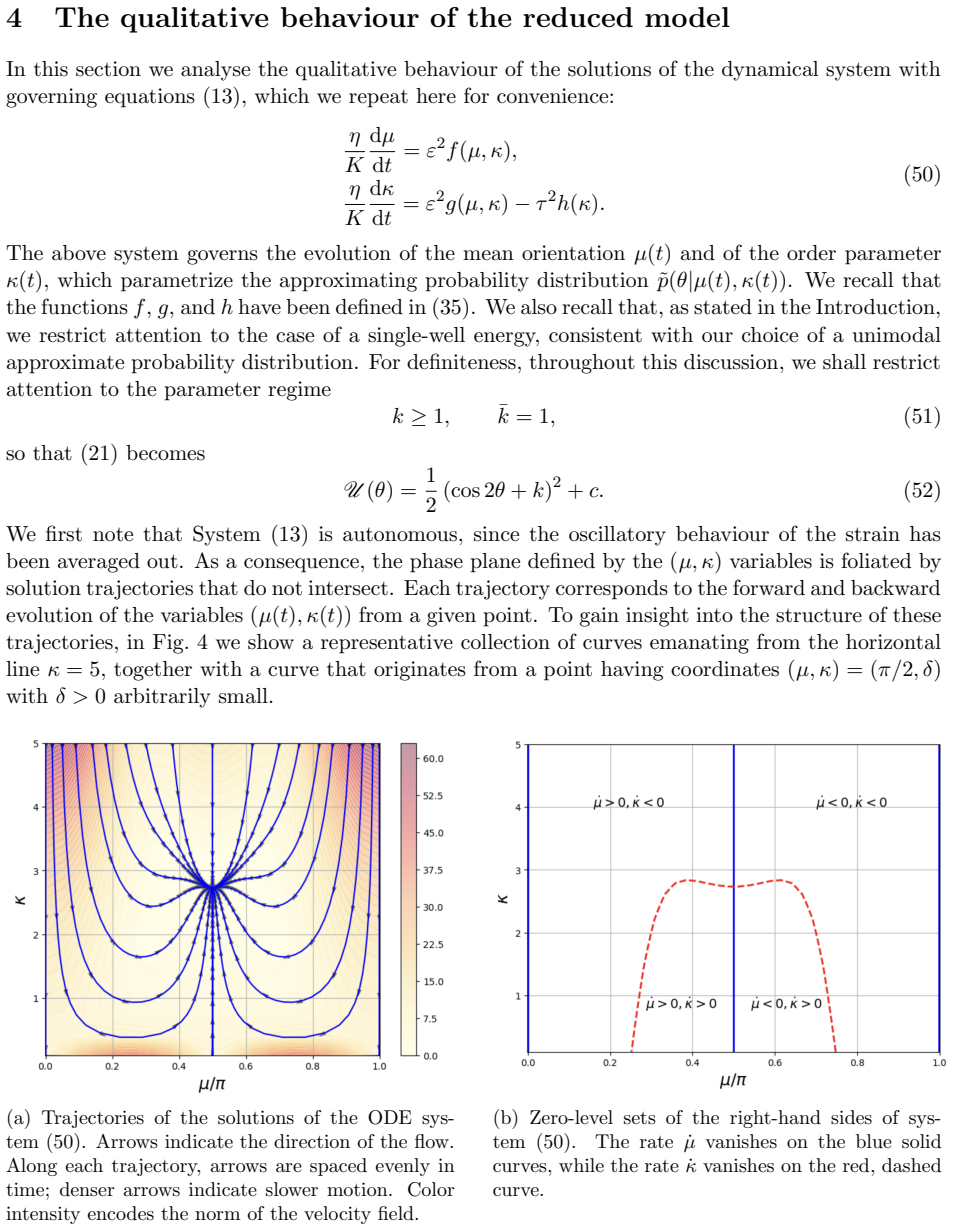
The central claim is that the full Fokker-Planck dynamics (6) can be faithfully compressed into the two-dimensional ODE system (13) for the mean orientation $\mu(t)$ and the order parameter $\kappa(t)$ of a $\pi$-periodic von Mises distribution. On that reduced landscape, a population that begins narrowly peaked near an energy maximum does not move directly toward the energy minimum. Instead, in the first stage the distribution broadens, so $\kappa(t)$ decreases while $\mu(t)$ rapidly converges to the minimum at $\pi/2$; in the second stage $\kappa(t)$ grows again as the distribution refocuses around that minimum. This two-stage reorientation is a property of the reduced system and, as the numerical Kullback-Leibler projection tests show, also of the original Fokker-Planck equation. The same reduced model yields a unique stationary concentration $\kappa^*$ that decreases with $\tau/\varepsilon$, matching the empirical rule that larger strains give sharper orientation peaks, and with a strain-dependent characteristic time $\eta/K$ it reproduces the transient order-parameter curves measured in [21].
Load-bearing premise
The prediction rests on cells sensing only the period-averaged strain, with a constant angular noise level, because the reorientation time is assumed to be much longer than the stretch period; the paper itself notes that frequency-dependent spreading observed in [21] lies outside this picture.
Editorial extensions
If this is right
- Steady-state spreading is tied to the ratio $\tau/\varepsilon$: lower effective strain gives a smaller stationary order parameter $\kappa^*$, so orientation histograms are broader, as observed in experiments.
- Switching the stretch axis should produce a measurable transient broadening of the orientation distribution before cells refocus along the new minimum; Remark 8 turns this into a testable protocol.
- The reduced ODE model can be used in place of the full Fokker-Planck equation for qualitative phase-plane studies, including asymptotic estimates of the equilibrium concentration.
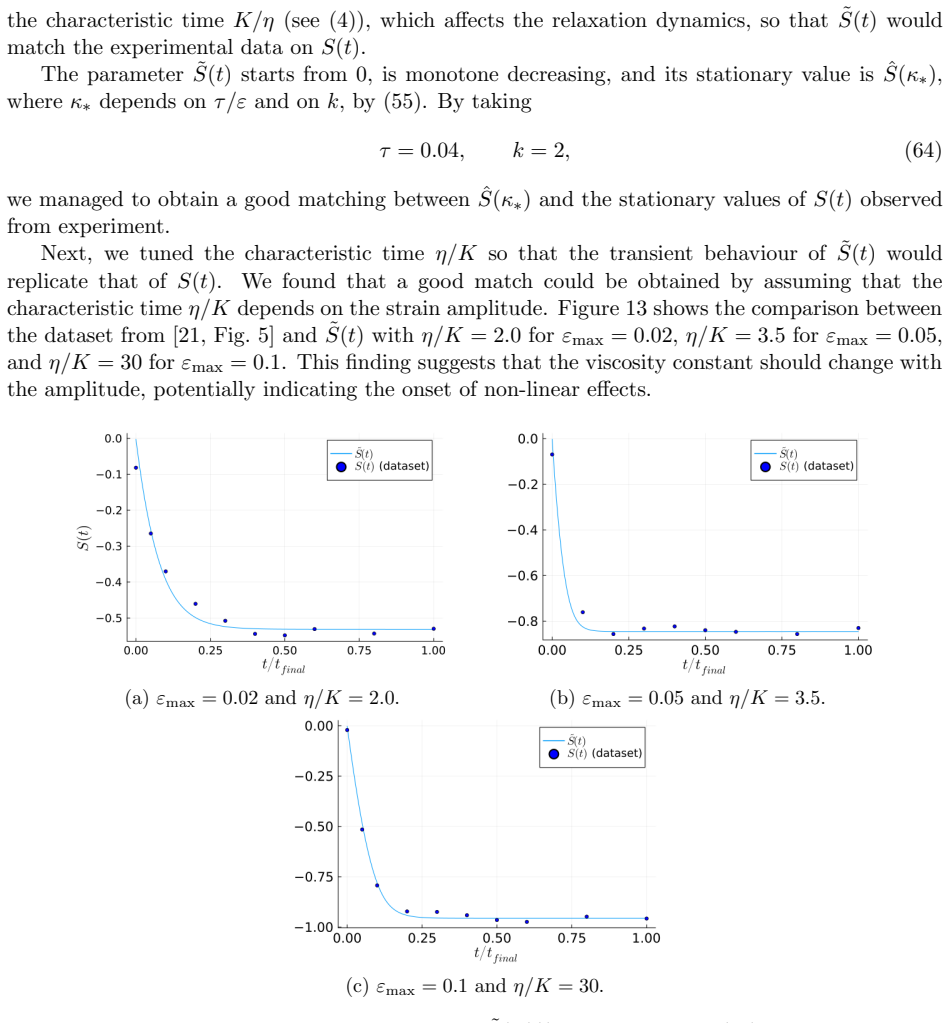
- Matching the transient data of [21] requires the characteristic time $\eta/K$ to increase with strain amplitude, indicating that constant-viscosity descriptions relax too quickly at large strains.
Reading between the lines
- Going beyond the paper: if the switch experiment confirms transient broadening, tissue-engineering protocols that alternate stretch directions may need to budget for a temporary loss of alignment after each switch.
- Going beyond the paper: the finding that $\eta/K$ must grow with strain amplitude suggests a concrete test, namely measuring reorientation completion time versus strain amplitude and checking whether it increases, as a strain-dependent viscosity would predict.
- Going beyond the paper: the same internal-variable closure could be applied to a bimodal von Mises ansatz for two-minimum energies; even if closed-form coefficients are unavailable, a numerical projection would show whether two-stage reorientation persists when two peaks compete.
Editorial analysis
A structured set of objections, weighed in public.
Referee Report
Summary. The paper revisits the Loy–Preziosi Fokker–Planck model for cell orientation under cyclic stretch and reformulates it using the stochastic-thermodynamics-with-internal-variables framework of Leadbetter et al. The orientation distribution is projected onto a π-periodic von Mises family, yielding a two-dimensional ODE system (13)/(50) for the mean orientation μ(t) and concentration κ(t). The authors compute the coefficients in closed form in terms of modified Bessel functions, perform a phase-plane analysis for single-well energies, identify a two-stage reorientation scenario for initial conditions near an energy maximum, compare the reduced ODE with numerical solutions of the full Fokker–Planck equation and with the experimental data of Mao et al., and propose a switch experiment in Remark 8 as a falsifiable test.
Significance. If the central claims hold, the paper provides a tractable low-dimensional reduction of a Fokker–Planck equation with explicit coefficients, a transparent phase-plane analysis, and a falsifiable transient prediction. The derivation from the Leadbetter et al. scheme is structurally sound, the closed-form coefficients (33)–(36) are a genuine technical asset, and the two-stage reorientation is independently observed in the full Fokker–Planck numerics for off-maximum initial conditions (Fig. 11b). The authors are also candid about limitations: the constant-viscosity assumption, the frequency-dependence of spreading, and the interpretive nature of the numerical comparison in Remark 11. However, the proposed switch experiment is not actually reproduced by the reduced ODE for the protocol as stated, and the uniform-initial-condition numerical test contains an internal inconsistency, so the manuscript needs substantive revision before the central predictive claim can be accepted.
major comments (2)
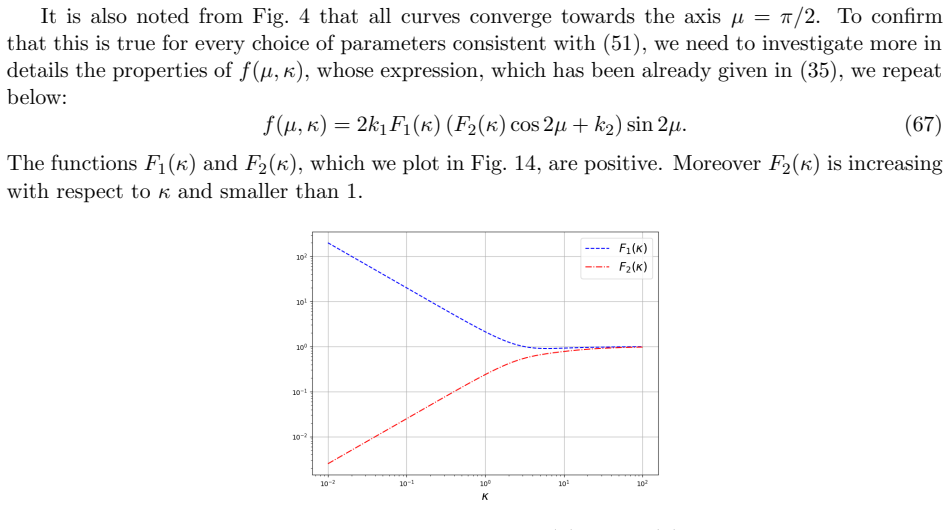
- [Remark 8 and §4 (Eqs. (50), (66), (78))] The proposed switch experiment starts from the old steady state, whose symmetry places the initial condition exactly on the invariant line μ = π/2. Since f(π/2, κ) = 0 for all κ by Eq. (66), the reduced ODE (50) keeps μ(t) = π/2 for all t, and on this line Eq. (78) gives κ̇ < 0 for large κ, followed by approach to the fixed point (π/2, κ*) located at the energy maximum. Thus the ODE never produces the announced 'brief broadening then refocusing around the new minimum' of Remark 8; the two-stage trajectory in Fig. 6 uses μ0/π = 2·10⁻², not the actual post-switch state. The full Fokker–Planck solution preserves symmetry and its KL projection jumps from μ = π/2 to μ = 0 with κ passing through 0, a scenario that the unimodal reduced ODE cannot represent. This breaks the link between the reduced model and the proposed experiment. The authors should either revise the protocol to include a characterized symmetry-breaking perturbation, or analyze the KL projection of the symmetric full solution and explain how the reduced system handles the jump.
- [§5, uniform initial condition (Eqs. (42), (66), (78))] The text states that for a uniform initial condition 'we have chosen μ0 = 0', but Fig. 9 shows μ(t) instantaneously converging to π/2 and κ(t) increasing to κ*. Both features are impossible with μ0 = 0: by Eq. (66) f(0, κ) = 0, so μ(t) = 0 for all t, and by Eq. (78) κ̇ < 0 on μ = 0. The reported numerical test is therefore internally inconsistent as written. The authors should correct the stated initial condition (probably μ0 = π/2) and discuss the degeneracy of the KL projection at κ = 0, where μ is undetermined.
minor comments (6)
- [§7, first sentence] The phrase 'an order parameter ω(t)' should read κ(t); the symbol ω is not defined in the paper.
- [§6, Eq. (59) and surrounding text] The order parameter S(t) is defined as ⟨cos 2θ⟩, but two sentences state 'expected value of cos θ'; these should refer to cos 2θ.
- [§5, after Eq. (57)] The sentence 'These are the same parameters that defermine κ∗' contains a typo ('defermine' should be 'determine'), and the same symbol κ∗ is used for the KL-optimal stationary value and for the ODE fixed point; these should be distinguished.
- [§2.1 and §4] There are wording slips: 'spreading is more pronounced for small small strains' has a duplicated word, and 'the mean concentration µ(t) evolves monotonically' in the two-stage reorientation paragraph should be 'the mean orientation µ(t)'.
- [§5, numerical validation] The comparison in Figs. 9–11 shows agreement between the ODE parameters and the KL-optimal parameters of the full solution, but it does not quantify the actual error between p(θ,t) and p̃(θ|μ(t),κ(t)); reporting a direct distance (e.g., L¹ or KL divergence) would strengthen the validation.
- [Remark 9 and §5] Minor textual errors: 'is suffices' should be 'it suffices' in Remark 9, and 'ration τ/ε' should be 'ratio τ/ε' in Section 5.
Circularity Check
The reduction is self-contained and the two-stage prediction is not fitted, but the numerical validation compares the ODE against the same KL-optimal projection used to build the ODE, a mild self-referential check.
-
self definitional
[Section 5 (Numerical tests), eq. (58) and Remark 11]
"At each time t, we define μ̄(t) and κ̄(t) by solving the minimization problem (μ̄(t), κ̄(t)) = argmin_{μ,κ} D_KL(p(·,t)∥p̃(·;μ,κ)) ... Their agreement with μ(t) and κ(t) serves as our metric for assessing the quality of our approximation. ... In exact terms, our test does not aim to quantify the error between the true solution p(θ,t) and the approximation p̃(θ|μ(t),κ(t)). Instead, it seeks to demonstrate that the solution (μ(t),κ(t)) of the dynamical system (13) closely matches the optimal parameters μ̄(t) and κ̄(t) obtained via an information-theoretic criterion."
The reduced ODE (13) is derived by applying the Leadbetter-Purohit-Reina variational closure to the Fokker-Planck equation using the same information-theoretic (KL) metric that defines the optimal approximating parameters μ̄,κ̄. The numerical test then evaluates (13) by comparing it to those same KL-optimal parameters of the exact solution. Thus the agreement is a consistency check with the closure's own construction criterion: if the von Mises family were exactly invariant under the FP flow, the ODE trajectory and the KL projection would coincide by definition. The paper's Remark 11 explicitly narrows the test to matching the information-theoretic criterion, acknowledging that it does not measure error to the true solution.
full rationale
The central derivation of the reduced ODE system (13) is a self-contained projection of the Fokker-Planck equation (6) onto the von Mises family, with coefficients computed in closed form from Bessel functions; the fixed-point equation (55) is derived, not fitted. The two-stage reorientation prediction is a genuine phase-plane consequence of (13), and the paper independently verifies (in Fig. 11b) that the same phenomenon appears in the full Fokker-Planck solution's optimal projection, so the main claim does not reduce to an input. The experimental comparison in Section 6 is a transparent parameter fit (τ, k, η/K tuned to Mao et al. data), not a prediction from the model, so it is not a circular step. The only noteworthy circularity is the numerical validation of Section 5: the ODE is constructed from the KL/information-theoretic projection, and the test judges it by comparison to the KL-optimal projection, so part of the agreement is by construction. This is acknowledged in Remark 11 and does not undermine the independent content of the phase-plane analysis. A separate correctness concern, not circularity, arises in Remark 8's proposed switch experiment: the post-switch steady state lies exactly on the invariant line μ=π/2 of the reduced ODE (f(π/2,κ)=0), so the reduced ODE predicts only monotonic broadening from that exact initial condition, whereas the two-stage prediction requires an initial condition slightly off the maximum; the full Fokker-Planck solution, by contrast, preserves symmetry and the optimal μ jumps, so the experimental protocol as stated may not test the reduced model's two-stage prediction without a symmetry-breaking perturbation. This does not affect the circularity score.
Assumptions & free parameters
free parameters (4)
- τ (pseudo-temperature, τ²=ηD/K) =
0.04 (Eq. (64)); τ=0.1 in Section 5 numerics
- k (energy landscape parameter) =
2 (Eq. (64)); k=1.0 in Section 5 via Ks=0.7, K⊥=0.28, r=0.11
- η/K (characteristic time, fitted per strain amplitude) =
2.0, 3.5, 30 for εmax=0.02, 0.05, 0.1
- initial (μ0, κ0) in the two-stage illustrations =
e.g., μ0=0.02π, κ0=5 (Fig. 6); μ0=π/100, κ0∈{1,10,50} (Fig. 11); uniform case κ0=0, μ0 arbitrary (Remark 7)
assumptions (6)
- domain assumption The stochastic dynamics is a Langevin equation dθ=Ω(θ)dt+√(2D)dW on [0,π) with constant angular diffusivity D and the Loy-Preziosi energy (18).
- domain assumption Cells respond to the period-averaged strain ε², i.e., the reorientation time η/(ε²K) is much larger than the period 1/ω.
- ad hoc to paper The solution p(θ,t) of the Fokker-Planck equation is well represented at all times by a π-periodic von Mises family p̃(θ|μ(t),κ(t)).
- domain assumption The Leadbetter-Purohit-Reina variational principle (Eq. (26) from [15]) gives the best evolution of the internal variables (μ,κ).
- ad hoc to paper The analysis is restricted to single-well energies, k≥1 and ¯k=1 (case (c) of the energy landscape).
- standard math Standard asymptotic and monotonicity properties of the modified Bessel functions I0, I1, I2.
invented entities (2)
-
Strain-dependent effective viscosity η(εmax)
-
Two-stage reorientation phenomenon
independent evidence
Cite this review
Pith. "Pith review of Using stochastic thermodynamics with internal variables to capture orientational spreading in cell populations undergoing cyclic stretch." pith.science (2026). https://pith.science/paper/PI5XCUQG
@misc{pith2026250715694,
  author       = {Pith},
  title        = {Pith review of: Using stochastic thermodynamics with internal variables to capture orientational spreading in cell populations undergoing cyclic stretch},
  year         = {2026},
  howpublished = {\url{https://pith.science/paper/PI5XCUQG}},
  note         = {Machine review of arXiv:2507.15694}
}
read the original abstract
We revisit the modeling framework introduced in [N. Loy and L. Preziosi: Bull. Math. Bio., 85, 2023] to describe the dynamics of cell orientation under cyclic stretch. We propose a reformulation based on the principles of Stochastic Thermodynamics with Internal Variables introduced in [T. Leadbetter, P. Purohit, and C. Reina: PNAS Nexus, 2, 2023]. This approach allows us to describe not only the evolution of the orientation distribution, but also the observed spreading phenomenon. The insight provided by our model reveals an interesting phenomenon, which we call two-stage reorientation: when cells begin aligned with an energy maximum, their orientations spread before concentrating at the energy minimum. This theoretical prediction suggests a new experiment to test this modeling framework.
Figures


Figures from the paper (18 more)




Reference graph
Works this paper leans on
-
[1]
R. Abeyaratne, E. Puntel, and G. Tomassetti. An Elementary Model of Focal Adhesion Detachment and Reattachment During Cell Reorientation Using Ideas from the Kinetics of Wiggly Energies. J. Elasticity , 155, 2022. 21
work page 2022
-
[2]
M. Abramowitz and I. A. Stegun, editors. Handbook of Mathematical Functions with Formulas, Graphs, and Mathematical Tables, volume 55 of Applied Mathematics Series. National Bureau of Standards, Washington, D.C., 1964
work page 1964
- [3]
-
[4]
R. C. Buck. The longitudinal orientation of structures in the subendothelial space of rat aorta. American Journal of Anatomy , 156(1):1–14, 1979
work page 1979
-
[5]
R. C. Buck. Reorientation response of cells to repeated stretch and recoil of the substratum. Experimental Cell Research, 127(2):470–474, 1980
work page 1980
-
[6]
A. M. Collinsworth, C. E. Torgan, S. N. Nagda, R. J. Rajalingam, W. E. Kraus, and G. A. Truskey. Orientation and length of mammalian skeletal myocytes in response to a unidirectional stretch. Cell Tissue Res. , 302:243–251, 2000
work page 2000
-
[7]
S. Das, A. Ippolito, P. McGarry, and V. S. Deshpande. Cell reorientation on a cyclically strained substrate. PNAS Nexus , 1:pgac199, Nov. 2022
work page 2022
-
[8]
R. De, A. Zemel, and S. A. Safran. Dynamics of cell orientation. Nature Physics, 3:655–659, 2007
work page 2007
Show all 26 references
-
[9]
Eastwood, V
M. Eastwood, V. C. Mudera, D. A. McGrouther, and R. A. Brown. Effect of precise me- chanical loading on fibroblast-populated collagen lattices: Morphological changes. Cell Motil. Cytoskeleton, 40:13–21, 1998
1998
-
[10]
Faust, N
U. Faust, N. Hampe, W. Rubner, N. Kirchgeßner, S. Safran, B. Hoffmann, and R. Merkel. Cyclic Stress at mHz Frequencies Aligns Fibroblasts in Direction of Zero Strain. PLoS ONE, 6:e28963, 2011
2011
-
[11]
Gatto and S
R. Gatto and S. R. Jammalamadaka. The generalized von Mises distribution. Stat. Method., 4:341–353, July 2007
2007
-
[12]
N. F. Jufri, A. Mohamedali, A. Avolio, and M. S. Baker. Mechanical stretch: physiological and pathological implications for human vascular endothelial cells. Vascular Cell, 7(1):8, 2015
2015
-
[13]
Kullback
S. Kullback. Information Theory and Statistics . John Wiley & Sons, New York, 1959. Reprinted by Dover Publications, 1997
1959
-
[14]
Kullback and R
S. Kullback and R. A. Leibler. On information and sufficiency. Annals of Mathematical Statistics, 22(1):79–86, 1951
1951
-
[15]
Leadbetter, P
T. Leadbetter, P. K. Purohit, and C. Reina. A statistical mechanics framework for constructing non-equilibrium thermodynamic models. PNAS Nexus , 2(2), 2023
2023
-
[16]
Leadbetter, P
T. Leadbetter, P. K. Purohit, and C. Reina. On a structure preserving closure of Langevin dynamics, arXiv:2506.08156, 2025
2025 arXiv
-
[17]
Livne, E
A. Livne, E. Bouchbinder, and B. Geiger. Cell reorientation under cyclic stretching. Nature Communications, 5:3938, 2014. 22
2014
-
[18]
Loy and L
N. Loy and L. Preziosi. A statistical mechanics approach to describe cell reorientation under stretch. Bulletin of Mathematical Biology , 85(60), 2023
2023
-
[19]
Lucci, C
G. Lucci, C. Giverso, and L. Preziosi. Cell orientation under stretch: Stability of a linear viscoelastic model. Mathematical Biosciences, 337:108630, 2021
2021
-
[20]
Lucci and L
G. Lucci and L. Preziosi. A nonlinear elastic description of cell preferential orientations over a stretched substrate. Biomechanics and Modeling in Mechanobiology , 20:631–649, 2021
2021
-
[21]
T. Mao, Y. He, Y. Gu, Y. Yang, Y. Yu, X. Wang, and J. Ding. Critical frequency and critical stretching rate for reorientation of cells on a cyclically stretched polymer in a microfluidic chip. ACS Applied Materials & Interfaces , 13(12):13934–13948, 2021
2021
-
[22]
K. V. Mardia and P. E. Jupp. Directional Statistics. Wiley Series in Probability and Statistics. John Wiley & Sons, Chichester, 2000
2000
-
[23]
H. Risken. The Fokker-Planck Equation: Methods of Solution and Applications . Springer- Verlag, New York, 1996
1996
-
[24]
C. E. Shannon. A Mathematical Theory of Communication. Bell System Technical Journal , 27:379–423, July 1948
1948
-
[25]
S. S. Shishvan, A. Vigliotti, and V. S. Deshpande. The homeostatic ensemble for cells. Biome- chanics and Modeling in Mechanobiology , 17:1631–1662, 2018
2018
-
[26]
ganzzahligkeit
R. von Mises. ¨Uber die “ganzzahligkeit” der atomgewichte und verwandte fragen. Reprinted from Physikalische Zeitschrift 19 (1918), pp. 490–500. In P. Frank, S. Goldstein, M. Kac, W. Prager, G. Szeg¨ o, and G. Birkhoff, editors, Selected Papers of Richard von Mises: Vol- ume 2...
1918
Reviewed August 6, 2026 · model on record in the stance chip above.
Discussion (0). Continue with ORCID to comment.