The EDGE-CALIFA Survey: Star Formation Efficiency and Galaxy Quenching across 62 Main Sequence, Green Valley, and Red Galaxies
Pith reviewed 2026-06-26 08:10 UTC · model grok-4.3
The pith
Quenched galaxies below the main sequence retain molecular gas but convert it to stars far less efficiently.
A machine-rendered reading of the paper's core claim, the machinery that carries it, and where it could break.
Core claim
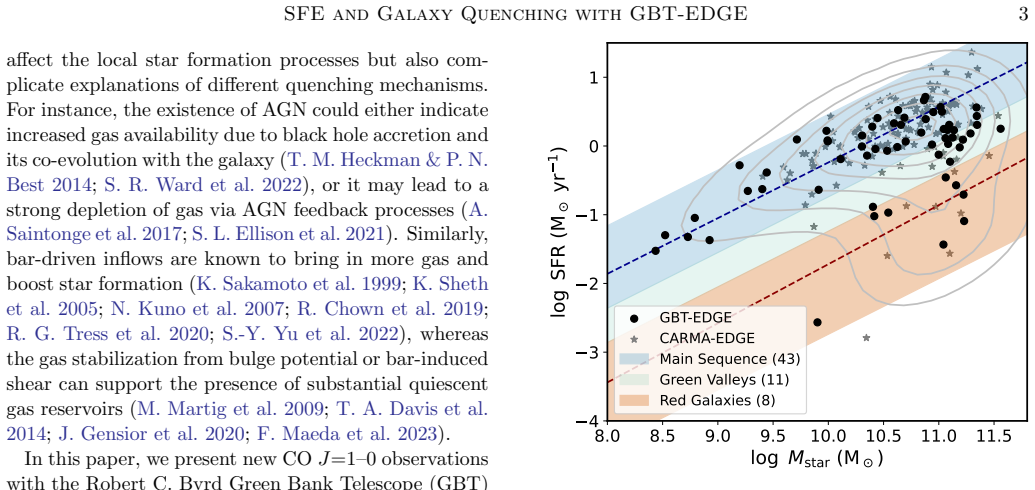
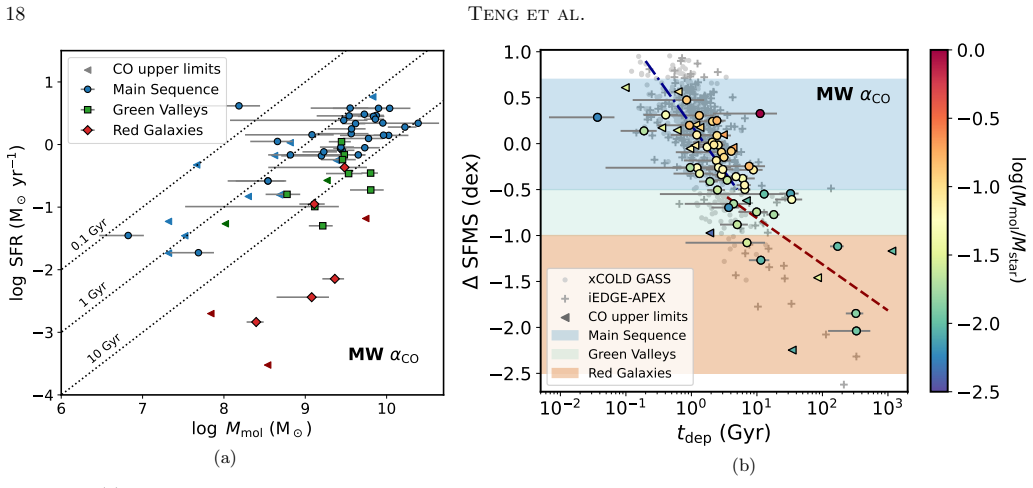
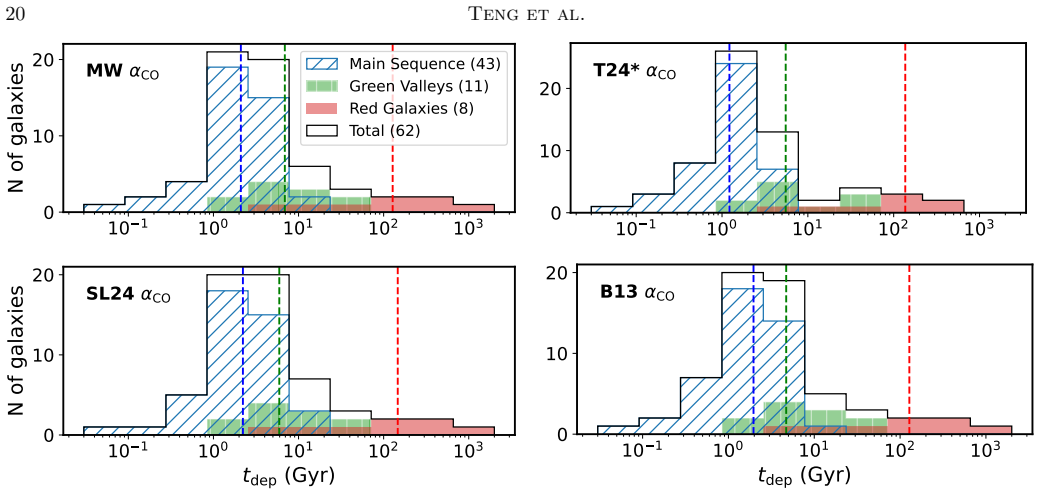
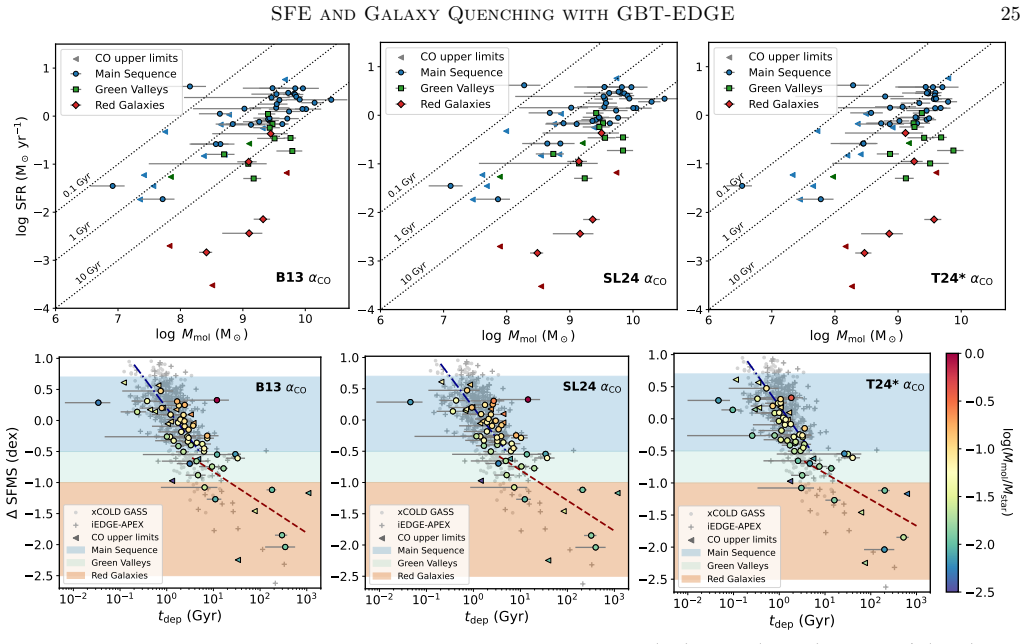
By combining new GBT CO(1-0) maps with CALIFA integral-field spectroscopy, the survey derives molecular gas masses, star-formation rates, and metallicities for 62 galaxies. Median depletion times are 2.10 Gyr on the main sequence, 6.90 Gyr in the green valley, and 127.7 Gyr on the red sequence when a Galactic conversion factor is used. Systematic decline in star-formation efficiency with offset below the main sequence persists across multiple conversion-factor choices, demonstrating that many quenched galaxies retain molecular gas masses comparable to star-forming systems yet form stars at much lower rates.
What carries the argument
Star-formation efficiency (SFR per unit molecular gas mass) measured from CO(1-0) luminosity and optical SFR tracers, tracked as a function of offset from the star-forming main sequence.
If this is right
- Quenched galaxies can hold molecular gas reservoirs similar in mass to those on the main sequence.
- Depletion times lengthen by factors of several to more than 50 below the main sequence.
- Suppressed efficiency, rather than gas removal, accounts for the bulk of the drop in star-formation rate.
- Low gas density together with morphological stabilization can jointly reduce efficiency.
Where Pith is reading between the lines
- Quenching processes may act primarily by lowering the dense-gas fraction or raising the density threshold for collapse rather than by expelling the entire molecular reservoir.
- High-resolution maps of dense-gas tracers in green-valley systems could test whether the efficiency drop is localized to particular galactic structures.
- Evolutionary models that treat quenching as simple gas exhaustion would need revision if efficiency suppression is the dominant mechanism.
Load-bearing premise
That CO(1-0) emission traces the total molecular gas mass across the full range of metallicities and conditions in green-valley and red galaxies once the tested conversion-factor prescriptions are applied.
What would settle it
A direct measurement, using an independent gas-mass tracer such as dust continuum or [C I], showing that red-sequence galaxies actually contain far less molecular gas than the CO-derived values or that the efficiency trend disappears when gas mass is estimated without CO.
Figures
read the original abstract
We present GBT-EDGE, a new CO(1-0) survey using the Green Bank Telescope to map 62 nearby (10-140 Mpc) galaxies spanning the star-forming main sequence (SFMS), green valley, and red sequence. The galaxy sample is selected from the CALIFA survey with integral field spectroscopy (IFS), which provides a representative census of local galactic environments. Combining the CO dataset with CALIFA's optical IFS measurements, we derive molecular gas masses, star formation rates (SFR), metallicities, and stellar mass densities to measure star formation efficiency (SFE) and investigate the physical drivers of galaxy quenching. We obtain a median molecular gas depletion time of $2.10^{+2.35}_{-1.31}$, $6.90^{+17.00}_{-3.67}$, and $127.7^{+201.6}_{-113.4}$ Gyr for our sample of main sequence, green valley, and red galaxies, respectively, assuming a Galactic CO-to-H2 conversion factor. By applying various conversion factor prescriptions, we also confirm a systematic decrease of SFE with galaxy's offset below the SFMS, regardless of the adopted prescription. This suggests that the low SFR in some quenched galaxies is primarily driven by suppressed SFE rather than an absence of molecular gas. Our results provide evidence that galaxies below the main sequence can retain substantial molecular gas reservoirs comparable to star-forming galaxies, but they exhibit longer depletion times and form stars inefficiently, possibly due to the combined effects of low gas density and morphological quenching mechanisms.
Editorial analysis
A structured set of objections, weighed in public.
Referee Report
Summary. The paper presents the GBT-EDGE CO(1-0) survey with the Green Bank Telescope, mapping molecular gas in 62 nearby galaxies (10-140 Mpc) selected from the CALIFA IFS survey. The sample spans the star-forming main sequence, green valley, and red sequence. Combining CO data with CALIFA optical measurements, the authors derive molecular gas masses, SFRs, metallicities, and stellar densities to compute depletion times and star formation efficiencies. They report median depletion times of 2.10, 6.90, and 127.7 Gyr for MS, GV, and red galaxies under a Galactic X_CO, and find that the systematic decline in SFE below the SFMS persists across multiple conversion-factor prescriptions. The central claim is that low SFR in quenched galaxies is driven primarily by suppressed SFE rather than absence of molecular gas, with red galaxies retaining substantial molecular reservoirs.
Significance. If the CO(1-0) luminosities reliably trace total M_H2, the result would provide direct evidence that quenching involves reduced efficiency rather than complete gas removal, with implications for morphological quenching and density-dependent star formation. The multi-prescription test and use of a representative IFS-selected sample are strengths that allow comparison across environments. The work adds to the literature on gas content in the green valley and red sequence by reporting spatially matched measurements.
major comments (2)
- [Abstract] Abstract and implied methods: the central claim that 'the low SFR in some quenched galaxies is primarily driven by suppressed SFE rather than an absence of molecular gas' and that 'galaxies below the main sequence can retain substantial molecular gas reservoirs' depends on the CO(1-0) emission yielding reliable total M_H2. The tested prescriptions (Galactic X_CO and variants) are largely calibrated on star-forming systems; no explicit test or justification is provided for systematic shifts in excitation, optical depth, or CO-dark H2 fractions expected at the low densities and metallicities of green-valley/red galaxies. A bias that underestimates M_H2 in red objects would artificially shorten their reported depletion times (127.7 Gyr median) and weaken the conclusion.
- [Abstract] Sample description and data combination: the abstract states the sample is 'selected from the CALIFA survey' and that CO and IFS data are combined, but does not specify the exact selection criteria, the spatial matching procedure between GBT single-dish CO maps and CALIFA IFS apertures, or the treatment of non-detections and upper limits when computing depletion times for the red-sequence subsample. These details are load-bearing for the reported median values and the cross-population comparison.
minor comments (1)
- [Abstract] The asymmetric uncertainties on the depletion times are reported but the method for deriving them (e.g., bootstrap, Monte Carlo on fluxes and SFRs) is not stated in the abstract; adding a brief methods sentence would improve clarity.
Simulated Author's Rebuttal
We thank the referee for their detailed and constructive report. We address each major comment below and outline revisions that will strengthen the manuscript while preserving its core conclusions.
read point-by-point responses
-
Referee: [Abstract] Abstract and implied methods: the central claim that 'the low SFR in some quenched galaxies is primarily driven by suppressed SFE rather than an absence of molecular gas' and that 'galaxies below the main sequence can retain substantial molecular gas reservoirs' depends on the CO(1-0) emission yielding reliable total M_H2. The tested prescriptions (Galactic X_CO and variants) are largely calibrated on star-forming systems; no explicit test or justification is provided for systematic shifts in excitation, optical depth, or CO-dark H2 fractions expected at the low densities and metallicities of green-valley/red galaxies. A bias that underestimates M_H2 in red objects would artificially shorten their reported depletion times (127.7 Gyr median) and weaken the conclusion.
Authors: We appreciate the referee's emphasis on this potential systematic uncertainty. Our multi-prescription analysis demonstrates that the SFE decline persists even when adopting metallicity- and density-dependent X_CO variants. Nevertheless, we agree that the prescriptions are primarily calibrated on star-forming systems and that an explicit discussion of applicability to quenched galaxies is warranted. In the revised manuscript we will add a dedicated subsection (likely in Section 4 or 5) that (i) reviews literature on CO excitation and CO-dark H2 in low-density, low-metallicity regimes, (ii) quantifies the plausible range of bias in M_H2 for our red-sequence subsample, and (iii) shows how even a factor-of-two underestimate in M_H2 would still leave the median depletion time for red galaxies an order of magnitude longer than for the main sequence. This addition will not alter the reported medians but will better bound the robustness of the central claim. revision: partial
-
Referee: [Abstract] Sample description and data combination: the abstract states the sample is 'selected from the CALIFA survey' and that CO and IFS data are combined, but does not specify the exact selection criteria, the spatial matching procedure between GBT single-dish CO maps and CALIFA IFS apertures, or the treatment of non-detections and upper limits when computing depletion times for the red-sequence subsample. These details are load-bearing for the reported median values and the cross-population comparison.
Authors: We agree that the abstract's brevity omits key methodological information. The full selection function (stellar-mass and redshift cuts, morphological and environmental criteria drawn from the CALIFA parent sample), the GBT-to-CALIFA aperture matching procedure (including beam convolution and centering), and the statistical treatment of non-detections (Kaplan–Meier estimator for censored data) are described in Sections 2 and 3. To address the referee's concern we will expand the abstract by one or two sentences that (i) state the primary selection criteria, (ii) note that GBT maps are spatially matched to the CALIFA hexagonal apertures, and (iii) indicate that upper limits are incorporated via survival analysis when computing medians for the red subsample. These changes will make the abstract self-contained while remaining within length limits. revision: yes
Circularity Check
No circularity: depletion times and SFE trends are direct empirical measurements
full rationale
The central result (longer depletion times below the SFMS) follows from tau_dep = M_H2 / SFR, where M_H2 is obtained from observed CO(1-0) luminosity scaled by independently chosen X_CO prescriptions and SFR is measured separately via CALIFA optical IFS. No equation defines SFE or depletion time in terms of the reported trend; the systematic decline in SFE is an observed correlation across the sample, not a fitted or self-referential quantity. No self-citation is invoked as a uniqueness theorem or load-bearing premise for the main claim. The applicability of X_CO prescriptions is an external assumption subject to falsification, not a circular reduction. The derivation chain is therefore self-contained against the paper's own data products.
Axiom & Free-Parameter Ledger
free parameters (1)
- CO-to-H2 conversion factor
axioms (1)
- domain assumption CO(1-0) luminosity traces total molecular hydrogen mass across the metallicity and density range of the sample
Reference graph
Works this paper leans on
-
[1]
Monthly Notices of the Royal Astronomical Society , volume =
Abadi, M. G., Moore, B., & Bower, R. G. 1999, MNRAS, 308, 947, doi: 10.1046/j.1365-8711.1999.02715.x
-
[2]
2017, MNRAS, 470, 4750, doi: 10.1093/mnras/stx1556
Accurso, G., Saintonge, A., Catinella, B., et al. 2017, MNRAS, 470, 4750, doi: 10.1093/mnras/stx1556
-
[3]
Aird, J., Coil, A. L., & Georgakakis, A. 2019, MNRAS, 484, 4360, doi: 10.1093/mnras/stz125
-
[4]
Alatalo, K., Davis, T. A., Bureau, M., et al. 2013, MNRAS, 432, 1796, doi: 10.1093/mnras/sts299
-
[5]
Asplund, M., Grevesse, N., Sauval, A. J., & Scott, P. 2009, ARA&A, 47, 481, doi: 10.1146/annurev.astro.46.060407.145222 Astropy Collaboration, Price-Whelan, A. M., Lim, P. L., et al. 2022, ApJ, 935, 167, doi: 10.3847/1538-4357/ac7c74
-
[6]
Barrera-Ballesteros, J. K., Heckman, T., S´ anchez, S. F., et al. 2021, ApJ, 909, 131, doi: 10.3847/1538-4357/abd855
-
[7]
K., Cruz-Gonz´ alez, I., Colombo, D., et al
Barrera-Ballesteros, J. K., Cruz-Gonz´ alez, I., Colombo, D., et al. 2025, ApJ, 978, 23, doi: 10.3847/1538-4357/ad85d1
-
[8]
2025, A&A, 697, A149, doi: 10.1051/0004-6361/202453437
Bazzi, Z., Colombo, D., Bigiel, F., et al. 2025, A&A, 697, A149, doi: 10.1051/0004-6361/202453437
-
[9]
2008, AJ, 136, 2846, doi: 10.1088/0004-6256/136/6/2846
Bigiel, F., Leroy, A., Walter, F., et al. 2008, AJ, 136, 2846, doi: 10.1088/0004-6256/136/6/2846
-
[10]
The Galaxy in Context: Structural, Kinematic and Integrated Properties
Bland-Hawthorn, J., & Gerhard, O. 2016, ARA&A, 54, 529, doi: 10.1146/annurev-astro-081915-023441
work page Pith review doi:10.1146/annurev-astro-081915-023441 2016
-
[11]
Bluck, A. F. L., Piotrowska, J. M., & Maiolino, R. 2023, ApJ, 944, 108, doi: 10.3847/1538-4357/acac7c
-
[12]
The CO-to-H2 Conversion Factor
Bolatto, A. D., Wolfire, M., & Leroy, A. K. 2013, ARA&A, 51, 207, doi: 10.1146/annurev-astro-082812-140944
work page internal anchor Pith review doi:10.1146/annurev-astro-082812-140944 2013
-
[13]
D., Wong, T., Utomo, D., et al
Bolatto, A. D., Wong, T., Utomo, D., et al. 2017, ApJ, 846, 159, doi: 10.3847/1538-4357/aa86aa
-
[14]
Brinchmann, J., Charlot, S., White, S. D. M., et al. 2004, MNRAS, 351, 1151, doi: 10.1111/j.1365-2966.2004.07881.x
-
[15]
2020, MNRAS, 498, L66, doi: 10.1093/mnrasl/slaa128 Cano-D´ ıaz, M.,´Avila-Reese, V., S´ anchez, S
Carniani, S. 2020, MNRAS, 498, L66, doi: 10.1093/mnrasl/slaa128 Cano-D´ ıaz, M.,´Avila-Reese, V., S´ anchez, S. F., et al. 2019, MNRAS, 488, 3929, doi: 10.1093/mnras/stz1894 Cano-D´ ıaz, M., S´ anchez, S. F., Zibetti, S., et al. 2016, ApJL, 821, L26, doi: 10.3847/2041-8205/821/2/L26
-
[16]
Cardelli, J. A., Clayton, G. C., & Mathis, J. S. 1989, ApJ, 345, 245, doi: 10.1086/167900 Catal´ an-Torrecilla, C., Gil de Paz, A., Castillo-Morales, A., et al. 2015, A&A, 584, A87, doi: 10.1051/0004-6361/201526023
-
[17]
2014, Publications of the Astronomical Society of Australia, 31, 48, doi: 10.1017/pasa.2014.43
Chennamangalam, J., Scott, S., Jones, G., et al. 2014, Publications of the Astronomical Society of Australia, 31, 48, doi: 10.1017/pasa.2014.43
-
[18]
Chiang, I.-D., Sandstrom, K. M., Chastenet, J., et al. 2024, ApJ, 964, 18, doi: 10.3847/1538-4357/ad23ed
-
[19]
2019, MNRAS, 484, 5192, doi: 10.1093/mnras/stz349
Chown, R., Li, C., Athanassoula, E., et al. 2019, MNRAS, 484, 5192, doi: 10.1093/mnras/stz349
-
[20]
2018, MNRAS, 475, 1791, doi: 10.1093/mnras/stx3233
Colombo, D., Kalinova, V., Utomo, D., et al. 2018, MNRAS, 475, 1791, doi: 10.1093/mnras/stx3233
-
[21]
Colombo, D., Sanchez, S. F., Bolatto, A. D., et al. 2020, A&A, 644, A97, doi: 10.1051/0004-6361/202039005
-
[22]
2025a, A&A, 699, A367, doi: 10.1051/0004-6361/202453217
Colombo, D., Kalinova, V., Bazzi, Z., et al. 2025a, A&A, 699, A367, doi: 10.1051/0004-6361/202453217
-
[23]
2025b, A&A, 699, A366, doi: 10.1051/0004-6361/202453179
Colombo, D., Kalinova, V., Bazzi, Z., et al. 2025b, A&A, 699, A366, doi: 10.1051/0004-6361/202453179
-
[24]
2017, MNRAS, 465, 1384, doi: 10.1093/mnras/stw2766
Curti, M., Cresci, G., Mannucci, F., et al. 2017, MNRAS, 465, 1384, doi: 10.1093/mnras/stw2766
-
[25]
Davis, T. A., Young, L. M., Crocker, A. F., et al. 2014, MNRAS, 444, 3427, doi: 10.1093/mnras/stu570 De Vis, P., Jones, A., Viaene, S., et al. 2019, A&A, 623, A5, doi: 10.1051/0004-6361/201834444 den Brok, J., Jim´ enez-Donaire, M. J., Leroy, A., et al. 2025, AJ, 169, 18, doi: 10.3847/1538-3881/ad888a den Brok, J. S., Chatzigiannakis, D., Bigiel, F., et a...
-
[26]
What drives central starbursts at z 0?
Ellison, S. L., Thorp, M. D., Pan, H.-A., et al. 2020a, MNRAS, 492, 6027, doi: 10.1093/mnras/staa001
-
[27]
Ellison, S. L., Thorp, M. D., Lin, L., et al. 2020b, MNRAS, 493, L39, doi: 10.1093/mnrasl/slz179
-
[28]
Ellison, S. L., Wong, T., S´ anchez, S. F., et al. 2021, MNRAS, 505, L46, doi: 10.1093/mnrasl/slab047
-
[29]
Calibration of Argus and the 4mm Receiver on the GBT
Frayer, D. T., Maddalena, R. J., White, S., et al. 2019, Calibration of Argus and the 4mm Receiver on the GBT,, Green Bank Telescope Memorandum 302, June 5, 2019, 21 pages doi: 10.48550/arXiv.1906.02307
work page internal anchor Pith review Pith/arXiv arXiv doi:10.48550/arxiv.1906.02307 2019
-
[30]
Garay-Solis, Y., Barrera-Ballesteros, J. K., Colombo, D., et al. 2023, ApJ, 952, 122, doi: 10.3847/1538-4357/acd781
-
[31]
Gensior, J., Kruijssen, J. M. D., & Keller, B. W. 2020, MNRAS, 495, 199, doi: 10.1093/mnras/staa1184
-
[32]
Genzel, R., Tacconi, L. J., Lutz, D., et al. 2015, ApJ, 800, 20, doi: 10.1088/0004-637X/800/1/20
-
[33]
2019, radio-astro-tools/spectral-cube: Release v0.4.5, v0.4.5 Zenodo, doi: 10.5281/zenodo.3558614
Ginsburg, A., Koch, E., Robitaille, T., et al. 2019, radio-astro-tools/spectral-cube: Release v0.4.5, v0.4.5 Zenodo, doi: 10.5281/zenodo.3558614
-
[34]
M., Papaderos, P., Kehrig, C., et al
Gomes, J. M., Papaderos, P., Kehrig, C., et al. 2016, A&A, 588, A68, doi: 10.1051/0004-6361/201525976
-
[35]
Gong, M., Ostriker, E. C., Kim, C.-G., & Kim, J.-G. 2020, ApJ, 903, 142, doi: 10.3847/1538-4357/abbdab SFE and Galaxy Quenching with GBT-EDGE27 Gonz´ alez Delgado, R. M., P´ erez, E., Cid Fernandes, R., et al. 2014, A&A, 562, A47, doi: 10.1051/0004-6361/201322011 Gonz´ alez Delgado, R. M., Cid Fernandes, R., P´ erez, E., et al. 2016, A&A, 590, A44, doi: 1...
-
[36]
Harris, C. R., Millman, K. J., van der Walt, S. J., et al. 2020, Nature, 585, 357, doi: 10.1038/s41586-020-2649-2
-
[37]
Heckman, T. M., & Best, P. N. 2014, ARA&A, 52, 589, doi: 10.1146/annurev-astro-081913-035722
work page internal anchor Pith review doi:10.1146/annurev-astro-081913-035722 2014
-
[38]
Hunter, J. D. 2007, Computing In Science & Engineering, 9, 90
2007
-
[39]
Kacprzak, G. G., Nielsen, N. M., Nateghi, H., et al. 2021, MNRAS, 500, 2289, doi: 10.1093/mnras/staa3461
-
[40]
Kalinova, V., Colombo, D., S´ anchez, S. F., et al. 2021, A&A, 648, A64, doi: 10.1051/0004-6361/202039896
-
[41]
Kennicutt, R. C. 1998, ApJ, 498, 541, doi: 10.1086/305588
work page internal anchor Pith review doi:10.1086/305588 1998
-
[42]
Star Formation in the Milky Way and Nearby Galaxies
Kennicutt, R. C., & Evans, N. J. 2012, ARA&A, 50, 531, doi: 10.1146/annurev-astro-081811-125610
work page internal anchor Pith review doi:10.1146/annurev-astro-081811-125610 2012
-
[43]
Kewley, L. J., Dopita, M. A., Sutherland, R. S., Heisler, C. A., & Trevena, J. 2001, ApJ, 556, 121, doi: 10.1086/321545
work page internal anchor Pith review doi:10.1086/321545 2001
-
[44]
2007, PASJ, 59, 117, doi: 10.1093/pasj/59.1.117
Kuno, N., Sato, N., Nakanishi, H., et al. 2007, PASJ, 59, 117, doi: 10.1093/pasj/59.1.117
-
[45]
Lacerda, E. A. D., S´ anchez, S. F., Cid Fernandes, R., et al. 2020, MNRAS, 492, 3073, doi: 10.1093/mnras/staa008
-
[46]
Lacerda, E. A. D., S´ anchez, S. F., Mej´ ıa-Narv´ aez, A., et al. 2022, NewA, 97, 101895, doi: 10.1016/j.newast.2022.101895
-
[47]
Zakamska, N. L., & Watts, D. J. 2019, MNRAS, 487, 1823, doi: 10.1093/mnras/stz1316
-
[48]
K., Walter, F., Sandstrom, K., et al
Leroy, A. K., Walter, F., Sandstrom, K., et al. 2013, AJ, 146, 19, doi: 10.1088/0004-6256/146/2/19
-
[49]
K., Rosolowsky, E., Usero, A., et al
Leroy, A. K., Rosolowsky, E., Usero, A., et al. 2022, ApJ, 927, 149, doi: 10.3847/1538-4357/ac3490
-
[50]
Levy, R. C., Bolatto, A. D., Teuben, P., et al. 2018, ApJ, 860, 92, doi: 10.3847/1538-4357/aac2e5
-
[51]
Lin, L., Pan, H.-A., Ellison, S. L., et al. 2019a, ApJL, 884, L33, doi: 10.3847/2041-8213/ab4815
-
[52]
2019b, ApJ, 872, 50, doi: 10.3847/1538-4357/aafa84
Lin, L., Hsieh, B.-C., Pan, H.-A., et al. 2019b, ApJ, 872, 50, doi: 10.3847/1538-4357/aafa84
-
[53]
Lin, L., Ellison, S. L., Pan, H.-A., et al. 2020, ApJ, 903, 145, doi: 10.3847/1538-4357/abba3a
-
[54]
Lin, L., Ellison, S. L., Pan, H.-A., et al. 2022, ApJ, 926, 175, doi: 10.3847/1538-4357/ac4ccc
-
[55]
Lin, L., Pan, H.-A., Ellison, S. L., et al. 2024, ApJ, 963, 115, doi: 10.3847/1538-4357/ad18b9
-
[56]
Lin, L., Wu, P.-F., Thorp, M. D., et al. 2026, ApJ, 999, 263, doi: 10.3847/1538-4357/ae3b2b
-
[57]
2022, MNRAS, 514, 5035, doi: 10.1093/mnras/stac1583
Lu, A., Boyce, H., Haggard, D., et al. 2022, MNRAS, 514, 5035, doi: 10.1093/mnras/stac1583
-
[58]
2023, ApJ, 943, 7, doi: 10.3847/1538-4357/aca664
Maeda, F., Egusa, F., Ohta, K., Fujimoto, Y., & Habe, A. 2023, ApJ, 943, 7, doi: 10.3847/1538-4357/aca664
-
[59]
2019, A&A Rv, 27, 3, doi: 10.1007/s00159-018-0112-2
Maiolino, R., & Mannucci, F. 2019, A&A Rv, 27, 3, doi: 10.1007/s00159-018-0112-2
-
[60]
2014, A&A, 570, A13, doi: 10.1051/0004-6361/201423496
Vauglin, I. 2014, A&A, 570, A13, doi: 10.1051/0004-6361/201423496
-
[62]
Mangum, J. G., Emerson, D. T., & Greisen, E. W. 2007, A&A, 474, 679, doi: 10.1051/0004-6361:20077811
-
[63]
2009, ApJ, 707, 250, doi: 10.1088/0004-637X/707/1/250
Martig, M., Bournaud, F., Teyssier, R., & Dekel, A. 2009, ApJ, 707, 250, doi: 10.1088/0004-637X/707/1/250
-
[64]
1996, Nature, 379, 613, doi: 10.1038/379613a0
Moore, B., Katz, N., Lake, G., Dressler, A., & Oemler, A. 1996, Nature, 379, 613, doi: 10.1038/379613a0
-
[65]
2019, PASJ, 71, S15, doi: 10.1093/pasj/psz015
Muraoka, K., Sorai, K., Miyamoto, Y., et al. 2019, PASJ, 71, S15, doi: 10.1093/pasj/psz015
-
[66]
2012, MNRAS, 424, 2659, doi: 10.1111/j.1365-2966.2012.21325.x
Hernquist, L. 2012, MNRAS, 421, 3127, doi: 10.1111/j.1365-2966.2012.20536.x
-
[67]
Neumann, L., Jim´ enez-Donaire, M. J., Leroy, A. K., et al. 2025, A&A, 693, L13, doi: 10.1051/0004-6361/202453208
-
[68]
Page, M. J., Symeonidis, M., Vieira, J. D., et al. 2012, Nature, 485, 213, doi: 10.1038/nature11096
-
[69]
Pan, H.-A., Lin, L., Ellison, S. L., et al. 2024, ApJ, 964, 120, doi: 10.3847/1538-4357/ad28c1
-
[70]
P., van der Werf, P., Xilouris, E., Isaak, K
Papadopoulos, P. P., van der Werf, P., Xilouris, E., Isaak, K. G., & Gao, Y. 2012, ApJ, 751, 10, doi: 10.1088/0004-637X/751/1/10
-
[71]
Peng, Y.-j., Lilly, S. J., Kovaˇ c, K., et al. 2010, ApJ, 721, 193, doi: 10.1088/0004-637X/721/1/193 P´ erez, F., & Granger, B. E. 2007, Computing in Science and Engineering, 9, 21, doi: 10.1109/MCSE.2007.53
-
[72]
Pettini, M., & Pagel, B. E. J. 2004, MNRAS, 348, L59, doi: 10.1111/j.1365-2966.2004.07591.x
-
[73]
Pilyugin, L. S., & Grebel, E. K. 2016, MNRAS, 457, 3678, doi: 10.1093/mnras/stw238
-
[74]
2023, A&A, 680, A4, doi: 10.1051/0004-6361/202143023
Querejeta, M., Pety, J., Schruba, A., et al. 2023, A&A, 680, A4, doi: 10.1051/0004-6361/202143023
-
[75]
Querejeta, M., Leroy, A. K., Meidt, S. E., et al. 2024, A&A, 687, A293, doi: 10.1051/0004-6361/202449733
-
[76]
Reid, M. J., & Dame, T. M. 2016, ApJ, 832, 159, doi: 10.3847/0004-637X/832/2/159
-
[77]
2019, A&A, 621, A104, doi: 10.1051/0004-6361/201834397 28Teng et al
Renaud, F., Bournaud, F., Daddi, E., & Weiß, A. 2019, A&A, 621, A104, doi: 10.1051/0004-6361/201834397 28Teng et al
-
[78]
Robitaille, T., Deil, C., & Ginsburg, A. 2020, reproject: Python-based astronomical image reprojection,, Astrophysics Source Code Library, record ascl:2011.023 http://ascl.net/2011.023 Rosa-Gonz´ alez, D., Terlevich, E., & Terlevich, R. 2002, MNRAS, 332, 283, doi: 10.1046/j.1365-8711.2002.05285.x
-
[79]
2006, PASP, 118, 590, doi: 10.1086/502982
Rosolowsky, E., & Leroy, A. 2006, PASP, 118, 590, doi: 10.1086/502982
-
[80]
1966, Proceedings of the IEEE, 54, 633, doi: 10.1109/PROC.1966.4784
Ruze, J. 1966, Proceedings of the IEEE, 54, 633, doi: 10.1109/PROC.1966.4784
-
[81]
2022, ARA&A, 60, 319, doi: 10.1146/annurev-astro-021022-043545
Saintonge, A., & Catinella, B. 2022, ARA&A, 60, 319, doi: 10.1146/annurev-astro-021022-043545
discussion (0)
Sign in with ORCID, Apple, or X to comment. Anyone can read and Pith papers without signing in.