REVIEW 4 major objections 6 minor 13 references
Hierarchical Bidirectional Transition Dispersion Entropy-based Lempel-Ziv Complexity and Its Application in Fault-Bearing Diagnosis
T0 review · 4 major / 6 minor · reviewed 2026-08-11 · deepseek-v4-flash
Pith's one-line read This paper introduces BT-DELZC, a Lempel-Ziv complexity measure that counts new patterns in the in-link and out-link sequences of each dispersion pattern, and reports that it outperforms LZC, PLZC, and DELZC on two fault bearing datasets.
desk verdict Genuine LZC variant with a clean definition, but the top-line accuracy claim in the bearing experiments is not backed by significance tests or a reported K value. read the letter →
The pith
A machine-rendered reading of the paper's core claim, the machinery that carries it, and where it could break.
The reading
What carries the argument
The load-bearing construction is the weighted bidirectional transition network over dispersion patterns. Each embedding vector of the time series is assigned a dispersion pattern; for every pattern, the algorithm collects the sequences of patterns that precede and follow it (excluding self-loops), computes a DELZC value on each of those two link sequences, averages them, and weights the result by the pattern's relative frequency. A hierarchical decomposition with averaging and differencing operators feeds multiple frequency components of the signal into this calculation, and PCA compresses the resulting feature vectors before classification.
What would settle it
Run the two bearing experiments under repeated stratified cross-validation over a grid of embedding dimension, class count, and hierarchical layer values, and compare the distributions of accuracy; if BT-DELZC's margin over DELZC falls within the cross-validation noise for most settings, the central claim fails.
Extended reading notes
Core claim
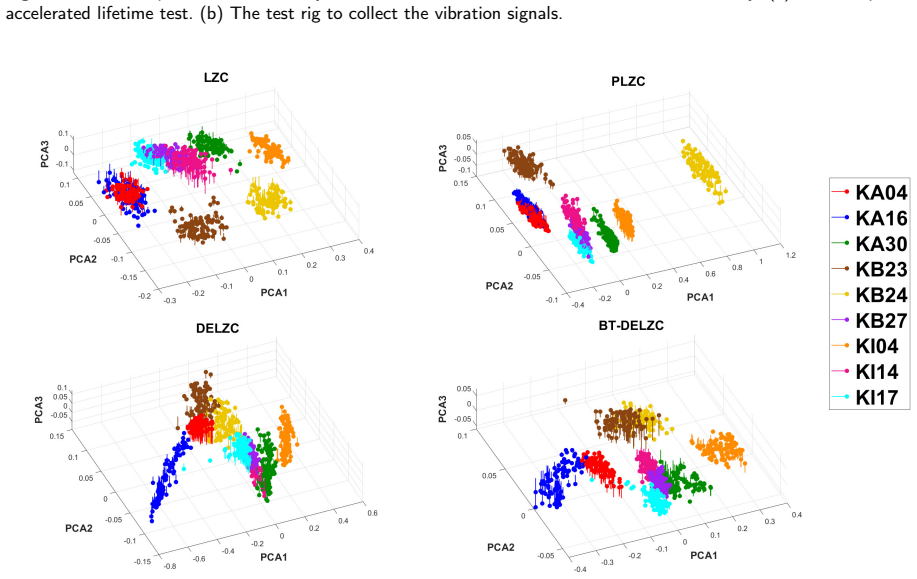
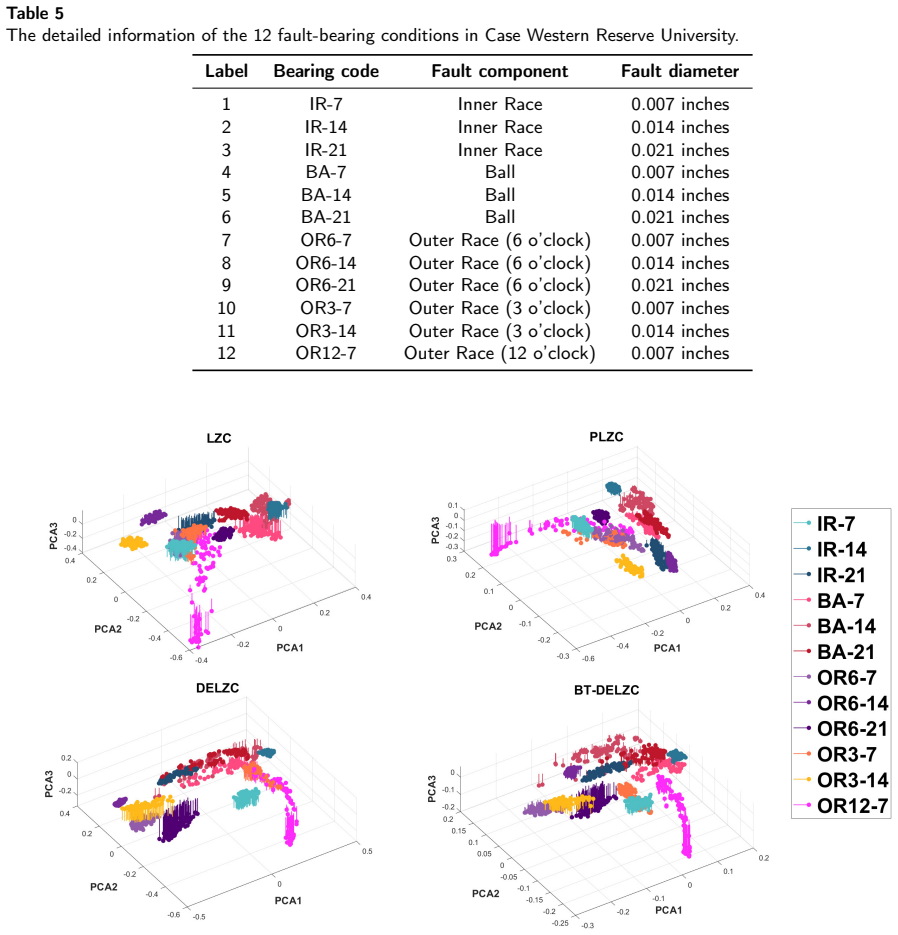
The central claim is that incorporating transition dynamics into Lempel-Ziv complexity improves feature extraction from nonlinear time series. Concretely, the paper claims that BT-DELZC outperforms LZC, PLZC, and DELZC in distinguishing chaotic from noisy signals, in tracking the frequency sweep of a chirp signal and the stochastic-to-periodic drift of a mix process, and in classifying nine fault types from one bearing benchmark and twelve from another, under KNN, decision-tree, and feedforward-neural-network classifiers, with accuracy gains of several percentage points in most comparisons.
Load-bearing premise
The results assume that the parameter settings (embedding dimension, class count, time delay, hierarchical layer) and the single 70/30 train-test split are unbiased and representative, so that the measured accuracy differences reflect genuine method performance rather than sampling noise or favourable tuning.
Editorial extensions
If this is right
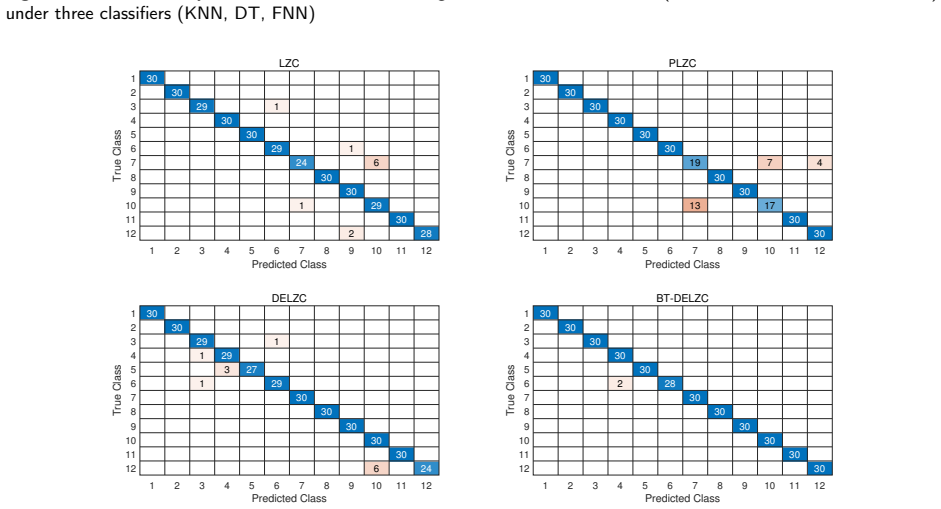
- On both real-world bearing datasets, BT-DELZC yields the highest accuracy for every classifier tested (KNN, DT, FNN), with the largest single gain over DELZC reaching about 6.7 percentage points.
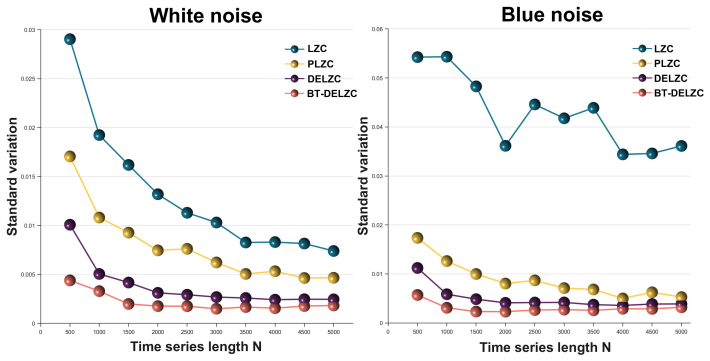
- The method separates fully chaotic logistic maps from white noise at lower signal-to-noise ratios than LZC, PLZC, or DELZC in most tested hierarchies.
- BT-DELZC tracks gradual dynamics better than the existing measures: it produces the smoothest decline in the mix process and the clearest frequency-change signal in the chirp experiment.
- Because the measure is weighted by pattern frequency, common dispersion patterns dominate the complexity value, which the authors argue makes the measure more stable across noise realisations.
- The hierarchical decomposition stage multiplies the number of features per sample, and the paper shows that classification accuracy stays high across different numbers of PCA components.
Reading between the lines
- The same bidirectional transition construction could be applied to permutation-based LZC or other symbolisation schemes, not just dispersion patterns; the paper does not test these alternatives.
- Excluding self-loops may change the complexity estimate for highly repetitive or strongly chaotic signals; the paper flags this as future work but does not quantify the effect.
- The accuracy results rest on a single 70/30 train-test split per dataset; repeated stratified cross-validation across parameter choices would show whether the reported margin is stable.
- If the embedding dimension, class count, time delay, and hierarchical layer were tuned per dataset, part of the reported advantage could come from that tuning rather than from the transition network itself.
Signed reviews
Editorial analysis
A structured set of objections, weighed in public.
Referee Report
Summary. The paper proposes BT-DELZC, a Lempel-Ziv complexity variant that combines dispersion-pattern-based DELZC with a weighted bidirectional transition network, and appends hierarchical decomposition to extract multi-frequency features. The method is evaluated on four simulated experiments (parameter analysis, robustness to noise, chirp signals, and a mix process) and on two public fault-bearing datasets (Paderborn University and Case Western Reserve University) using KNN, decision tree, and feedforward neural network classifiers. The authors report that BT-DELZC consistently yields the highest accuracy among LZC, PLZC, DELZC, and BT-DELZC, and claim that it 'significantly outperforms' the existing methods.
Significance. If the empirical claims are substantiated, BT-DELZC would be a useful addition to the family of Lempel-Ziv complexity measures, particularly for bearing fault diagnosis, and the combination of transition networks with LZC is a reasonable novelty. The paper has several strengths: the algorithm is defined step-by-step in Section 2.3; the simulated experiments include quantitative robustness checks with repeated samples and Wilcoxon rank-sum tests; and the real-world evaluation uses two standard public benchmark datasets and multiple classifiers. These strengths make the paper a candidate for publication after the evaluation protocol is made statistically rigorous and the reporting of experimental settings is completed.
major comments (4)
- [Section 4.2, Tables 3–4; Section 4.3, Table 6] The central claim that BT-DELZC 'significantly outperforms' LZC, PLZC, and DELZC is not supported by any statistical test. All reported accuracy rates in Tables 3, 4, and 6 are point estimates from a single 70/30 split. With only 270 (PU) or 360 (CWRU) test samples, split-to-split variance can be substantial, and the margins over the best baseline in some cases are small (e.g., CWRU KNN: 99.72% vs. 98.61%). The authors should report repeated random splits or k-fold cross-validation with means, standard deviations or confidence intervals, and apply a paired test such as McNemar's test between BT-DELZC and each baseline. Without this, the word 'significantly' in the abstract and conclusion is not justified.
- [Section 4.1, Step 2; Sections 4.2 and 4.3] The hierarchical layer K is never specified for the real-world experiments. Section 4.1, Step 2 says 'according to the selected layer K', but Sections 4.2 and 4.3 do not state the K value used; the number of features fed into PCA depends on K. This makes the experimental results irreproducible and leaves open the possibility that K was chosen favorably. The authors must report K for both datasets and, ideally, provide a sensitivity analysis over K (e.g., K = 2, 3, 4) to demonstrate that the reported accuracies are not an artifact of this choice.
- [Eq. (17) and the surrounding text] The hierarchical decomposition matrix in Eq. (17) is dimensionally inconsistent with the stated scale. The text claims that 'the scale of Q_K^ε becomes N - 2^K + 1 × N - 2^{K-1} + 1', but composing the operators in Eq. (16) K times should yield an (N-K)×N matrix (or similar, depending on the alignment convention), not the dimensions given. For K=2, the claimed scale would be (N-3)×(N-1), which does not match the result of applying two operators to X. Please clarify the exact construction of Q_K^ε, correct the matrix and dimension statement, and provide the precise matrix form used in the experiments.
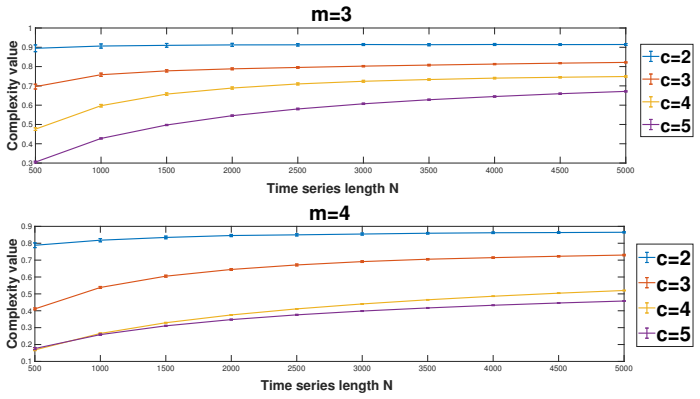
- [Sections 4.2 and 4.3] The parameters (m,c) differ between the two datasets (PU: m=3, c=5; CWRU: m=4, c=4) without a systematic justification or sensitivity analysis. While the same parameters are used for all methods within each dataset, the per-dataset choice must be shown not to favor BT-DELZC. The authors should provide a sensitivity study (e.g., a grid over m in {3,4,5} and c in {3,4,5}) on at least one dataset to demonstrate that the reported performance advantage is robust to parameter settings rather than a result of per-dataset tuning.
minor comments (6)
- [Table 6 caption] The table header reads 'DETLZC' instead of 'BT-DELZC'; please correct the typo.
- [After Eq. (18)] The statement 'Consequently, ∑_{j=1}^K 2^j components including the original time series X, can be obtained' is mathematically inconsistent: the sum equals 2^{K+1}-2, and including X gives 2^{K+1}-1 components. Please rephrase to accurately count the components.
- [Section 2.3, Step 2] The index range for dispersion patterns is stated as 'i = 2, 3, ..., N − 1', but the actual range should account for the embedding dimension and delay, i.e., i = 2, ..., N − (m−1)τ − 1, as used in Eq. (14). Please correct for consistency.
- [Table 1] The entries '**' are not defined in the table or caption, and the caption contains a typo ('statictical'). Please define the meaning of '**' and correct the typo.
- [Section 2.2.1] The reference to Bandt and Pompe appears as 'Bandt and Pompe[]' with an empty bracket; please insert the proper citation.
- [Section 5] The paper claims 'the first attempt to integrate transition network methods with LZC approaches.' The authors should verify that no prior work combines transition networks (even without the bidirectional weighting) with LZC-based metrics, and temper the claim if any exists.
Circularity Check
No significant circularity: BT-DELZC is a definitional composition of DELZC and transition links, evaluated on external benchmarks; observed weaknesses are evaluation-validity issues, not circular reductions.
full rationale
The derivation of BT-DELZC is self-contained and definitional. Equation (15) defines BT-DELZC as a weighted sum of DELZC values computed on in-link and out-link sequences of each dispersion pattern, where the DELZC values are obtained by the standard LZC counting procedure applied to those link sequences. No parameter of this construction is fitted to the classification labels in the real-data experiments. The simulated experiments in Sections 3.2-3.4 compare the new measure with LZC, PLZC, and DELZC on externally generated white noise, blue noise, chaotic logistic maps, chirp signals, and mix processes, which are independent benchmarks. The bearing experiments use public Paderborn University and Case Western Reserve University datasets with standard classifiers, and while the paper reports the highest accuracies for BT-DELZC, the claim of 'significantly outperforming' is not supported by repeated resampling or significance testing. Likewise, the dataset-specific (m,c) choices and the unreported hierarchical layer K are reproducibility and robustness concerns, not circularity. No step in the paper reduces a predicted or derived result to a fitted input or to a load-bearing self-citation chain, so per the hard rules no circular step is identified.
Assumptions & free parameters
free parameters (6)
- embedding dimension m =
3 (PU), 4 (CWRU/simulation)
- number of dispersion classes c =
5 (PU), 4 (CWRU/simulation)
- time delay tau =
2
- hierarchical layer K =
3 in simulation; unspecified in real experiments
- PCA feature count =
3 (also 2 to 6 in one ablation)
- train/test split ratio =
70/30
assumptions (5)
- standard math The LZC normalization C* ~ N/log_M(N) is a valid finite-sample approximation for the in-link and out-link sequences.
- domain assumption Adjacent dispersion patterns carry the relevant dynamic information, modeled as Markov transitions.
- standard math The hierarchical decomposition operators Q0 and Q1 extract meaningful low- and high-frequency components.
- domain assumption The NCDF-based dispersion symbolization preserves signal information relevant to complexity.
- domain assumption The 100 randomly sampled windows per fault class are representative, and the classifiers are treated as reliable black boxes.
Cite this review
Pith. "Pith review of Hierarchical Bidirectional Transition Dispersion Entropy-based Lempel-Ziv Complexity and Its Application in Fault-Bearing Diagnosis." pith.science (2026). https://pith.science/paper/QDJS3OUL
@misc{pith2026241211123,
  author       = {Pith},
  title        = {Pith review of: Hierarchical Bidirectional Transition Dispersion Entropy-based Lempel-Ziv Complexity and Its Application in Fault-Bearing Diagnosis},
  year         = {2026},
  howpublished = {\url{https://pith.science/paper/QDJS3OUL}},
  note         = {Machine review of arXiv:2412.11123}
}
read the original abstract
Lempel-Ziv complexity (LZC) is a key measure for detecting the irregularity and complexity of nonlinear time series and has seen various improvements in recent decades. However, existing LZC-based metrics, such as Permutation Lempel-Ziv complexity (PLZC) and Dispersion-Entropy based Lempel-Ziv complexity (DELZC), focus mainly on patterns of independent embedding vectors, often overlooking the transition patterns within the time series. To address this gap, this paper introduces a novel LZC-based method called Bidirectional Transition Dispersion Entropy-based Lempel-Ziv complexity (BT-DELZC). Leveraging Markov chain theory, this method integrates a bidirectional transition network framework with DELZC to better capture dynamic signal information. Additionally, an improved hierarchical decomposition algorithm is used to extract features from various frequency components of the time series. The proposed BT-DELZC method is first evaluated through four simulated experiments, demonstrating its robustness and effectiveness in characterizing nonlinear time series. Additionally, two fault-bearing diagnosis experiments are conducted by combining the hierarchical BT-DELZC method with various classifiers from the machine learning domain. The results indicate that BT-DELZC achieves the highest accuracy across both datasets, significantly outperforming existing methods such as LZC, PLZC, and DELZC in extracting features related to fault bearings.
Figures


Figures from the paper (16 more)





Reference graph
Works this paper leans on
-
[31]
Huang,N.E.,Shen,Z.,Long,S.R.,Wu,M.C.,Shih,H.H.,Zheng,Q.,Yen,N.C.,Tung,C.C.,Liu,H.H.,1998.Theempiricalmodedecompositionand thehilbertspectrumfornonlinearandnon-stationarytimeseriesanalysis. ProceedingsoftheRoyalSocietyofLondon.SeriesA:mathematical, physical and engineering sciences 454, 903–995. Jiang,R.,Shang,P.,2024. Dispersioncomplexity–entropycurves:An...
work page 1998
-
[1976]
IEEE Transactions on information theory 22, 75–81
On the complexity of finite sequences. IEEE Transactions on information theory 22, 75–81. Lessmeier,C.,Kimotho,J.K.,Zimmer,D.,Sextro,W.,2016. Conditionmonitoringofbearingdamageinelectromechanicaldrivesystemsbyusing motor current signals of electric motors: A benchmark data set for data-driven classification, in: PHM Society European Conference. Li,G.,Liu,...
work page 2016
-
[2002]
Physical review letters 88, 174102
Permutation entropy: a natural complexity measure for time series. Physical review letters 88, 174102. Borowska,M.,2021. Multiscalepermutationlempel–zivcomplexitymeasureforbiomedicalsignalanalysis:Interpretationandapplicationtofocal eeg signals. Entropy 23,
work page 2021
-
[2005]
Physical Review E—Statistical, Nonlinear, and Soft Matter Physics 71, 021906
Multiscale entropy analysis of biological signals. Physical Review E—Statistical, Nonlinear, and Soft Matter Physics 71, 021906. Ding,L.,Ji,J.,Li,Y.,Wang,S.,Noman,K.,Feng,K.,2023. Anovelweakfeatureextractionmethodforrotatingmachinery:linkdispersionentropy. IEEE Transactions on Instrumentation and Measurement . Ferrario,M.,Signorini,M.G.,Magenes,G.,Cerutti...
work page 2023
-
[2006]
IEEE transactions on biomedical engineering 53, 2282–2288
Interpretation of the lempel-ziv complexity measure in the context of biomedical signal analysis. IEEE transactions on biomedical engineering 53, 2282–2288. Azami,H.,Fernández,A.,Escudero,J.,2017. Refinedmultiscalefuzzyentropybasedonstandarddeviationforbiomedicalsignalanalysis. Medical & biological engineering & computing 55, 2037–2052. Bai, Y., Liang, Z....
work page 2017
-
[2012]
Physica A: Statistical Me- chanics and its Applications 391, 5739–5745
Multifractal diffusion entropy analysis on stock volatility in financial markets. Physica A: Statistical Me- chanics and its Applications 391, 5739–5745. URL:https://www.sciencedirect.com/science/article/pii/S0378437112005432, doi:https://doi.org/10.1016/j.physa.2012.06.039. Huang,M.,Sun,Z.,Donner,R.V.,Zhang,J.,Guan,S.,Zou,Y.,2021. Characterizingdynamical...
-
[2013]
Complex networks from time series: Capturing dynamics, in: 2013 IEEE International Symposium on Circuits and Systems (ISCAS), IEEE. pp. 2509–2512. Smith, W.A., Randall, R.B.,
work page 2013
-
[2015]
Mechanical Systems and Signal Processing 64-65, 100–131
Rolling element bearing diagnostics using the case western reserve university data: A benchmark study. Mechanical Systems and Signal Processing 64-65, 100–131. doi:https://doi.org/10.1016/j.ymssp.2015.04.021. Jiang: Preprint submitted to Elsevier Page 20 of 21 Wang, Z., Shang, P., Shang, B.,
Show all 13 references
-
[2016]
IEEE Signal Processing Letters 23, 610–614
Dispersion entropy: A measure for time-series analysis. IEEE Signal Processing Letters 23, 610–614. Rostaghi,M.,Khatibi,M.M.,Ashory,M.R.,Azami,H.,2021. Fuzzydispersionentropy:Anonlinearmeasureforsignalanalysis. IEEETransactions on Fuzzy Systems 30, 3785–3796. Shang,B.,Shang,P....
2021
-
[2019]
Knowledge-Based Systems 163, 450–471
Intelligent fault diagnosis of rotating machinery using improved multiscale dispersion entropy and mrmr feature selection. Knowledge-Based Systems 163, 450–471. Zhang,B.,Shang,P.,2021. Transitionpermutationentropyandtransitiondissimilaritymeasure:Efficienttoolsforfaultdetectio...
2021
-
[2020]
Nonlinear Dynamics 100, 803–829
Global recurrence quantification analysis and its application in financial time series. Nonlinear Dynamics 100, 803–829. doi:https://doi.org/10.1007/s11071-020-05543-4. Huang, J., Shang, P., Zhao, X.,
-
[2021]
Journal of Mechanical Science and Technology 35, 1993–2005
Roller bearing fault diagnosis based on lmd and multi-scale symbolic dynamic information entropy. Journal of Mechanical Science and Technology 35, 1993–2005. He, J., Shang, P., Zhang, Y.,
1993
-
[2022]
Process Safety and Environmental Protection 164, 857–867
Natural gas pipeline leak diagnosis based on improved variational modal decomposition and locally linear embedding feature extraction method. Process Safety and Environmental Protection 164, 857–867. Mallat,S.G.,1989.Atheoryformultiresolutionsignaldecomposition:thewaveletrepre...
1989
Reviewed August 11, 2026 · model on record in the stance chip above.
Discussion (0). Continue with ORCID to comment.