REVIEW 3 major objections 5 minor 106 references
Beta Pic b, a young super-Jupiter, rotates once every 9.00 ± 0.13 hours, and its spin appears aligned with its star, disk, and orbit.
Reviewed by Pith at T0; open to challenge. T0 means a machine referee read the full paper against a public rubric. the ladder, T0–T4 →
T0 review · deepseek-v4-flash
2026-08-02 06:07 UTC pith:RYHSCZSL
load-bearing objection A credible first detection of rotational modulation in a close-in imaged exoplanet, with the paper's own caveat quietly contradicting its core-accretion headline. the 3 major comments →
Photometric Variability and Rotation of Beta Pictoris b from JWST NIRCam Coronagraphic Imaging
The pith
A machine-rendered reading of the paper's core claim, the machinery that carries it, and where it could break.
Core claim
The paper reports the detection of coherent, sinusoidal photometric variability in β Pictoris b from 16 hours of JWST NIRCam dual-band coronagraphic imaging. In the F210M and F410M filters, the detrended light curves vary with periods of 9.08 ± 0.24 hr and 8.96 ± 0.10 hr; a joint fit gives a rotation period of 9.00 ± 0.13 hr and amplitudes of 0.85 ± 0.07% and 0.89 ± 0.04%. The near-identical period and amplitude in two bands that probe similar pressure levels are taken as evidence of a common astrophysical origin in a heterogeneous atmosphere rotating with the planet. Combining this period with a projected rotational velocity of about 19.9 km/s and a radius prior of about 1.4 Jupiter radii y
What carries the argument
The central mechanism is time-series coronagraphic photometry that isolates the planet's light from starlight, disk emission, and instrumental drifts. PSF subtraction using reference-star and angular differential imaging removes the stellar halo; principal component analysis of comparison apertures at the same separation but different position angles builds a systematic-noise model; injection-and-recovery tests show the pipeline neither creates nor destroys the signal. The load-bearing identity is the geometric relation connecting rotation period, radius, and projected spin speed: v sin i = 2π R / P_rot. Matching the measured spin speed with the equatorial speed implied by a 9-hour period an
Load-bearing premise
The edge-on spin and core-accretion conclusions assume a specific planet radius (about 1.4 Jupiter radii) and that the literature spin speed truly reflects rigid rotation; if the radius is about 10% larger, the data no longer force an equator-on geometry.
What would settle it
Re-observe β Pic b over several full rotations in a later epoch. If the ~9-hour period is not reproduced, or if the F210M and F410M light curves stop matching in period or phase, the rotation-modulation interpretation collapses. Alternatively, an independent radius estimate below about 1.25 Jupiter radii, or a revised spin speed above the value assumed here, would make the implied equatorial speed exceed the observed projected spin speed, falsifying the equator-on geometry.
If this is right
- If the variability is rotation modulation, β Pic b has a roughly 9-hour day and sub-percent patchy cloud or spot structure at the pressures probed by 2–4 µm light.
- The measured spin-axis inclination is consistent with alignment among the planet's spin, its orbit, the debris disk, and the stellar spin, placing β Pic b in a different obliquity class from the widely misaligned wide-orbit companions.
- The authors caution that the full three-dimensional obliquity cannot be constrained without the sky-plane position angle of the spin axis, so only line-of-sight alignment is established.
- The demonstrated sub-percent precision over 16 hours makes time-series coronagraphic imaging a viable way to measure rotation periods and possibly search for exomoons or post-impact oscillations in directly imaged planets.
- The true period uncertainty may be larger than the formal ±0.13 hr because atmospheric evolution can distort a single-epoch light curve; the paper's waveform-recovery tests broaden the plausible range to roughly 8.5–9.4 hr.
Where Pith is reading between the lines
- Editorial inference: the equator-on conclusion leans heavily on the adopted 1.4-Jupiter-radius prior; if the radius were 10% larger, the implied equatorial speed would rise to about 21.4 km/s and the best-fit inclination would drop to roughly 68°, so the alignment story is only as strong as the radius assumption.
- Editorial inference: a single 16-hour epoch cannot distinguish a rigidly rotating patchy atmosphere from a wave-like pattern that drifts in time; repeated monitoring would test whether the 9-hour period is stable.
- Editorial inference: applying the same observational method to a statistical sample of directly imaged planets could turn obliquity into a population-level test between bottom-up and top-down formation, since the two formation pathways predict different spin-orbit distributions.
- Editorial inference: the near-equal amplitudes at 2 and 4 µm may indicate that both bands probe similar cloud layers; adding a band that straddles the cloud base would help identify whether clouds or magnetic spots drive the modulation.
Editorial analysis
A structured set of objections, weighed in public.
Referee Report
Summary. The paper presents a 16-hour JWST NIRCam dual-band coronagraphic monitoring campaign of the directly imaged super-Jupiter β Pic b, using the F210M and F410M filters. The authors develop a time-series photometry framework combining PSF subtraction, PCA-based systematic-noise removal, and injection-and-recovery validation. They report coherent sinusoidal variability in both bands, with a joint rotation period of P_rot = 9.00 ± 0.13 hr and semi-amplitudes of 0.85 ± 0.07% (F210M) and 0.89 ± 0.04% (F410M). They further combine P_rot with literature vsini and radius estimates to derive a line-of-sight spin-axis inclination, finding i_p ≈ 90°, which they interpret as evidence for spin-orbit alignment and, ultimately, for core-accretion formation of β Pic b.
Significance. If the variability detection holds, this is the first detection of rotational modulation in a close-in, directly imaged exoplanet, and it demonstrates that JWST NIRCam coronagraphic time-series photometry can reach sub-percent precision — a genuinely new observational capability. The paper's validation strategy is a strength: the forced-flat model (Section 4.1), multi-position-angle injection-and-recovery (Section 4.2), pixel-level PCA (Section 4.3), and independent validation apertures (Section 3.4) together provide strong evidence that the signal is not a pure systematic artifact. The rotation-period measurement itself is plausible and carefully caveated in Section 5.1. However, the obliquity and formation conclusions are not supported by the data. The paper's own Section 5.2 states that the true three-dimensional obliquity ψ is unconstrained because the sky-plane position angle of the spin axis is unmeasurable; despite this, the Abstract and Section 6 claim that the planetary spin axis, orbit, debris disk, and stellar equator are 'all mutually aligned' and that the observation provides 'independent dynamical evidence' for core accretion. This is a logical gap between the caveat
major comments (3)
- [§5.2, Abstract, §6] The paper contains an internal inconsistency. Section 5.2 explicitly states: 'We caution that the true three-dimensional obliquity ψ cannot be constrained from the available data... Marginalizing over Ω_spin uniformly leaves ψ unconstrained.' Yet the Abstract and Section 6 assert that 'the planetary spin axis, orbital plane, debris disk, and stellar equator are all mutually aligned' and that the result 'provides independent dynamical evidence that β Pic b formed via core accretion.' For two vectors both lying near the plane of the sky (i_p ≈ i_orbit ≈ 90°), the actual angle between them is dominated by the unmeasured sky-plane position angle difference; the data only rule out spin axes pointing near the line of sight. The alignment and formation statements must be removed or reduced to a line-of-sight-only statement, in line with the paper's own caveat.
- [§5.2, Figure 15] The claim that the data 'strongly favor' an equator-on viewing geometry is largely a prior-boundary effect. With the adopted radius R ~ N(1.4, 0.1) R_Jup and P_rot = 9.00 hr, the implied v_eq = 2πR/P ≈ 19.4 km/s, essentially equal to the adopted vsini = 19.9 ± 1.0 km/s, so the posterior piles up at sini = 1 by construction. The alternative vsini values (22 ± 2 and 25 ± 3 km/s) formally exceed v_eq and can only be accommodated by boundary mass. A 10% larger radius (1.54 R_Jup) would give i_p ≈ 68°. Please show the sensitivity of the inclination posterior to the radius prior (e.g., uniform R over 1.2–1.6 R_Jup) and to a joint treatment of the three vsini measurements; otherwise the 'strongly favoring' wording is not justified.
- [§5.2, §6] The formation-pathway conclusion is not supported even under the paper's own assumptions. A line-of-sight inclination consistent with the orbit does not measure the obliquity ψ, so the 'stark contrast' with the large obliquities of wide-orbit companions is not established. The claim of 'independent dynamical evidence for core accretion' overreaches: a small projected obliquity is consistent with core accretion but does not discriminate among formation scenarios, since other mechanisms (e.g., disk-driven alignment or tidal realignment) can also produce alignment. The conclusion should be reframed as 'consistent with' rather than 'evidence for,' and the caveat about the unobservable Ω_spin should be carried through to the Abstract and Section 6.
minor comments (5)
- [Abstract, §4.1] The Abstract reports '~5σ and ≫5σ significance' for the two bands, but the forced-flat model test in Section 4.1 yields only >3σ for F210M (reduced χ² = 1.15, p = 4.7×10⁻⁶). Please quote the range of significance across tests, or state the detection as 'moderately strong' rather than a single 5σ value.
- [Abstract, §5.1] The quoted period uncertainty of ±0.13 hr is explicitly acknowledged in Section 5.1 as likely underestimated due to waveform mismatch; the injection-recovery for multi-sine waveforms broadens the 16th–84th percentile range to 8.47–9.41 hr. The Abstract and Conclusions should carry this caveat or report the broader range, rather than presenting 9.00 ± 0.13 hr as the definitive rotation period.
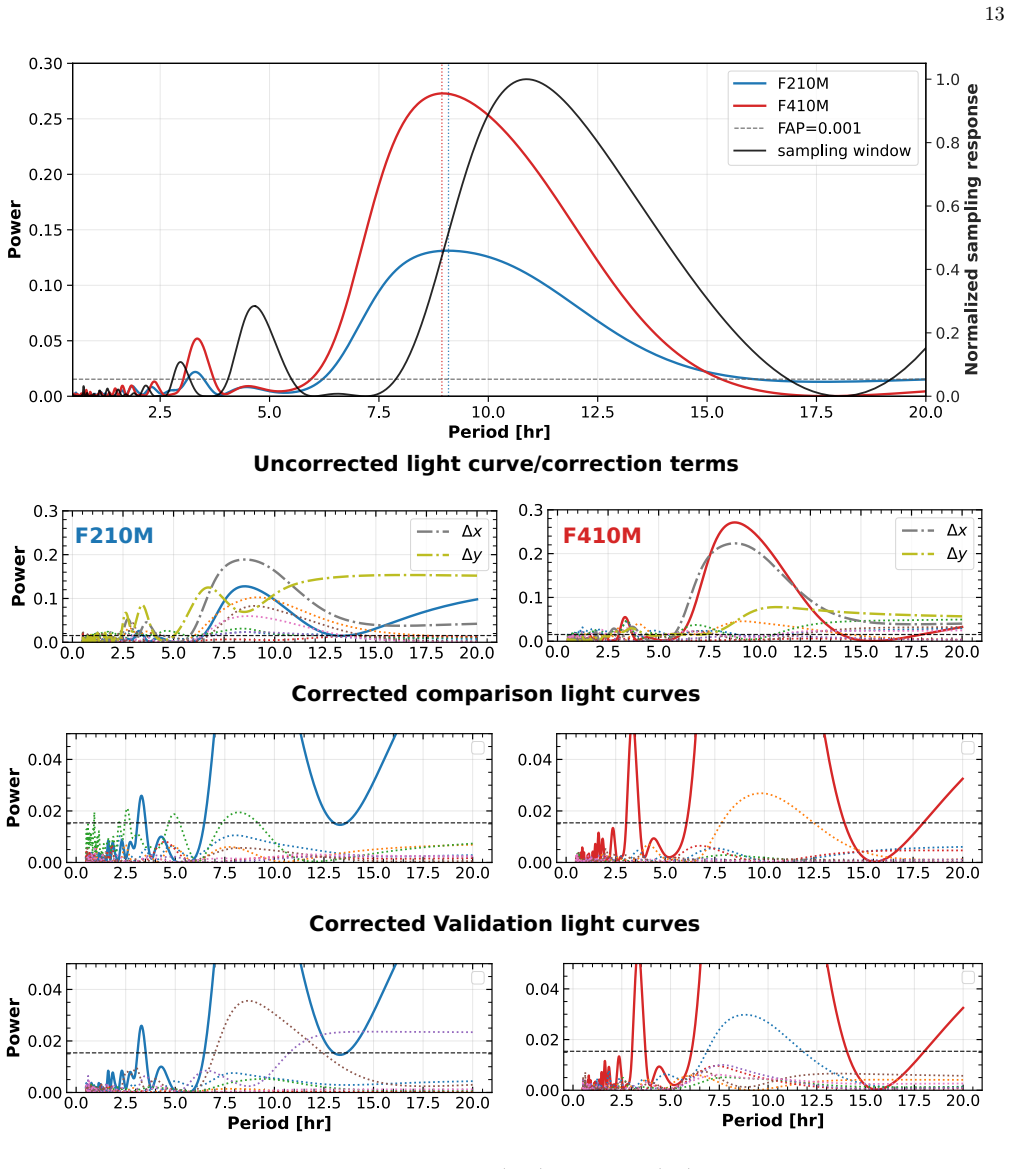
- [§3.5, Figure 10] The periodogram of the Δx centroid offset shows 'substantial power' near the detected planetary period. The paper notes this in the text, but the figure and discussion would benefit from a quantitative comparison of the Δx periodogram peak height and the planetary peak, and from an explicit statement of the amount of signal that survives after including centroid terms in Equation (2).
- [§5.2, Figure 15] The right panel of Figure 15 is labeled 'Line-of-sight obliquity |i_p − i_o| versus semimajor axis.' This quantity is a lower bound on the true obliquity; the figure should state this clearly and avoid using the term 'obliquity' without qualification, since the paper correctly argues that ψ is unconstrained.
- [§3.3, Equation (1)] The planet contribution fraction c_i is defined as a visit-average quantity, but the forward-modeled PSF is applied with a roll-angle orientation that changes between Roll 1 and Roll 2. Please clarify how the time-dependent PSF orientation is incorporated in the aperture photometry and whether c_i is recomputed for each roll.
Circularity Check
No significant circularity: the variability and obliquity derivations propagate independent inputs; the spin-alignment conclusion overreaches but does not reduce to its inputs.
full rationale
The paper's central result is an observational measurement: sinusoidal fits to the JWST NIRCam light curves yield P_rot = 9.00 +/- 0.13 hr and amplitudes in F210M/F410M. These are fitted quantities, validated by independent injection-and-recovery tests, validation apertures, pixel-level PCA, and forced-flat tests; no prediction is equivalent to a fitted input by construction. The obliquity step combines this externally fitted P_rot with literature vsini values and a radius prior through the Masuda & Winn (2020) formula; the resulting i_p posterior is a propagation of independent inputs, not a renaming of any input. Self-citations to the spaceKLIP pipeline and earlier brown-dwarf variability studies are contextual and not load-bearing for the detection. The paper explicitly cautions in Section 5.2 that the true 3D obliquity psi cannot be constrained because Omega_spin is unobservable, yet the Abstract and Conclusions claim mutual alignment and 'independent dynamical evidence' for core accretion; this is an inferential overreach (correctness risk), not circularity, because no derived quantity is assumed in its own derivation. Under the hard rule that circularity requires a quotable reduction, no such step exists here.
Axiom & Free-Parameter Ledger
free parameters (6)
- P_rot (joint sinusoid period) =
9.00 ± 0.13 hr
- F210M semi-amplitude A =
0.85 ± 0.07%
- F410M semi-amplitude A =
0.89 ± 0.04%
- Per-aperture systematic weights (w0, wx, wy, w1–w3) =
6 parameters per light curve
- Host-star oscillation amplitudes and GP hyperparameters =
8 sinusoid coefficients + 3 GP hyperparameters
- Planet radius prior R =
N(1.4, 0.1) R_Jup (adopted from Landman et al. 2024)
axioms (6)
- domain assumption Linear decomposition of aperture flux (Eq. 1): F_i = [(1−c_i)·F_star + c_i·F_planet]·S_sys,i + ϵ_i
- ad hoc to paper Sinusoidal planet light-curve model (Eq. 3)
- domain assumption Stellar oscillation frequencies fixed at the four Zieba et al. 2019 modes (P = 0.5049, 0.5284, 0.4835, 0.4424 hr)
- domain assumption Literature vsini values (Snellen 2014: 25±3; Parker 2024: 22±2; Landman 2024: 19.9±1.0 km/s) and the radius prior R ~ N(1.4, 0.1) R_Jup
- standard math Statistical machinery: Lomb-Scargle FAP (Baluev 2008), χ² with empirically estimated per-point noise, MCMC posteriors
- domain assumption The ~9 hr photometric period equals the solid-body rotation period, with sub-percent modulation from rotating heterogeneous atmospheric structures
read the original abstract
We report the detection of photometric variability in the directly imaged super-Jupiter $\beta$ Pictoris b. Using JWST NIRCam dual-band coronagraphic imaging, we conducted a 16-hour continuous photometric monitoring campaign in the F210M and F410M filters. We developed and validated a time-series photometry framework that combines PSF subtraction, principal component analysis for systematic noise removal, and injection-and-recovery tests to confirm signal fidelity. Both light curves show consistent sinusoidal variability at $\sim$5$\sigma$ and $\gg 5\sigma$ significance in the F210M and F410M bands, respectively. A joint sinusoidal fit yields a rotation period of $P_{\rm rot} = 9.00 \pm 0.13$ hr and variability amplitudes of $0.85 \pm 0.07\%$ and $0.89 \pm 0.04\%$ in F210M and F410M, respectively. The near-identical amplitudes and periods in both bands confirm a common astrophysical origin in a heterogeneous atmosphere. Combining $P_{\rm rot}$ with the previously measured projected rotational velocity, we constrain the line-of-sight spin axis inclination of $\beta$ Pic b. The result favors an equator-on viewing geometry, consistent with line-of-sight spin-orbit alignment: the planetary spin axis, orbital plane, debris disk, and stellar equator are all mutually aligned. This stands in sharp contrast to the large obliquities of wide-separation companions that are likely formed via gravitational fragmentation. Together with the system's young age, this observation provides independent dynamical evidence that $\beta$ Pic b formed via core accretion. This result constitutes the first detection of rotational modulation in a close-in, high-contrast exoplanet that likely formed via core accretion, demonstrating that time-series coronagraphic imaging with JWST opens a powerful new window onto the rotation, atmospheric dynamics, and spin-orbit architecture of this population.
Figures




Reference graph
Works this paper leans on
-
[1]
2023, PASP, 135, 075001, doi: 10.1088/1538-3873/acd7a3
Albert, L., Lafreni` ere, D., Ren´ e, D., et al. 2023, PASP, 135, 075001, doi: 10.1088/1538-3873/acd7a3
-
[2]
Alderson, L., Wakeford, H. R., Alam, M. K., et al. 2023, Nature, 614, 664, doi: 10.1038/s41586-022-05591-3
-
[3]
Apai, D., Nardiello, D., & Bedin, L. R. 2021, ApJ, 906, 64, doi: 10.3847/1538-4357/abcb97
-
[4]
2013, ApJ, 768, 121, doi: 10.1088/0004-637X/768/2/121
Apai, D., Radigan, J., Buenzli, E., et al. 2013, ApJ, 768, 121, doi: 10.1088/0004-637X/768/2/121
-
[5]
2016, ApJ, 820, 40, doi: 10.3847/0004-637X/820/1/40
Apai, D., Kasper, M., Skemer, A., et al. 2016, ApJ, 820, 40, doi: 10.3847/0004-637X/820/1/40
-
[6]
Apai, D., Karalidi, T., Marley, M. S., et al. 2017, Science, 357, 683, doi: 10.1126/science.aam9848 Astropy Collaboration, Price-Whelan, A. M., et al. 2022, ApJ, 935, 167, doi: 10.3847/1538-4381/ac7c74
-
[7]
Baluev, R. V. 2008, MNRAS, 385, 1279, doi: 10.1111/j.1365-2966.2008.12689.x
arXiv 2008
-
[8]
2018, AJ, 155, 178, doi: 10.3847/1538-3881/aab54e
Batygin, K. 2018, AJ, 155, 178, doi: 10.3847/1538-3881/aab54e
-
[9]
A., Vos, J., Buenzli, E., et al
Biller, B. A., Vos, J., Buenzli, E., et al. 2018, AJ, 155, 95, doi: 10.3847/1538-3881/aaa5a6
-
[10]
A., Apai, D., Bonnefoy, M., et al
Biller, B. A., Apai, D., Bonnefoy, M., et al. 2021, MNRAS, 503, 743, doi: 10.1093/mnras/stab202
-
[11]
Biller, B. A., Vos, J. M., Zhou, Y., et al. 2024, MNRAS, 532, 2207, doi: 10.1093/mnras/stae1602
-
[12]
2013, A&A, 555, A107, doi: 10.1051/0004-6361/201220838
Bonnefoy, M., Boccaletti, A., Lagrange, A.-M., et al. 2013, A&A, 555, A107, doi: 10.1051/0004-6361/201220838
-
[13]
Bowler, B. P., Zhou, Y., Morley, C. V., et al. 2020, ApJL, 893, L30, doi: 10.3847/2041-8213/ab8197
-
[14]
Brandt, T. D. 2024a, PASP, 136, 045005, doi: 10.1088/1538-3873/ad38da
-
[15]
Brandt, T. D. 2024b, PASP, 136, 045004, doi: 10.1088/1538-3873/ad38d9
-
[16]
Bowler, B. P. 2021, AJ, 162, 217, doi: 10.3847/1538-3881/ac1bb1
-
[17]
Bryan, M. L., Chiang, E., Bowler, B. P., et al. 2020, AJ, 159, 181, doi: 10.3847/1538-3881/ab76c6 24
-
[18]
2025, spaceKLIP: JWST coronagraphy data data reduction and analysis pipeline,, Astrophysics Source Code Library, record ascl:2502.014 http://ascl.net/2502.014
Carter, A., Kammerer, J., Leisenring, J., et al. 2025, spaceKLIP: JWST coronagraphy data data reduction and analysis pipeline,, Astrophysics Source Code Library, record ascl:2502.014 http://ascl.net/2502.014
2025
-
[19]
L., Hinkley, S., Kammerer, J., et al
Carter, A. L., Hinkley, S., Kammerer, J., et al. 2023, ApJL, 951, L20, doi: 10.3847/2041-8213/acd93e
-
[20]
2018, ApJ, 854, 172, doi: 10.3847/1538-4357/aaac7d
Charnay, B., B´ ezard, B., Baudino, J.-L., et al. 2018, ApJ, 854, 172, doi: 10.3847/1538-4357/aaac7d
-
[21]
Chen, X., Biller, B. A., Tan, X., et al. 2025, MNRAS, 539, 3758, doi: 10.1093/mnras/staf737
-
[22]
Chilcote, J., Pueyo, L., De Rosa, R. J., et al. 2017, AJ, 153, 182, doi: 10.3847/1538-3881/aa63e9
-
[23]
Correia, A. C. M., & Laskar, J. 2001, Nature, 411, 767, doi: 10.1038/35081000
-
[24]
Dawson, R. I., Murray-Clay, R. A., & Fabrycky, D. C. 2011, ApJL, 743, L17, doi: 10.1088/2041-8205/743/1/L17
-
[25]
2015, George: Gaussian Process regression,, Astrophysics Source Code Library, record ascl:1511.015 http://ascl.net/1511.015
Foreman-Mackey, D. 2015, George: Gaussian Process regression,, Astrophysics Source Code Library, record ascl:1511.015 http://ascl.net/1511.015
2015
-
[26]
Foreman-Mackey, D., Hogg, D. W., Lang, D., & Goodman, J. 2013, PASP, 125, 306, doi: 10.1086/670067
doi:10.1086/670067 2013
-
[27]
2024, ApJ, 965, 182, doi: 10.3847/1538-4357/ad2c84
Fuda, N., Apai, D., Nardiello, D., et al. 2024, ApJ, 965, 182, doi: 10.3847/1538-4357/ad2c84
-
[28]
2025, MNRAS, 537, 134, doi: 10.1093/mnras/staf004
Gandhi, S., de Regt, S., Snellen, I., et al. 2025, MNRAS, 537, 134, doi: 10.1093/mnras/staf004
-
[29]
Ge, H., Zhang, X., Fletcher, L. N., et al. 2019, AJ, 157, 89, doi: 10.3847/1538-3881/aafba7
-
[30]
Discovery of an Exterior Third Planet Orbiting $\beta$ Pictoris
Gibbs, A., Ruffio, J.-B., Bidot, A., et al. 2026, arXiv e-prints, arXiv:2606.23789, doi: 10.48550/arXiv.2606.23789 GRA VITY Collaboration, Nowak, M., Lacour, S., et al. 2020, A&A, 633, A110, doi: 10.1051/0004-6361/201936898
work page internal anchor Pith review Pith/arXiv arXiv doi:10.48550/arxiv.2606.23789 2026
-
[31]
Heap, S. R., Lindler, D. J., Lanz, T. M., et al. 2000, ApJ, 539, 435, doi: 10.1086/309188
doi:10.1086/309188 2000
-
[32]
Householder, A., Limbach, M. A., Biller, B., et al. 2025, ApJL, 992, L16, doi: 10.3847/2041-8213/ae09ab
-
[33]
Hsu, C.-C., Wang, J. J., Xuan, J. W., et al. 2026, AJ, 171, 224, doi: 10.3847/1538-3881/ae434b
-
[34]
2023, ApJ, 956, 45, doi: 10.3847/1538-4357/acf46e
Huang, X., Ji, J., Liu, S., Dong, R., & Wang, S. 2023, ApJ, 956, 45, doi: 10.3847/1538-4357/acf46e
-
[35]
Jennings, R. M., & Chiang, E. 2021, MNRAS, 507, 5187, doi: 10.1093/mnras/stab2429
-
[36]
Johansen, A., & Lacerda, P. 2010, Monthly Notices of the Royal Astronomical Society, 404, 475, doi: 10.1111/j.1365-2966.2010.16309.x
arXiv 2010
-
[37]
Kammerer, J., Girard, J., Carter, A. L., et al. 2022, in Society of Photo-Optical Instrumentation Engineers (SPIE) Conference Series, Vol. 12180, Space Telescopes and Instrumentation 2022: Optical, Infrared, and Millimeter Wave, ed. L. E. Coyle, S. Matsuura, & M. D. Perrin, 121803N, doi: 10.1117/12.2628865
-
[38]
Kammerer, J., Lawson, K., Perrin, M. D., et al. 2024, AJ, 168, 51, doi: 10.3847/1538-3881/ad4ffe
-
[39]
Pasachoff, J. M. 2015, ApJ, 814, 65, doi: 10.1088/0004-637X/814/1/65
-
[40]
Kenworthy, M. A., Mellon, S. N., Bailey, J. I., et al. 2021, A&A, 648, A15, doi: 10.1051/0004-6361/202040060
-
[41]
2020, ApJL, 897, L8, doi: 10.3847/2041-8213/ab9d27
Kraus, S., Le Bouquin, J.-B., Kreplin, A., et al. 2020, ApJL, 897, L8, doi: 10.3847/2041-8213/ab9d27
-
[42]
Lacour, S., Wang, J. J., Rodet, L., et al. 2021, A&A, 654, L2, doi: 10.1051/0004-6361/202141889 Lafreni` ere, D., Marois, C., Doyon, R., & Barman, T. 2009, ApJL, 694, L148, doi: 10.1088/0004-637X/694/2/L148
-
[43]
2010, Science, 329, 57, doi: 10.1126/science.1187187
Lagrange, A.-M., Bonnefoy, M., Chauvin, G., et al. 2010, Science, 329, 57, doi: 10.1126/science.1187187
-
[44]
2019, Nature Astronomy, 3, 1135, doi: 10.1038/s41550-019-0857-1
Lagrange, A.-M., Meunier, N., Rubini, P., et al. 2019, Nature Astronomy, 3, 1135, doi: 10.1038/s41550-019-0857-1
-
[45]
M., Rubini, P., Nowak, M., et al
Lagrange, A. M., Rubini, P., Nowak, M., et al. 2020, A&A, 642, A18, doi: 10.1051/0004-6361/202038823
-
[46]
Lam, M. B., Vos, J. M., Su´ arez, G., et al. 2026, arXiv e-prints, arXiv:2603.24662, doi: 10.48550/arXiv.2603.24662
work page internal anchor Pith review Pith/arXiv arXiv doi:10.48550/arxiv.2603.24662 2026
-
[47]
Landman, R., Stolker, T., Snellen, I. A. G., et al. 2024, A&A, 682, A48, doi: 10.1051/0004-6361/202347846
-
[48]
Lew, B. W. P., Apai, D., Zhou, Y., et al. 2020, AJ, 159, 125, doi: 10.3847/1538-3881/ab5f59
-
[49]
2021, ApJL, 915, L2, doi: 10.3847/2041-8213/ac0620
Li, G. 2021, ApJL, 915, L2, doi: 10.3847/2041-8213/ac0620
-
[50]
Limbach, M. A., Vos, J. M., Winn, J. N., et al. 2021, ApJL, 918, L25, doi: 10.3847/2041-8213/ac1e2d
-
[51]
Lomb, N. R. 1976, Astrophysics and Space Science, 39, 447, doi: 10.1007/BF00648343
-
[52]
2006, ApJ, 641, 556, doi: 10.1086/500401
Nadeau, D. 2006, ApJ, 641, 556, doi: 10.1086/500401
doi:10.1086/500401 2006
-
[53]
Masuda, K., & Winn, J. N. 2020, AJ, 159, 81, doi: 10.3847/1538-3881/ab65be
-
[54]
McCarthy, A. M., Vos, J. M., Muirhead, P. S., et al. 2025, ApJL, 981, L22, doi: 10.3847/2041-8213/ad9eaf M´ ekarnia, D., Chapellier, E., Guillot, T., et al. 2017, A&A, 608, L6, doi: 10.1051/0004-6361/201732121
-
[55]
A., Heinze, A., Apai, D., et al
Metchev, S. A., Heinze, A., Apai, D., et al. 2015, ApJ, 799, 154, doi: 10.1088/0004-637X/799/2/154 Miles-P´ aez, P. A., Metchev, S., Apai, D., et al. 2019, ApJ, 883, 181, doi: 10.3847/1538-4357/ab3d25 25
-
[56]
2003, ApJ, 583, 451, doi: 10.1086/345097
Mohanty, S., & Basri, G. 2003, ApJ, 583, 451, doi: 10.1086/345097
doi:10.1086/345097 2003
-
[57]
Morley, C. V., Marley, M. S., Fortney, J. J., & Lupu, R. 2014, ApJL, 789, L14, doi: 10.1088/2041-8205/789/1/L14
-
[58]
Lagrange, A. M. 1997, MNRAS, 292, 896, doi: 10.1093/mnras/292.4.896
-
[59]
B., et al
Newville, M., Stensitzki, T., Allen, D. B., et al. 2016, Lmfit: Non-Linear Least-Square Minimization and Curve-Fitting for Python,, Astrophysics Source Code Library, record ascl:1606.014 http://ascl.net/1606.014
2016
-
[60]
Fielding, D. B. 2016, ApJL, 827, L11, doi: 10.3847/2041-8205/827/1/L11
-
[61]
Oliveros-Gomez, N., Manjavacas, E., Karalidi, T., et al. 2026, ApJ, 997, 136, doi: 10.3847/1538-4357/ae21d9 O’Toole, C., Vos, J. M., Nasedkin, E. N., et al. 2026, arXiv e-prints, arXiv:2603.24663, doi: 10.48550/arXiv.2603.24663
work page internal anchor Pith review Pith/arXiv arXiv doi:10.48550/arxiv.2603.24663 2026
-
[62]
2023, A&A, 670, A90, doi: 10.1051/0004-6361/202244294
Palma-Bifani, P., Chauvin, G., Bonnefoy, M., et al. 2023, A&A, 670, A90, doi: 10.1051/0004-6361/202244294
-
[63]
Parker, L. T., Birkby, J. L., Landman, R., et al. 2024, MNRAS, 531, 2356, doi: 10.1093/mnras/stae1277
-
[64]
D., Sivaramakrishnan, A., Lajoie, C.-P., et al
Perrin, M. D., Sivaramakrishnan, A., Lajoie, C.-P., et al. 2014, in Society of Photo-Optical Instrumentation Engineers (SPIE) Conference Series, Vol. 9143, Space Telescopes and Instrumentation 2014: Optical, Infrared, and Millimeter Wave, ed. J. M. Oschmann, Jr., M. Clampin, G. G. Fazio, & H. A. MacEwen, 91433X, doi: 10.1117/12.2056689
-
[65]
2012, in Society of Photo-Optical Instrumentation Engineers (SPIE) Conference Series, Vol
Sivaramakrishnan, A. 2012, in Society of Photo-Optical Instrumentation Engineers (SPIE) Conference Series, Vol. 8442, Space Telescopes and Instrumentation 2012:
2012
-
[66]
Oschmann, Jr., 84423D, doi: 10.1117/12.925230
-
[67]
Poon, M., Bryan, M. L., Rein, H., et al. 2025, ApJL, 994, L48, doi: 10.3847/2041-8213/ae1f0e
-
[68]
Poon, M., Bryan, M. L., Rein, H., et al. 2024, AJ, 168, 270, doi: 10.3847/1538-3881/ad84e5
-
[69]
Stellar separation shapes spin-orbit alignment in visual binaries
Poon, M., Pham, D., Bryan, M. L., Rein, H., & Dong, J. 2026, arXiv e-prints, arXiv:2604.18921, doi: 10.48550/arXiv.2604.18921
work page internal anchor Pith review Pith/arXiv arXiv doi:10.48550/arxiv.2604.18921 2026
-
[70]
2016, ApJ, 824, 117, doi: 10.3847/0004-637X/824/2/117
Pueyo, L. 2016, ApJ, 824, 117, doi: 10.3847/0004-637X/824/2/117
-
[71]
2012, ApJ, 750, 105, doi: 10.1088/0004-637X/750/2/105
Radigan, J., Jayawardhana, R., Lafreni` ere, D., et al. 2012, ApJ, 750, 105, doi: 10.1088/0004-637X/750/2/105
-
[72]
2008, ApJ, 684, 1390, doi: 10.1086/590073
Reiners, A., & Basri, G. 2008, ApJ, 684, 1390, doi: 10.1086/590073
doi:10.1086/590073 2008
-
[73]
2023, PASP, 135, 048001, doi: 10.1088/1538-3873/acb293
Rigby, J., Perrin, M., McElwain, M., & JWST Commissioning Team. 2023, PASP, 135, 048001, doi: 10.1088/1538-3873/acb293
-
[74]
Scargle, J. D. 1982, ApJ, 263, 835, doi: 10.1086/160554
doi:10.1086/160554 1982
-
[75]
2023, PASP, 135, 018001, doi: 10.1088/1538-3873/aca718
Schlawin, E., Beatty, T., Brooks, B., et al. 2023, PASP, 135, 018001, doi: 10.1088/1538-3873/aca718
-
[76]
2005, A&A, 429, 1007, doi: 10.1051/0004-6361:20041932
Scholz, A., & Eisl¨ offel, J. 2005, A&A, 429, 1007, doi: 10.1051/0004-6361:20041932
-
[77]
2015, ApJL, 809, L29, doi: 10.1088/2041-8205/809/2/L29
Scholz, A., Kostov, V., Jayawardhana, R., & Muˇ zi´ c, K. 2015, ApJL, 809, L29, doi: 10.1088/2041-8205/809/2/L29
-
[78]
Simon, A. A., Rowe, J. F., Gaulme, P., et al. 2016, ApJ, 817, 162, doi: 10.3847/0004-637X/817/2/162
-
[79]
Slattery, W. L., Benz, W., & Cameron, A. G. W. 1992, Icarus, 99, 167, doi: 10.1016/0019-1035(92)90180-F
-
[80]
Snellen, I. A. G., Brandl, B. R., de Kok, R. J., et al. 2014, Nature, 509, 63, doi: 10.1038/nature13253
discussion (0)
Sign in with ORCID, Apple, or X to comment. Anyone can read and Pith papers without signing in.