REVIEW 3 major objections 6 minor 52 references
Quantum Neural Networks for Wind Energy Forecasting: A Comparative Study of Performance and Scalability with Classical Models
T0 review · 3 major / 6 minor · reviewed 2026-08-06 · deepseek-v4-flash
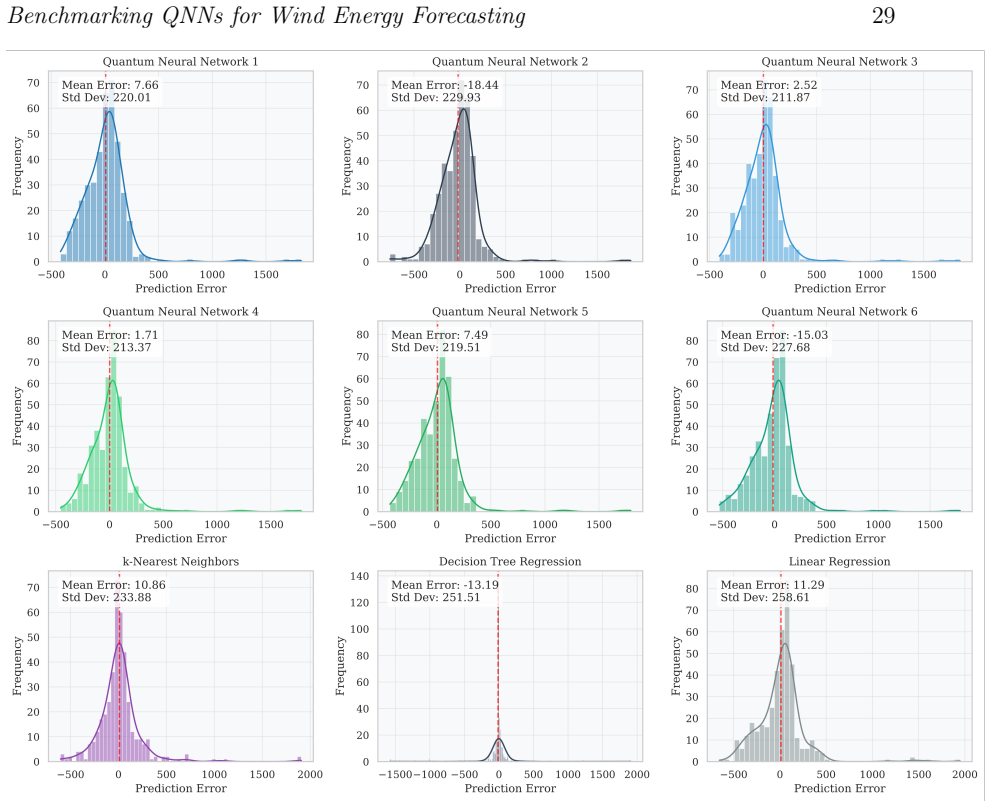
Pith's one-line read This paper claims six QNN configurations match or slightly beat classical regressors on wind-turbine power prediction, with QNN-3 reaching R²=0.94 and RMSE 174.67 kW versus kNN's 182.99 kW.
desk verdict Useful and honest QNN benchmark, but the 'marginally better' claim rests on a single split and is not supported by the paper's own cross-validation. read the letter →
The pith
A machine-rendered reading of the paper's core claim, the machinery that carries it, and where it could break.
The reading
What carries the argument
The central object is the Z Feature Map, a data-encoding circuit that maps each classical feature into a single-qubit phase via Hadamard gates and $Z$-axis rotations (two repetitions), followed by a RealAmplitudes ansatz whose $Y$-rotations and $\mathrm{CNOT}$ entangling gates are arranged into six entanglement strategies: Full, Linear, Circular, Shifted-Circular-Alternating, Reverse Linear, and Pairwise. Keeping the encoding fixed and varying only the ansatz isolates the effect of circuit geometry and gate count on accuracy and runtime. A classical optimizer (L-BFGS-B) trains the circuit parameters, and the total gate count for each configuration ranges from 34 to 40, which the paper uses as the main explanatory variable for simulation time.
What would settle it
Re-run the entire benchmark, for all six QNNs and the three classical models at the 4000-sample size, with the min-max scaler fitted on the 80% training split and then applied unchanged to the hold-out set; if QNN-3's RMSE no longer stays below kNN's 182.99 kW, the central comparative claim loses its evidence. A second check is to repeat the data-splitting and scaling procedure over several random seeds to see whether QNN-3's 1600-sample cross-validation peak reflects a stable property or the single split used in the paper.
Extended reading notes
Core claim
The paper's central claim is experimental: given a fixed data-encoding circuit (the Z Feature Map) and six ansatz layouts that differ only in entanglement strategy, QNNs can match or slightly outperform classical benchmarks on wind-power regression. The strongest specific result is QNN-3 on the largest hold-out set, with $R^2=0.94$ and $\mathrm{RMSE}=174.67$ kW against kNN's 0.94 and 182.99 kW; the paper also reports that quantum models gave the lowest or equal-lowest RMSE across all tested hold-out sizes. It further claims that cross-validated QNN performance peaks at 1600 training samples and then plateaus or declines, that all six configurations converge within roughly 10–15 L-BFGS-B iterations, that simulation time scales as $O(n)$ with dataset size, and that total gate count, more than gate arrangement, determines runtime. The paper acknowledges that QNNs sometimes output negative power values, which are physically impossible, and that no hyperparameter tuning was performed for either quantum or classical models.
Load-bearing premise
The load-bearing premise is that the min-max rescaling (which maps each feature into $[0,1]$) was fitted using only the 80% training portion; the paper says the data were split and then scaled but never says the scaler was fit on the training split, and if test statistics leaked into the scaling, the reported hold-out $R^2$ and RMSE values would be optimistically biased.
Editorial extensions
If this is right
- On this wind-turbine regression task, QNN configurations can match or slightly beat kNN, decision trees, and linear regression, so they are a plausible alternative for small tabular forecasting problems.
- QNN training time on classical simulators scales approximately linearly with dataset size, and designs with fewer total gates simulate fastest, independent of entanglement geometry.
- Adding training data beyond about 1600 samples did not improve QNN accuracy and sometimes worsened it, suggesting an optimal data-to-model-complexity ratio for these shallow circuits.
- All six QNNs converge within about 10–15 iterations with the chosen optimizer, and larger datasets reduce training-loss variance.
- Because QNNs can output physically impossible negative power predictions, deployment would require added constraints such as a ReLU output or a penalty in the loss function.
Reading between the lines
- Editorial inference: the reported 4.5% advantage rests on a preprocessing detail the paper never states explicitly; if the min-max scaler was fit on the full dataset rather than the training split only, the hold-out numbers would be optimistically biased and the gap could shrink or disappear.
- Editorial inference: the $O(n)$ time scaling is a classical-simulation result tied to gate count; on real quantum hardware the bottleneck shifts to measurement shots, noise, and qubit connectivity, so the scalability conclusion should not be assumed to transfer.
- Editorial inference: the performance peak at 1600 samples may be a property of these specific shallow four-qubit circuits; testing deeper ansätze or more expressive feature maps could shift or erase the peak, connecting this measurement to expressibility and trainability questions.
- Editorial inference: because the classical baselines were run with default parameters and hyperparameter search was explicitly left out for all models, a fair tuned comparison (including stronger regressors such as gradient-boosted trees) is the natural next test of whether the quantum advantage survives.
Editorial analysis
A structured set of objections, weighed in public.
Referee Report
Summary. The paper presents an empirical benchmark of six quantum neural network (QNN) configurations—all using the Z Feature Map with different ansatz entanglement strategies—against three classical regressors (kNN, DTR, LR) for wind turbine power output prediction. Experiments are run on random subsets of 1000 to 4000 samples, with 5-fold cross-validation on training portions and a single 80/20 holdout evaluation. The central claims are that QNNs achieve predictive performance competitive with, and in some cases marginally better than, the classical baselines (with QNN-3 reaching R²=0.94 and RMSE=174.67 kW on the 800-sample holdout versus kNN's 182.99 kW), and that QNN simulation time scales linearly, O(n), with dataset size.
Significance. If fully supported, the study would provide useful empirical guidance for applying QNNs to small tabular regression tasks in the energy domain. The manuscript has notable strengths: fold-level cross-validation tables are reported for every configuration and dataset size, circuit diagrams and gate counts are documented for reproducibility, and the authors explicitly acknowledge limitations such as the absence of hyperparameter tuning and unphysical negative predictions. The comparison across dataset sizes and the gate-count versus runtime analysis are also potentially informative. However, the headline quantitative claims—particularly the 'marginally better' comparison and the O(n) complexity statement—are not adequately supported by the evidence as presented, so the paper is currently most defensible as a demonstration that QNNs are broadly competitive within noise, rather than that they surpass classical methods.
major comments (3)
- [§4.4, Table 19 vs. Tables 11 and 18] The claim that QNNs are 'in some cases marginally better' than classical models rests on a single 80/20 holdout evaluation with no repeated splits, no multiple random seeds, and no significance test. In Table 19, QNN-3 achieves RMSE 174.67 kW versus kNN's 182.99 kW on the 800-sample holdout, a gap of 8.32 kW (4.5%). This gap is smaller than the variability in the paper's own 5-fold cross-validation on the corresponding 3200-sample training set: QNN-3 has mean CV RMSE 207.64 ± 27.71 kW (Table 11) and kNN has 204.18 ± 12.68 kW (Table 18), with heavily overlapping fold ranges. Thus the holdout difference cannot be distinguished from split-to-split or initialization noise, and the abstract's 'marginally better' phrasing and §4.5's stronger language ('significant advantage') are not supported. The authors should report repeated holdout evaluations (e.g., multiple random splits or repeated k-fold) with paired tests such as a Wilcoxon signed-rank test, and adjust the conclusions to 'competitive within noise' unless such tests justify a stronger claim.
- [Section 2, Data Preprocessing] The preprocessing description states that data were 'divided into training (80%) and test (20%) sets, and then used a min-max scaler (Equation (1)) to scale all values' but does not state whether the scaler's x_min and x_max were computed on the training split alone or on the combined training and test sets. If the scaler is fit using test-set statistics, information from the holdout set enters the training pipeline, which would optimistically bias every holdout number in Table 19, including the headline QNN-3 versus kNN comparison. The authors must clarify that scaling was fit only on the training data, or, if it was not, rerun the experiments with correct train-only scaling and report the scaler-fitting code or explicit procedure.
- [§4.2.1, Equation (13) and Table 14] The claim of 'time complexity O(n)' is based on a linear regression fitted to only four dataset-size points (800, 1600, 2400, 3200) with no reported goodness-of-fit, residuals, confidence intervals, or comparison against alternative scaling functions such as quadratic or log-linear fits. With four points, the linear trend may simply be an artifact of the chosen sizes and the specific simulator. The claim as stated in §4.2.1 and repeated in §5 ('computational complexity of O(n)') is too strong. The authors should provide more granular runtime measurements (ideally multiple independent runs per dataset size), report fit statistics and residual analysis, and rephrase the conclusion as an empirical observation of approximately linear growth within the tested range rather than an asymptotic complexity statement.
minor comments (6)
- [Section 3.2.4] There is a duplicated word in the sentence 'are used used for finding optimal parameters'; this should be corrected.
- [Equation (12), Table 12] The stability score SC in Equation (12) is defined as the sum of min-max normalized standard deviation, maximum spike after iteration 10, and final loss, but the normalization range and the direction of the normalization (whether lower raw values always give lower normalized values) are not defined precisely. Please specify the normalization procedure or give explicit formulas.
- [Section 1, End of Introduction] The phrase 'in 1' in the sentence 'there are four options, as shown in 1 which are:' is incomplete; it should reference Figure 1.
- [Section 4.1.3] The selection of the 10th iteration as the threshold for 'convergence' is arbitrary; please justify this choice or include a sensitivity check, since the stability score depends on it.
- [Section 3.4] The paper reports that linear regression and decision tree regressors use 'default parameters' but does not specify the scikit-learn version or the exact defaults in use; adding version numbers would improve reproducibility.
- [General] The manuscript does not specify the number of shots, the measurement basis, or how the expectation value is mapped to a continuous power prediction in the regression task. These details are essential for reproducing the QNN results and should be added.
Circularity Check
No circularity: the QNN-vs-classical comparison is an empirical benchmark measured on a holdout set; self-citations motivate design choices but do not define the results.
full rationale
This paper is an empirical benchmark, not a derivation chain. The central claim—that QNN-3 achieves holdout R2 0.94 and RMSE 174.67 kW versus kNN's R2 0.94 and RMSE 182.99 kW in Table 19—comes from training on one split and evaluating on a separate holdout set, so the reported scores are measured outcomes rather than quantities defined by the model's construction. No equation in the paper defines its prediction target in terms of fitted parameters, and no fitted parameter is renamed as a prediction. The self-citations to the authors' prior work occur in design choices: Section 3.3 chooses the Z Feature Map because '[o]ur previous experimental study [40], found that the Z Feature Map demonstrated approximately three times better predictive performance than the ZZ Feature Map on the same dataset used here,' and Section 3.4 selects kNN, DTR, and LR 'based on our prior experimental success with these specific models on the same wind turbine power output dataset.' These citations motivate the experimental setup but are not load-bearing for the headline comparison, which is evaluated against independent classical baselines. The O(n) time-complexity statement in Section 4.2.1 is obtained by fitting a linear regression to measured runtimes—'Our empirical regression analysis demonstrates that the training of the QNN configurations used in this study scales linearly with dataset size, indicating a time complexity of O(n)'—which is an empirical summary of the measurements, not a circular derivation. The only potentially problematic issue is that Section 2 does not explicitly state whether the min-max scaler was fit on the training split alone; if it were fit on combined train and test data, the holdout estimates could be optimistically biased. That is a methodological leakage concern, not circularity. No reduction of a predicted result to its own input is present, so the circularity score is 0.
Assumptions & free parameters
free parameters (2)
- Runtime linear-fit slope a =
2.87e-2 to 3.26e-2 min per sample depending on QNN configuration
- Runtime linear-fit intercept b =
-0.99 to 0.60 minutes depending on configuration
assumptions (4)
- domain assumption Classical simulation of quantum circuits faithfully reproduces the QNN predictions used for the benchmarks.
- domain assumption The wind turbine dataset from ref [42] is a valid basis for wind power forecasting comparisons.
- domain assumption Randomly drawn subsets of the dataset are representative and independent samples for the four dataset sizes.
- domain assumption L-BFGS-B with 25 iterations reaches a sufficient optimum for the QNN cost.
Cite this review
Pith. "Pith review of Quantum Neural Networks for Wind Energy Forecasting: A Comparative Study of Performance and Scalability with Classical Models." pith.science (2026). https://pith.science/paper/SUFAHOAQ
@misc{pith2026250622845,
  author       = {Pith},
  title        = {Pith review of: Quantum Neural Networks for Wind Energy Forecasting: A Comparative Study of Performance and Scalability with Classical Models},
  year         = {2026},
  howpublished = {\url{https://pith.science/paper/SUFAHOAQ}},
  note         = {Machine review of arXiv:2506.22845}
}
read the original abstract
Quantum Neural Networks (QNNs), a prominent approach in Quantum Machine Learning (QML), are emerging as a powerful alternative to classical machine learning methods. Recent studies have focused on the applicability of QNNs to various tasks, such as time-series forecasting, prediction, and classification, across a wide range of applications, including cybersecurity and medical imaging. With the increased use of smart grids driven by the integration of renewable energy systems, machine learning plays an important role in predicting power demand and detecting system disturbances. This study provides an in-depth investigation of QNNs for predicting the power output of a wind turbine. We assess the predictive performance and simulation time of six QNN configurations that are based on the Z Feature Map for data encoding and varying ansatz structures. Through detailed cross-validation experiments and tests on an unseen hold-out dataset, we experimentally demonstrate that QNNs can achieve predictive performance that is competitive with, and in some cases marginally better than, the benchmarked classical approaches. Our results also reveal the effects of dataset size and circuit complexity on predictive performance and simulation time. We believe our findings will offer valuable insights for researchers in the energy domain who wish to incorporate quantum machine learning into their work.
Figures


Figures from the paper (8 more)




Reference graph
Works this paper leans on
-
[1]
Acharya R, Abanin D A, Aghababaie-Beni L, Aleiner I, Andersen T I, Ansmann M, Arute F, Arya K, Asfaw A, Astrakhantsev N, Atalaya J, Babbush R, Bacon D, Ballard B, Bardin J C, Bausch J, Bengtsson A, Bilmes A, Blackwell S, Boixo S, Bortoli G, Bourassa A, Bovaird J, Brill L, Broughton M, Browne D A, Buchea B, Buckley B B, Buell D A, Burger T, Burkett B, Bush...
work page 2024
-
[2]
Aghaee M, Ramirez A A, Alam Z, Ali R, Andrzejczuk M, Antipov A, Astafev M, Barzegar A, Bauer B, Becker J, Bhaskar U K, Bocharov A, Boddapati S, Bohn D, Bommer J, Bourdet L, Bousquet A, Boutin S, Casparis L, Chapman B J, Chatoor S, Christensen A W, Chua C, Codd P, Cole W, Cooper P, Corsetti F, Cui A, Dalpasso P, Dehollain J P, de Lange G, de Moor M, Ekefja...
work page 2025
-
[3]
Tom D and Svore K 2024 How microsoft and quantinuum achieved reliable quantum computing microsoft Azure Quantum Blog URL https://azure.microsoft.com/en-us/blog/quantum/ 2024/04/03/how-microsoft-and-quantinuum-achieved-reliable-quantum-computing/
work page 2024
-
[4]
Paetznick A, da Silva M P, Ryan-Anderson C, Bello-Rivas J M, III J P C, Chernoguzov A, Dreiling J M, Foltz C, Frachon F, Gaebler J P, Gatterman T M, Grans-Samuelsson L, Gresh D, Hayes D, Hewitt N, Holliman C, Horst C V, Johansen J, Lucchetti D, Matsuoka Y, Mills M, Moses S A, Neyenhuis B, Paz A, Pino J, Siegfried P, Sundaram A, Tom D, Wernli S J, Zanner M...
arXiv 2024
-
[5]
Kyriienko O and Magnusson E B 2022 arXiv preprint arXiv:2208.01203
arXiv 2022
-
[6]
Sakhnenko A, O’Meara C, Ghosh K J, Mendl C B, Cortiana G and Bernab´ e-Moreno J 2022 Quantum Machine Intelligence 4 27
work page 2022
-
[7]
Amin J, Anjum M A, Ibrar K, Sharif M, Kadry S and Crespo R G 2023 Image and Vision Computing 135 104710 ISSN 0262-8856 URL https://www.sciencedirect.com/science/ article/pii/S0262885623000847
work page 2023
-
[8]
Wang M, Huang A, Liu Y, Yi X, Wu J and Wang S 2023 Entropy 25 ISSN 1099-4300 URL https://www.mdpi.com/1099-4300/25/3/427
work page 2023
Show all 52 references
-
[9]
Sha M and Rahamathulla M P 2024 Quantum Information Processing 23 ISSN 1570-0755
2024
-
[10]
Zhuang S, Tanner J, Wu Y, Huynh D, Liu W, Cadet X, Fontaine N, Charton P, Damour C, Cadet F and Wang J 2024 Quantum Information Processing 23 ISSN 1570-0755
2024
-
[11]
Chen Y 2024 Quantum Information Processing 23 ISSN 1570-0755
2024
-
[12]
Abdulsalam G and Ahmad I 2025 Quantum Information Processing 24 109 ISSN 1573-1332 URL https://doi.org/10.1007/s11128-025-04728-3
2025 doi
-
[13]
Yang Q, Zhang W and Wei L 2025 Quantum Information Processing 24 ISSN 1570-0755
2025
-
[14]
Ajagekar A and You F 2021 Applied Energy 303 117628 ISSN 0306-2619
2021
-
[16]
Yu Y, Hu G, Liu C, Xiong J and Wu Z 2023 IEEE Transactions on Quantum Engineering 4 1–15
2023
-
[17]
Satpathy S K, Vibhu V, Behera B K, Al-Kuwari S, Mumtaz S and Farouk A 2024 IEEE Internet of Things Journal 11 3840–3852
2024
-
[18]
Chen J and Li Y 2024 Extended abstract: Quantum-accelerated transient stability assessment for power systems 2024 IEEE Computer Society Annual Symposium on VLSI (ISVLSI) pp 593–594
2024
-
[19]
Safari A and Badamchizadeh M A 2024 Neural Computing and Applications 36 19121–19138
2024
-
[20]
Hangun B, Eyecioglu O and Altun O 2024 Quantum computing approach to smart grid stability forecasting 2024 12th International Conference on Smart Grid (icSmartGrid) pp 840–843
2024
-
[21]
Hangun B, Akpinar E, Oduncuoglu M, Altun O and Eyecioglu O 2024 A hybrid quantum-classical Benchmarking QNNs for Wind Energy Forecasting 35 machine learning approach to offshore wind farm power forecasting 2024 13th International Conference on Renewable Energy Research and App...
2024
-
[22]
Global Wind Energy Council 2024 Global wind report 2024 https://gwec.net/ global-wind-report-2024/ accessed: 2025-04-09 URL https://gwec.net/ global-wind-report-2024/
2024
-
[23]
Giebel G, Brownsword R, Kariniotakis G, Denhard M and Draxl C 2011 The State-Of-The-Art in Short-Term Prediction of Wind Power: A Literature Overview, 2nd edition (ANEMOS.plus) project funded by the European Commission under the 6th Framework Program, Priority 6.1: Sustainable...
2011
-
[24]
Foley A M, Leahy P G, Marvuglia A and McKeogh E J 2012 Renewable Energy 37 1–8 ISSN 0960-1481
2012
-
[25]
Ju Y, Sun G, Chen Q, Zhang M, Zhu H and Rehman M U 2019 IEEE Access 7 28309–28318
2019
-
[26]
Shabbir N, AhmadiAhangar R, K¨ utt L, Iqbal M N and Rosin A 2019 Forecasting short term wind energy generation using machine learning 2019 IEEE 60th International Scientific Conference on Power and Electrical Engineering of Riga Technical University (RTUCON) pp 1–4
2019
-
[27]
Sulaiman M H and Mustaffa Z 2024 Cleaner Energy Systems 9 100139 ISSN 2772-7831
2024
-
[28]
Olcay K, G ´ ıray Tunca S and Ar ´ ıf¨Ozg¨ ur M 2024IEEE Access 12 103299–103312
-
[29]
Ajagekar A and You F 2019 Energy 179 76–89 ISSN 0360-5442
2019
-
[30]
Zhou Y, Tang Z, Nikmehr N, Babahajiani P, Feng F, Wei T C, Zheng H and Zhang P 2022 iEnergy 1 170–187
2022
-
[31]
Zhou Y and Zhang P 2023 IEEE Transactions on Power Systems 38 475–487
2023
-
[32]
Ranga D, Rana A, Prajapat S, Kumar P, Kumar K and Vasilakos A V 2024 Mathematics 12 ISSN 2227-7390 URL https://www.mdpi.com/2227-7390/12/21/3318
2024
-
[33]
Hong Y Y and Santos J B D 2025 Energies 18 ISSN 1996-1073 URL https://www.mdpi.com/ 1996-1073/18/7/1771
2025
-
[34]
Gujju Y, Matsuo A and Raymond R 2024 Phys. Rev. Appl. 21(6) 067001 URL https://link. aps.org/doi/10.1103/PhysRevApplied.21.067001
2024 doi
-
[35]
Budinski L, Niemim¨ aki O, Zamora-Zamora R and Lahtinen V 2023 Quantum Science and Technology 8 045031 URL https://dx.doi.org/10.1088/2058-9565/acfab7
2023 doi
-
[36]
Smith A W R, Paige A J and Kim M S 2023 Quantum Science and Technology 8 045016 URL https://dx.doi.org/10.1088/2058-9565/aceb87
2023 doi
-
[37]
Mineh L and Montanaro A 2023 Quantum Science and Technology 8 035012 URL https: //dx.doi.org/10.1088/2058-9565/acd0d2
2023 doi
-
[38]
Agliardi G, O’Meara C, Yogaraj K, Ghosh K, Sabino P, Fern´ andez-Campoamor M, Cortiana G, Bernab´ e-Moreno J, Tacchino F, Mezzacapo A and Shehab O 2025 Quantum Science and Technology 10 025005 URL https://dx.doi.org/10.1088/2058-9565/ada08c
2025 doi
-
[39]
Ponce M, Cope T, de Vega I and Leib M 2024 Quantum Science and Technology 10 015027 URL https://dx.doi.org/10.1088/2058-9565/ad8eee
2024 doi
-
[40]
Hangun B, Akpinar E, Altun O and Eyecioglu O 2025 Comparative analysis of qnn architectures for wind power prediction: Feature maps and ansatz configurations (Preprint 2506.14795) URL https://arxiv.org/abs/2506.14795
2025 arXiv
-
[41]
Eyecioglu O, Hangun B, Kayisli K and Yesilbudak M 2019 Performance comparison of different machine learning algorithms on the prediction of wind turbine power generation 2019 8th International Conference on Renewable Energy Research and Applications (ICRERA) pp 922– 926
2019
-
[42]
of Denmark T U and Laboratory R N Database on wind characteristicshttp://www.winddata.com [Online]
-
[43]
2014.964942
Schuld M, Sinayskiy I and and F P 2015 Contemporary Physics 56 172–185 ( Preprint https: //doi.org/10.1080/00107514.2014.964942) URL https://doi.org/10.1080/00107514. 2014.964942
2015
-
[44]
Preskill J 2018 Quantum 2 79 ISSN 2521-327X URL https://doi.org/10.22331/ Benchmarking QNNs for Wind Energy Forecasting 36 q-2018-08-06-79
2018
-
[45]
Rath M and Date H 2024 EPJ Quantum Technology 11 72
2024
-
[46]
Du Y, Huang T, You S, Hsieh M H and Tao D 2022 NPJ QUANTUM INFORMATION 8
2022
-
[47]
Schuld M and Killoran N 2019 Physical Review Letters 122 040504
2019
-
[48]
Javadi-Abhari A, Treinish M, Krsulich K, Wood C J, Lishman J, Gacon J, Martiel S, Nation P D, Bishop L S, Cross A W, Johnson B R and Gambetta J M 2024 Quantum computing with Qiskit (Preprint 2405.08810)
2024 arXiv
-
[49]
Havl ´ ıˇ cek V, C´ orcoles A D, Temme K, Harrow A W, Kandala A, Chow J M and Gambetta J M 2019 Nature 567 209–212
2019
-
[50]
McClean J R, Romero J, Babbush R and Aspuru-Guzik A 2016 NEW JOURNAL OF PHYSICS 18 ISSN 1367-2630
2016
-
[51]
Abbas A, Sutter D, Zoufal C, Lucchi A, Figalli A and Woerner S 2021 NATURE COMPUTATIONAL SCIENCE 1 403–409
2021
-
[52]
Arthur D and Date P 2022 A hybrid quantum-classical neural network architecture for binary classification (Preprint 2201.01820) URL https://arxiv.org/abs/2201.01820
2022 arXiv
-
[53]
Quantum circuits used in this study Figure A1
Sahin M E, Altamura E, Wallis O, Wood S P, Dekusar A, Millar D A, Imamichi T, Matsuo A and Mensa S 2025 Qiskit machine learning: an open-source library for quantum machine learning tasks at scale on quantum hardware and classical simulators ( Preprint 2505.17756) URL https://a...
2025 arXiv
Reviewed August 6, 2026 · model on record in the stance chip above.
Discussion (0). Sign in to comment.