REVIEW 3 major objections 4 minor 52 references
AKRMap: Adaptive Kernel Regression for Trustworthy Visualization of Cross-Modal Embeddings
T0 review · 3 major / 4 minor · reviewed 2026-08-07 · deepseek-v4-flash
Pith's one-line read AKRMap trains a projection network under a learnable kernel-regression loss so 2D maps of cross-modal embeddings show where metrics such as CLIPScore and HPSv2 are high or low, cutting out-of-sample contour error by about 43 percent.
desk verdict A genuinely new supervised DR method with a sensible kernel-regression objective, but the headline MAE gains over t-SNE/UMAP are only interpretable once the paper specifies how out-of-sample test points were embedded for those nonparametric baselines. read the letter →
The pith
A machine-rendered reading of the paper's core claim, the machinery that carries it, and where it could break.
The reading
What carries the argument
The load-bearing object is the post-projection Nadaraya-Watson kernel-regression loss: at any point $x$ of the 2D map, the metric is estimated as $\hat{s}(x)=\sum_k K(x-P(e_k)) s_k / \sum_k K(x-P(e_k))$, a weighted average of nearby scores with weights set by a kernel $K$ of projected distance. The paper chooses the adaptive generalized kernel $K(x,\alpha,\beta)=(1+\alpha\|x\|^{2\beta})^{-1}$, a t-distribution-like form whose shape parameters $\alpha$ and $\beta$ are trained jointly with the projection network, motivated by an observed approximate power-law relation between local neighborhood radii in the high-dimensional and low-dimensional spaces. This object does two jobs at once: it turns the continuous metric landscape into a differentiable training signal for the projection, and it lets the contour estimator stretch or sharpen its decay to fit the local geometry of the plane. The complete objective weights the regression error on a held-out split ($w_1=1$, $w_2=0.3$, $\lambda=0.125$) together with the KL neighborhood term; because the projection is an explicit network, new points can be mapped and contours recomputed at finer grid resolutions without retraining, which is what enables zoom and overlay interaction.
What would settle it
Evaluate all methods on a genuinely out-of-distribution set: generate images with a text-to-image model released after the training data was collected, prompt it with a benchmark whose structure differs from HPD's, and measure whether AKRMap's out-of-sample contour MAE advantage over t-SNE (reported as 0.8108 versus 1.4361 for HPSv2) persists under that shift; if the advantage collapses or reverses, the learned power-law kernel and projection are fitted to HPD's specific metric geometry rather than to cross-modal metrics in general. A complementary check that avoids the regression objective altogether is to sample the images in the map's extreme-value regions and test whether the map's score ordering agrees with human pairwise preference judgments.
Extended reading notes
Core claim
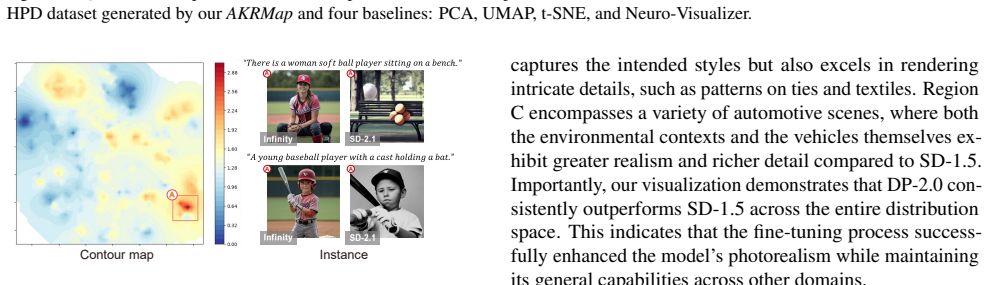
The paper's central claim is that a projection for visualizing cross-modal embeddings can be supervised directly by the accuracy of the metric landscape it produces. AKRMap maps embedding vectors to the plane with a four-layer MLP and, at every position, computes a Nadaraya-Watson kernel-regression estimate of the metric (a weighted local average of nearby points' scores); the network is trained to minimize the weighted mean-square error between these estimates and the true scores at both training points and a held-out validation split drawn fresh each epoch, while a perplexity-free t-SNE KL-divergence term keeps the layout from destroying neighborhood structure. The regression uses the adaptive generalized kernel $K(x,\alpha,\beta)=(1+\alpha\|x\|^{2\beta})^{-1}$, whose decay parameters are learned by backpropagation, on the premise that the kernel shape in the 2D space should adapt rather than be fixed in advance. With that machinery, the experiments report that AKRMap beats PCA, t-SNE, UMAP, SAE, and Neuro-Visualizer on all four tested metrics (CLIPScore, HPSv2, PickScore, Aesthetic Score) for both in-sample and held-out points of the HPD dataset, and that ablations removing either the kernel-regression supervision or the adaptive kernel lose most of the gain. The paper further demonstrates uses of the resulting maps for comparing diffusion-based and autoregressive text-to-image models and for exposing the global effect of fine-tuning, and it reports lower mapping error on text-video and text-/image-audio embeddings.
Load-bearing premise
The load-bearing premise is that minimizing the kernel-regression error of the metric in the projected space is a valid and sufficient definition of 'trustworthy' visualization, the same error the paper reports as its headline result, so if lower contour error did not translate into maps that genuinely reveal where models underperform, the paper's main benefit claim would not follow.
Editorial extensions
If this is right
- On the HPD dataset, AKRMap reduces out-of-sample HPSv2 contour MAE from t-SNE's 1.4361 to 0.8108 (about 43 percent), and it reports the lowest MAE, MAPE, and RMSE among all baselines for CLIPScore, PickScore, and Aesthetic Score as well.
- Ablations show the gain is carried by the kernel-regression supervision: without it the method performs nearly like t-SNE, and without the adaptive kernel the errors roughly double, so both components are doing the work the paper claims.
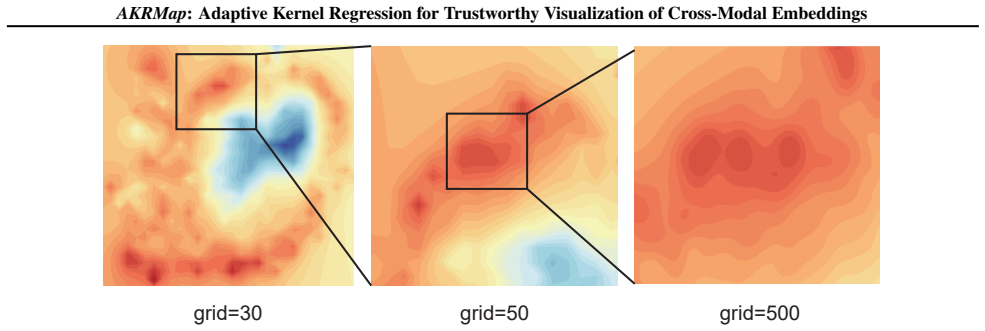
- Because the projection is an explicit network, contour maps can be recomputed at finer grid resolutions during zoom, letting the same visualization serve both a coarse overview and a close-up of a small region; baseline DR methods cannot re-render local detail this way.
- The identical training recipe transfers to other cross-modal pairs: the paper reports reduced mapping error on CLIP text-video embeddings from MSR-VTT and on text-audio and image-audio embeddings from Flickr 8k.
- The learned shape parameters differ by metric in the reported runs ($\beta\approx1.6$ for HPSv2, $\approx3.2$ for CLIPScore, $\approx1.1$ for Aesthetic Score), indicating the adaptive kernel is genuinely fitting metric-specific landscape geometry rather than settling on one fixed decay.
Reading between the lines
- The paper's headline numbers measure the same post-projection kernel-regression objective the network is trained on, so they establish internal consistency more than independent truth; an external check the paper leaves implicit would be to validate the map's extreme regions against human preference ratings, separating 'internally accurate' from 'trustworthy in use.'
- The reported kernel parameters provide a cheap diagnostic that the paper does not exploit: comparing learned $\alpha$ and $\beta$ across metrics and models gives a dataset-independent read of how peaked or heavy-tailed a metric's landscape is in projection space.
- The machinery is not specific to cross-modal metrics: the same post-projection regression supervision could visualize any scalar field over high-dimensional data, such as predictions or risk scores in ordinary regression, or filtering scores for billion-scale pretraining corpora, extensions the paper only sketches.
- The paper's own appendix numbers mark the boundary of the claim: AKRMap's neighborhood trustworthiness (0.828 at n=20) sits below t-SNE's (0.895), so for analyses that target cluster topology rather than metric landscape, the method is intentionally the wrong tool.
Editorial analysis
A structured set of objections, weighed in public.
Referee Report
Summary. The paper introduces AKRMap, a supervised dimensionality reduction method for visualizing cross-modal embedding metrics such as CLIPScore and HPSv2. AKRMap trains a projection network using a Nadaraya-Watson kernel regression loss in the projected 2D space, jointly optimizing an adaptive generalized kernel (Eq. 6) together with the projection, while also incorporating a t-SNE style neighborhood-preservation loss (Eq. 4). The authors present quantitative comparisons on the HPD dataset for four metrics (Table 1) and on additional text-video and text-audio datasets (Appendix F), reporting that AKRMap achieves lower mapping errors than PCA, t-SNE, UMAP, SAE, and Neuro-Visualizer. The paper also describes an interactive visualization tool with scatterplot, contour map, zoom, and overlay views, and includes ablation studies, neighborhood-preservation statistics, and a small user study of the interactive features.
Significance. If the reported comparisons are valid, AKRMap makes a useful contribution to metric-aware embedding visualization: the idea of coupling the projection with a post-projection kernel regression loss and learning the kernel shape jointly is sensible and goes beyond standard unsupervised DR. The paper ships publicly available code and a demo, and the experimental breadth (multiple metrics, multiple datasets, ablations, and an interactive user study) is a strength. The results suggest that supervised, metric-aware DR can substantially reduce contour-estimation error, which is relevant for human-in-the-loop evaluation of text-to-image models. The main reservations are that the out-of-sample evaluation protocol for nonparametric baselines is underspecified and that the evaluation metric coincides with the training loss, so the significance of the quantitative claims depends on how those two points are resolved.
major comments (3)
- [Section 5.1, Table 1] The out-of-sample evaluation for t-SNE and UMAP is underspecified. Neither sklearn's Barnes-Hut t-SNE nor umap-learn provides a native mapping for held-out points, and the paper does not state how test embeddings obtain 2D coordinates in the comparison of Table 1. If the test points are included in the t-SNE/UMAP fit, the comparison is not out-of-sample; if a surrogate mapping (kNN interpolation, a second fit, or a parametric copy) is used, that surrogate is unvalidated and can dominate the reported error. In addition, the 'distance threshold to cut off empty areas' (Section 5.1) could remove test points from the error calculation, biasing the results. Since this protocol is load-bearing for the claim that AKRMap outperforms existing DR methods, it should be specified precisely, and ideally the paper should report results under both a joint-fit protocol and a genuine out-of-sample mapping protocol for the nonparametric baselines.
- [Section 4.1.1, Eq. (2)-(3) and Section 5.1, Table 1] The primary evaluation metric coincides with the training loss. The regression loss in Eq. (3) is the weighted MSE of the Nadaraya-Watson estimator, and Table 1 reports MAE, MAPE, and RMSE of that same estimator on held-out test points. Because AKRMap jointly optimizes the projection and kernel parameters to minimize this loss, the reported improvement over unsupervised baselines (e.g., the 43% HPSv2 MAE reduction in Table 1) is partly a consequence of aligning the objective with the evaluation. To support the claim of more trustworthy visualizations, the paper should include a supervised baseline optimized for the same objective (e.g., parametric t-SNE or UMAP with a regression head) or an independent evaluation of visualization quality, such as a user study comparing contour maps across methods. The current user study (Appendix H) rates AKRMap alone and does not compare against baselines.
- [Section 5.1, Table 1] The quantitative results lack variance information. t-SNE and UMAP are stochastic, and AKRMap itself depends on random initialization and batch sampling; Table 1 reports only point estimates with no standard deviation, confidence intervals, or significance testing. The claimed improvements (for instance, MAE 0.8108 vs. 1.4361 for HPSv2) should be accompanied by run-to-run variability over multiple seeds so that the reader can assess whether the differences are robust. This is especially important because the gains vary substantially across metrics and because the ablation and hyperparameter tables (e.g., Table 7) show non-monotonic behavior.
minor comments (4)
- [Section 5.1, Ablation Study] The text refers to 'AKRMap (w/o GR)' but Table 1 and Figure 13 use 'AKRMap (w/o GK)'; please make the notation consistent.
- [Appendix I] The convergence discussion is informal. Condition (2) requires α to increase with sample size N, but the authors report only single learned α values and do not demonstrate any scaling behavior across dataset sizes. The invocation of the Implicit Function Theorem to justify smoothness is not explained, since no implicit function is defined in the text. These claims should be either substantiated or softened.
- [Section 4.2] The statement that the zoom feature is 'unique to AKRMap and not achievable with traditional DR methods' is overstated, since any parametric projection (e.g., parametric t-SNE or an autoencoder) can in principle recompute contours at different grid resolutions; rephrase to avoid overclaiming.
- [References] The reference 'W˛ eglarczyk, S.' contains unrendered or corrupted Polish diacritics; the citation encoding should be fixed.
Circularity Check
No significant circularity: the training loss and test metric are the same supervised objective, but test points are held out and independent.
full rationale
AKRMap's projection and adaptive-kernel parameters are trained by minimizing the post-projection Nadaraya-Watson MSE (Eqs. 1-3, 5) on a random 9:1 train/validation split, and the headline numbers in Table 1 report mae/rmse/mape on the separate HPD test set (3,700 images). Test points are neither used to fit the projection nor to estimate contours: the projection network is an explicit parametric map, and Eq. 1's estimator uses training labels only, so the test evaluation is a standard held-out supervised regression benchmark rather than a re-application of the training objective to the fitted data. The adaptive kernel (Eq. 6) is a learnable parametric family whose power-law motivation is an external citation (Narayan et al., 2021), not a self-citation, and the authors explicitly label the extension as a hypothesis. Self-citations (Ye et al., 2024; 2025) appear only in related-work context and are not load-bearing. The under-specification of how nonparametric baselines (t-SNE, UMAP) assign 2D coordinates to out-of-sample test points is a legitimate experimental-design/comparability concern, but it is not a circular self-reference in AKRMap's derivation chain. No step meets the required bar of Eq-for-Eq reduction or a fitted parameter renamed as a prediction.
Assumptions & free parameters
free parameters (4)
- lambda (loss weight) =
0.125
- w1, w2 (train-val MSE weights) =
1 and 0.3
- alpha (kernel scale) =
e.g., 68.57 for HPSv2, 104.70 for CLIPScore
- beta (kernel exponent) =
e.g., 1.61 for HPSv2, 3.18 for CLIPScore
assumptions (4)
- standard math Nadaraya-Watson kernel regression is an appropriate model for estimating the metric landscape in the projected 2D space.
- domain assumption A power-law relationship between low-dimensional and high-dimensional local radii (Narayan et al. 2021) motivates the adaptive generalized kernel form K = (1 + alpha ||x||^{2 beta})^{-1}.
- domain assumption The metric function is sufficiently smooth (e.g., Lipschitz continuous) in the projected space, and alpha grows with sample size for consistency.
- standard math The perplexity-free t-SNE KL implementation preserves the neighborhood information needed for the constraint term.
Cite this review
Pith. "Pith review of AKRMap: Adaptive Kernel Regression for Trustworthy Visualization of Cross-Modal Embeddings." pith.science (2026). https://pith.science/paper/SWRK5UVL
@misc{pith2026250514664,
  author       = {Pith},
  title        = {Pith review of: AKRMap: Adaptive Kernel Regression for Trustworthy Visualization of Cross-Modal Embeddings},
  year         = {2026},
  howpublished = {\url{https://pith.science/paper/SWRK5UVL}},
  note         = {Machine review of arXiv:2505.14664}
}
read the original abstract
Cross-modal embeddings form the foundation for multi-modal models. However, visualization methods for interpreting cross-modal embeddings have been primarily confined to traditional dimensionality reduction (DR) techniques like PCA and t-SNE. These DR methods primarily focus on feature distributions within a single modality, whilst failing to incorporate metrics (e.g., CLIPScore) across multiple modalities. This paper introduces AKRMap, a new DR technique designed to visualize cross-modal embeddings metric with enhanced accuracy by learning kernel regression of the metric landscape in the projection space. Specifically, AKRMap constructs a supervised projection network guided by a post-projection kernel regression loss, and employs adaptive generalized kernels that can be jointly optimized with the projection. This approach enables AKRMap to efficiently generate visualizations that capture complex metric distributions, while also supporting interactive features such as zoom and overlay for deeper exploration. Quantitative experiments demonstrate that AKRMap outperforms existing DR methods in generating more accurate and trustworthy visualizations. We further showcase the effectiveness of AKRMap in visualizing and comparing cross-modal embeddings for text-to-image models. Code and demo are available at https://github.com/yilinye/AKRMap.
Figures


Figures from the paper (12 more)







Reference graph
Works this paper leans on
-
[1]
write newline
" write newline "" before.all 'output.state := FUNCTION n.dashify 't := "" t empty not t #1 #1 substring "-" = t #1 #2 substring "--" = not "--" * t #2 global.max substring 't := t #1 #1 substring "-" = "-" * t #2 global.max substring 't := while if t #1 #1 substring * t #2 global.max substring 't := if while FUNCTION format.date year duplicate empty "emp...
-
[2]
Abdi, H. and Williams, L. J. Principal component analysis. Wiley Interdisciplinary Reviews: Computational Statistics, 2 0 (4): 0 433--459, 2010
work page 2010
-
[3]
Ali, T. H., Hayawi, H. A. A.-M., and Botani, D. S. I. Estimation of the bandwidth parameter in nadaraya-watson kernel non-parametric regression based on universal threshold level. Communications in Statistics-Simulation and Computation, 52 0 (4): 0 1476--1489, 2023
work page 2023
-
[4]
Cheng, S. and Mueller, K. The data context map: Fusing data and attributes into a unified display. IEEE Transactions on Visualization and Computer Graphics, 22 0 (1): 0 121--130, 2015
work page 2015
-
[5]
Understanding the source of semantic regularities in word embeddings
Chiang, H.-Y., Camacho-Collados, J., and Pardos, Z. Understanding the source of semantic regularities in word embeddings. In Proceedings of the Conference on Computational Natural Language Learning, pp.\ 119--131, 2020
work page 2020
-
[6]
Perplexity-free parametric t-sne
Crecchi, F., De Bodt, C., Verleysen, M., Lee, J., Bacciu, D., et al. Perplexity-free parametric t-sne. In European Symposium on Artificial Neural Networks, Computational Intelligence and Machine Learning, pp.\ 387--392, 2020
work page 2020
-
[7]
Damrich, S., B \"o hm, N., Hamprecht, F. A., and Kobak, D. From t -sne to umap with contrastive learning. In The International Conference on Learning Representations, 2023
work page 2023
-
[8]
De Bodt, C., Mulders, D., Verleysen, M., and Lee, J. A. Perplexity-free t-sne and twice student tt-sne. In European Symposium on Artificial Neural Networks, pp.\ 123--128, 2018
work page 2018
Show all 52 references
-
[9]
Dreamlike photoreal 2.0 - a photorealistic model based on stable diffusion 1.5, 2024
dreamlike.art. Dreamlike photoreal 2.0 - a photorealistic model based on stable diffusion 1.5, 2024. URL https://huggingface.co/dreamlike-art/dreamlike-photoreal-2.0
2024
-
[10]
and Karpatne, A
Elhamod, M. and Karpatne, A. Neuro-visualizer: A novel auto-encoder-based loss landscape visualization method with an application in knowledge-guided machine learning. In International Conference on Machine Learning, 2024
2024
-
[11]
Parametric nonlinear dimensionality reduction using kernel t-sne
Gisbrecht, A., Schulz, A., and Hammer, B. Parametric nonlinear dimensionality reduction using kernel t-sne. Neurocomputing, 147: 0 71--82, 2015
2015
-
[12]
Manifold learning: The price of normalization
Goldberg, Y., Zakai, A., Kushnir, D., and Ritov, Y. Manifold learning: The price of normalization. Journal of Machine Learning Research, 9 0 (8), 2008
2008
-
[13]
A new supervised t-SNE with dissimilarity measure for effective data visualization and classification
Hajderanj, L., Weheliye, I., and Chen, D. A new supervised t-SNE with dissimilarity measure for effective data visualization and classification. In Proceedings of the International Conference on Software and Information Engineering, pp.\ 232--236, 2019
2019
-
[14]
Infinity: Scaling bitwise autoregressive modeling for high-resolution image synthesis
Han, J., Liu, J., Jiang, Y., Yan, B., Zhang, Y., Yuan, Z., Peng, B., and Liu, X. Infinity: Scaling bitwise autoregressive modeling for high-resolution image synthesis. arXiv preprint arXiv:2412.04431, 2024
2024 arXiv
-
[15]
and Glass, J
Harwath, D. and Glass, J. Deep multimodal semantic embeddings for speech and images. In IEEE Workshop on Automatic Speech Recognition and Understanding, pp.\ 237--244. IEEE, 2015
2015
-
[16]
CLIPScore : A reference-free evaluation metric for image captioning
Hessel, J., Holtzman, A., Forbes, M., Le Bras, R., and Choi, Y. CLIPScore : A reference-free evaluation metric for image captioning. In Proceedings of the 2021 Conference on Empirical Methods in Natural Language Processing, pp.\ 7514--7528, 2021
2021
-
[17]
Gans trained by a two time-scale update rule converge to a local nash equilibrium
Heusel, M., Ramsauer, H., Unterthiner, T., Nessler, B., and Hochreiter, S. Gans trained by a two time-scale update rule converge to a local nash equilibrium. Advances in Neural Information Processing Systems, 30, 2017
2017
-
[18]
Scaling up visual and vision-language representation learning with noisy text supervision
Jia, C., Yang, Y., Xia, Y., Chen, Y.-T., Parekh, Z., Pham, H., Le, Q., Sung, Y.-H., Li, Z., and Duerig, T. Scaling up visual and vision-language representation learning with noisy text supervision. In International Conference on Machine Learning, pp.\ 4904--4916. PMLR, 2021
2021
-
[19]
a , J., Oja, M., Venna, J., T \
Kaski, S., Nikkil \"a , J., Oja, M., Venna, J., T \"o r \"o nen, P., and Castr \'e n, E. Trustworthiness and metrics in visualizing similarity of gene expression. BMC Bioinformatics, 4 0 (1): 0 1--13, 2003. doi:https://doi.org/10.1186/1471-2105-4-48
2003 doi
-
[20]
Pick-a-pic: An open dataset of user preferences for text-to-image generation
Kirstain, Y., Polyak, A., Singer, U., Matiana, S., Penna, J., and Levy, O. Pick-a-pic: An open dataset of user preferences for text-to-image generation. In Thirty-seventh Conference on Neural Information Processing Systems, 2023
2023
-
[21]
Supervised autoencoders: Improving generalization performance with unsupervised regularizers
Le, L., Patterson, A., and White, M. Supervised autoencoders: Improving generalization performance with unsupervised regularizers. Advances in Neural Information Processing Systems, 31, 2018
2018
-
[22]
Visualizing the loss landscape of neural nets
Li, H., Xu, Z., Taylor, G., Studer, C., and Goldstein, T. Visualizing the loss landscape of neural nets. Advances in Neural Information Processing Systems, 31, 2018
2018
-
[23]
W., Zhang, Y., Kwon, Y., Yeung, S., and Zou, J
Liang, V. W., Zhang, Y., Kwon, Y., Yeung, S., and Zou, J. Y. Mind the gap: Understanding the modality gap in multi-modal contrastive representation learning. Advances in Neural Information Processing Systems, 35: 0 17612--17625, 2022
2022
-
[24]
Lin, T.-Y., Maire, M., Belongie, S., Hays, J., Perona, P., Ramanan, D., Doll \'a r, P., and Zitnick, C. L. Microsoft COCO : Common objects in context. In Computer Vision--ECCV 2014: 13th European Conference, Zurich, Switzerland, September 6-12, 2014, Proceedings, Part V 13, pp...
2014
-
[25]
UMAP : Uniform manifold approximation and projection
McInnes, L., Healy, J., Saul, N., and Gro berger, L. UMAP : Uniform manifold approximation and projection. Journal of Open Source Software, 3 0 (29): 0 861, 2018
2018
-
[26]
S., and Dean, J
Mikolov, T., Sutskever, I., Chen, K., Corrado, G. S., and Dean, J. Distributed representations of words and phrases and their compositionality. Advances in Neural Information Processing Systems, 26, 2013
2013
-
[27]
Assessing single-cell transcriptomic variability through density-preserving data visualization
Narayan, A., Berger, B., and Cho, H. Assessing single-cell transcriptomic variability through density-preserving data visualization. Nature Biotechnology, 39 0 (6): 0 765--774, 2021
2021
-
[28]
W., Hallacy, C., Ramesh, A., Goh, G., Agarwal, S., Sastry, G., Askell, A., Mishkin, P., Clark, J., et al
Radford, A., Kim, J. W., Hallacy, C., Ramesh, A., Goh, G., Agarwal, S., Sastry, G., Askell, A., Mishkin, P., Clark, J., et al. Learning transferable visual models from natural language supervision. In International Conference on Machine Learning, pp.\ 8748--8763. PMLR, 2021
2021
-
[29]
Hierarchical text-conditional image generation with clip latents
Ramesh, A., Dhariwal, P., Nichol, A., Chu, C., and Chen, M. Hierarchical text-conditional image generation with clip latents. arXiv preprint arXiv:2204.06125, 1 0 (2): 0 3, 2022
2022 arXiv
-
[30]
High-resolution image synthesis with latent diffusion models
Rombach, R., Blattmann, A., Lorenz, D., Esser, P., and Ommer, B. High-resolution image synthesis with latent diffusion models. In Proceedings of the IEEE/CVF Conference on Computer Vision and Pattern Recognition, pp.\ 10684--10695, 2022
2022
-
[31]
Sainburg, T., McInnes, L., and Gentner, T. Q. Parametric umap embeddings for representation and semisupervised learning. Neural Computation, 33 0 (11): 0 2881--2907, 2021
2021
-
[32]
Improved techniques for training gans
Salimans, T., Goodfellow, I., Zaremba, W., Cheung, V., Radford, A., and Chen, X. Improved techniques for training gans. Advances in Neural Information Processing Systems, 29, 2016
2016
-
[33]
o lkopf, B., Smola, A., and M \
Sch \"o lkopf, B., Smola, A., and M \"u ller, K.-R. Kernel principal component analysis. In International Conference on Artificial Neural Networks, pp.\ 583--588. Springer, 1997
1997
-
[34]
Laion-5b: An open large-scale dataset for training next generation image-text models
Schuhmann, C., Beaumont, R., Vencu, R., Gordon, C., Wightman, R., Cherti, M., Coombes, T., Katta, A., Mullis, C., Wortsman, M., et al. Laion-5b: An open large-scale dataset for training next generation image-text models. Advances in Neural Information Processing Systems, 35: 0...
2022
-
[35]
Silverman, B. W. Density estimation for statistics and data analysis. Routledge, 2018
2018
-
[36]
Accelerating t-sne using tree-based algorithms
Van Der Maaten, L. Accelerating t-sne using tree-based algorithms. The Journal of Machine Learning Research, 15 0 (1): 0 3221--3245, 2014
2014
-
[37]
and Hinton, G
Van der Maaten, L. and Hinton, G. Visualizing data using t-sne. Journal of Machine Learning Research, 9 0 (11), 2008
2008
-
[38]
VIS+AI : integrating visualization with artificial intelligence for efficient data analysis
Wang, X., Wu, Z., Huang, W., Wei, Y., Huang, Z., Xu, M., and Chen, W. VIS+AI : integrating visualization with artificial intelligence for efficient data analysis. Frontiers of Computer Science, 17 0 (6): 0 176709, 2023 a
2023
-
[39]
J., Hohman, F., and Chau, D
Wang, Z. J., Hohman, F., and Chau, D. H. WizMap : Scalable interactive visualization for exploring large machine learning embeddings. In Proceedings of the 61st Annual Meeting of the Association for Computational Linguistics (Volume 3: System Demonstrations), pp.\ 516--523, 2023 b
2023
-
[40]
J., Montoya, E., Munechika, D., Yang, H., Hoover, B., and Chau, D
Wang, Z. J., Montoya, E., Munechika, D., Yang, H., Hoover, B., and Chau, D. H. DiffusionDB : A large-scale prompt gallery dataset for text-to-image generative models. In Proceedings of the Annual Meeting of the Association for Computational Linguistics (Volume 1: Long Papers),...
2023
-
[41]
Kernel density estimation and its application
W e glarczyk, S. Kernel density estimation and its application. In ITM Web of Conferences, volume 23, pp.\ 00037. EDP Sciences, 2018
2018
-
[42]
Human preference score v2: A solid benchmark for evaluating human preferences of text-to-image synthesis
Wu, X., Hao, Y., Sun, K., Chen, Y., Zhu, F., Zhao, R., and Li, H. Human preference score v2: A solid benchmark for evaluating human preferences of text-to-image synthesis. arXiv preprint arXiv:2306.09341, 2023 a
2023 arXiv
-
[43]
Human preference score: Better aligning text-to-image models with human preference
Wu, X., Sun, K., Zhu, F., Zhao, R., and Li, H. Human preference score: Better aligning text-to-image models with human preference. In Proceedings of the IEEE/CVF International Conference on Computer Vision, pp.\ 2096--2105, 2023 b
2023
-
[44]
Interactive visual cluster analysis by contrastive dimensionality reduction
Xia, J., Huang, L., Lin, W., Zhao, X., Wu, J., Chen, Y., Zhao, Y., and Chen, W. Interactive visual cluster analysis by contrastive dimensionality reduction. IEEE Transactions on Visualization and Computer Graphics, 29 0 (1): 0 734--744, 2023
2023
-
[45]
L., and Zhu, M
Xia, J., Huang, L., Sun, Y., Deng, Z., Zhang, X. L., and Zhu, M. A parallel framework for streaming dimensionality reduction. IEEE Transactions on Visualization and Computer Graphics, 30 0 (1): 0 142--152, 2024
2024
-
[46]
MSR-VTT : A large video description dataset for bridging video and language
Xu, J., Mei, T., Yao, T., and Rui, Y. MSR-VTT : A large video description dataset for bridging video and language. In Proceedings of the IEEE Conference on Computer Vision and Pattern Recognition, pp.\ 5288--5296, 2016
2016
-
[47]
Imagereward: Learning and evaluating human preferences for text-to-image generation
Xu, J., Liu, X., Wu, Y., Tong, Y., Li, Q., Ding, M., Tang, J., and Dong, Y. Imagereward: Learning and evaluating human preferences for text-to-image generation. Advances in Neural Information Processing Systems, 36, 2024
2024
-
[48]
Generative AI for visualization: State of the art and future directions
Ye, Y., Hao, J., Hou, Y., Wang, Z., Xiao, S., Luo, Y., and Zeng, W. Generative AI for visualization: State of the art and future directions. Visual Informatics, 8 0 (2): 0 43--66, 2024
2024
-
[49]
ModalChorus : Visual probing and alignment of multi-modal embeddings via modal fusion map
Ye, Y., Xiao, S., Zeng, X., and Zeng, W. ModalChorus : Visual probing and alignment of multi-modal embeddings via modal fusion map. IEEE Transactions on Visualization and Computer Graphics, 31 0 (1): 0 294--304, 2025
2025
-
[50]
Y., Luong, T., Baid, G., Wang, Z., Vasudevan, V., Ku, A., Yang, Y., Ayan, B
Yu, J., Xu, Y., Koh, J. Y., Luong, T., Baid, G., Wang, Z., Vasudevan, V., Ku, A., Yang, Y., Ayan, B. K., et al. Scaling autoregressive models for content-rich text-to-image generation. Transactions on Machine Learning Research, 2022
2022
-
[51]
Learning multi-dimensional human preference for text-to-image generation
Zhang, S., Wang, B., Wu, J., Li, Y., Gao, T., Zhang, D., and Wang, Z. Learning multi-dimensional human preference for text-to-image generation. In Proceedings of the IEEE/CVF Conference on Computer Vision and Pattern Recognition, pp.\ 8018--8027, 2024
2024
-
[52]
CodeBERTScore : Evaluating code generation with pretrained models of code
Zhou, S., Alon, U., Agarwal, S., and Neubig, G. CodeBERTScore : Evaluating code generation with pretrained models of code. In Proceedings of the Conference on Empirical Methods in Natural Language Processing, pp.\ 13921--13937, 2023
2023
Reviewed August 7, 2026 · model on record in the stance chip above.
Discussion (0). Continue with ORCID to comment.