REVIEW 5 major objections 5 minor 1 cited by
This paper provides a complete census of all 18,660 astrophysics preprints posted in 2025 and uses them to map the field's topics, instruments, collaborations, citations, and publishing costs.
Reviewed by Pith at T0; open to challenge. T0 means a machine referee read the full paper against a public rubric. the ladder, T0–T4 →
T0 review · deepseek-v4-flash
2026-08-03 00:09 UTC pith:THENSXNK
load-bearing objection Useful descriptive census of 2025 astro-ph, but the telescope ranking is known-wrong by the authors' own LIGO check, and the promised spectral fingerprint is missing. the 5 major comments →
Astrophysics Wrapped 2025: Year-in-Review of Every Astrophysics arXiv Paper from 2025
The pith
A machine-rendered reading of the paper's core claim, the machinery that carries it, and where it could break.
Core claim
The central claim is that this report provides a complete, high-fidelity dataset of all papers uploaded to the astrophysics section of the preprint server during 2025, with a unique set of metrics derived from each paper's metadata. Using daily collection of new submissions, the authors count 18,660 papers, up from 16,333 the previous year. They compute citation indices per paper, per telescope, per keyword, per subfield, and per journal; they define four collaboration indices to characterize how local or international research teams are; they estimate the total cost of publishing fees; and they present a first-of-its-kind spectral fingerprint showing how research is distributed across the e
What carries the argument
The carrying mechanism is a set of hand-built name lists—about 40 telescopes, roughly 100 subfields, keywords, and object-nomenclature patterns such as 'GW' plus six digits, Messier/NGC patterns, and exoplanet naming conventions—matched by string matching against every paper's title and abstract. To make comparisons quantitative, the paper defines four collaboration indices (Local Collaborative Index, Local Collaborative Ratio, Global Collaborative Index, Non-repeated Global Collaborative Index) and four citation indices (All Articles Citation, Journal Articles Citation, Excluding-Self variants), which together let the authors rank categories by how often they are cited and how locally or in
Load-bearing premise
The load-bearing premise is that matching hand-built lists of telescope and object names against titles and abstracts faithfully captures what a paper studies or which instrument it uses; the authors themselves call this 'not the most robust way' and report a false positive in which an Apple M1 chip was counted as Messier 1.
What would settle it
Take a random sample of 200 papers, read their full text, and compare each paper's telescope and object mentions with the string-matching result; if the discrepancy rate exceeds a few percent, the rankings would be unreliable. The paper's own M1-as-Messier-1 example shows the test is sensitive enough to detect such errors.
If this is right
- Field output rose to 18,660 new astrophysics preprints in 2025, with September and October the most productive months.
- JWST was the most-mentioned telescope, while Einstein Probe and LIGO papers had the highest citation averages; the gravitational-wave community concentrated on a small number of events, while the exoplanet community spread across 512 different objects.
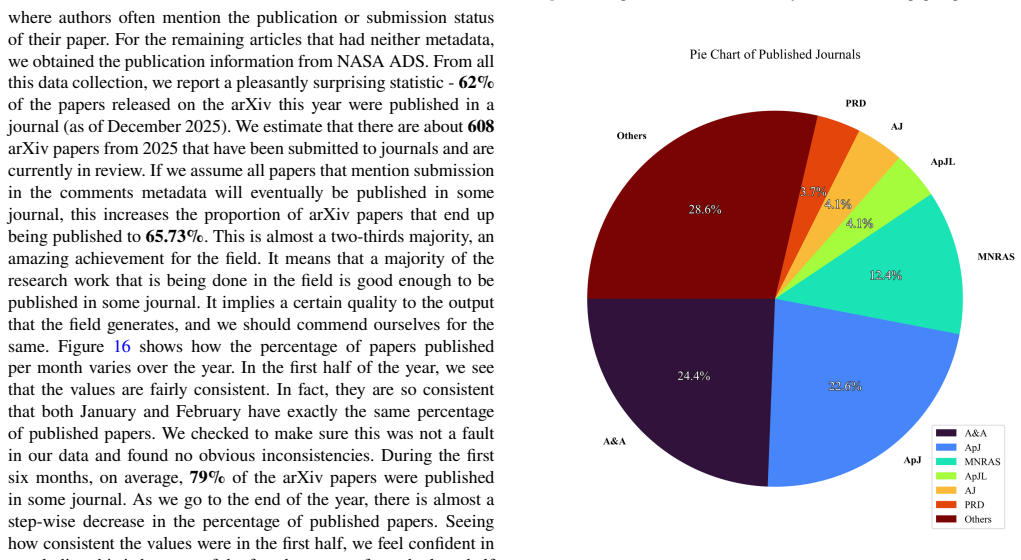
- About 80% of the year's preprints eventually appear in a journal, with Astronomy and Astrophysics, the Astrophysical Journal, and Monthly Notices of the Royal Astronomical Society the top venues.
- Publishing costs are estimated at 17 million USD paid in 2025, or 45 million USD if every paper paid the average fee; authors paid roughly 500–700 USD per citation.
- The typical paper has about 10 authors, roughly two-thirds from the first author's country, and most collaboration is bilateral; US and China authors together make up over a third of the field.
- Citation density varies sharply by subfield: cosmology papers average 4.83 citations per paper while instrumentation papers average 1.06, even though galaxy papers dominate publication counts.
Where Pith is reading between the lines
- Repeated annually, the same pipeline would produce the first continuous time series of field-level priorities, making shifts in instrument use, object focus, and collaboration patterns measurable rather than anecdotal.
- Because the matching method sees only titles and abstracts and ignores cross-submissions and replacements, the telescope and object counts are best read as lower bounds; full-text or embedding-based matching could recover missed mentions and eliminate false positives like the admitted Apple M1 chip counted as Messier 1.
- The collaboration indices could be tested against a null model: randomly reshuffle author-country assignments and see whether the observed local-versus-global distributions differ meaningfully from chance, which would quantify whether the 'local first' pattern is a real signal.
- The cost-per-citation estimates assume full use of discounts and ignore institutional agreements; combining this paper's data with actual invoice data would bracket the true financial burden on the community.
Editorial analysis
A structured set of objections, weighed in public.
Referee Report
Summary. The paper presents a year-in-review census of all 18,660 astro-ph arXiv papers submitted in 2025. It compiles counts and rankings of keywords, subfields, telescopes, objects (GW, GRB, FRB, supernovae, pulsars, exoplanets, Messier/NGC), journals, author affiliations, collaboration indices, citation metrics, and publication costs. The authors define several transparent indices (LCI, LCR, GCI, NGCI, AAC/JAC/EAAC/EJAC) and apply them to the collected metadata. The central claim, stated in §2.1, is that the dataset is 'complete, high fidelity,' and the paper presents it as a holistic statistical summary of the field for 2025. The manuscript is candid about some limitations, such as incomplete affiliation coverage (57%) and the use of string matching for object/telescope identification, but several of these limitations are load-bearing for the paper's main deliverable.
Significance. If the census were reliable, it would be a useful community resource: a single quantitative snapshot of what the field studied, with which instruments, from where, and at what cost. The paper's strengths include the transparent definition of collaboration and citation indices, the broad scope of metadata collection, and the honest acknowledgment that the telescope/object matching is not the most robust method. However, the paper's value rests on the accuracy of its rankings, and the manuscript itself provides counterexamples where the string-matching pipeline produces known errors that are not corrected in the reported results. The statistical interpretation also contains a clear error. With corrections, quantified validation, and release of the underlying matching lists and counts, this could be a credible reference census; in its current form, the central 'high-fidelity' claim is not yet established.
major comments (5)
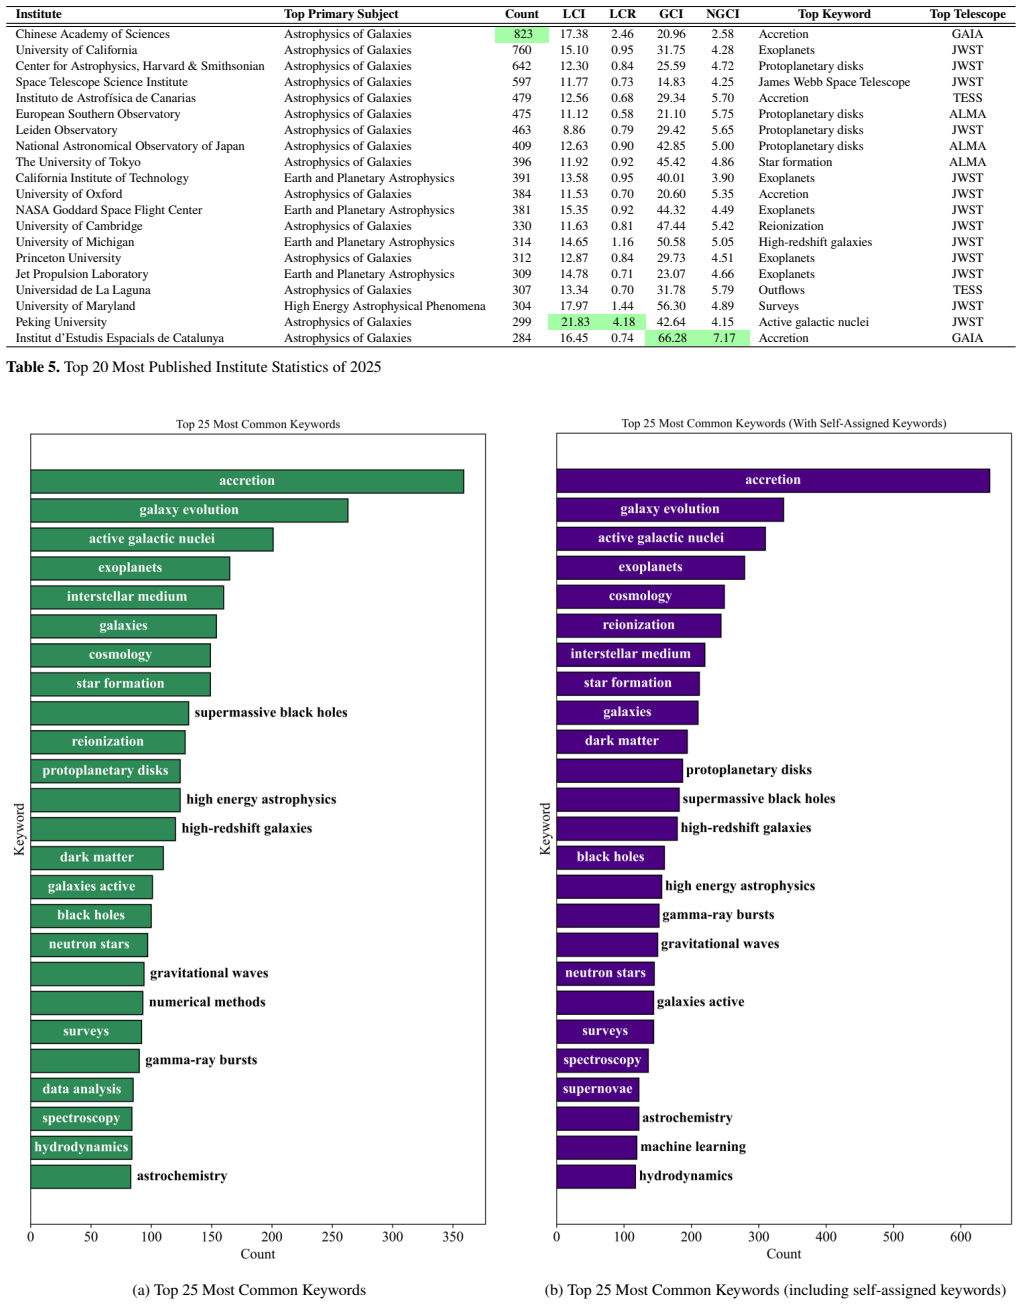
- [§3.2, Fig. 1, Table 3] The telescope rankings, a central deliverable, rest on unvalidated string matching. The paper itself demonstrates a systematic false-negative: searching for the GWXXXXXX event format yields 365 mentions, and the text concludes that LIGO 'should indeed be much higher up on the list, somewhere between Fermi and the Vera C Rubin Observatory.' Yet Fig. 1 and Table 3 are never updated to reflect this. The admitted Apple M1 / Messier 1 false positive (§3.2) shows that errors go in both directions. Without released alias lists and quantified false-positive/false-negative rates, the §2.1 claim of a 'complete, high fidelity dataset' is not supported for the object/telescope/subfield/keyword rankings.
- [§3.9] The KS test is misinterpreted. The text states: 'A simple KS test ... yields KS statistic values≤0.1 with p-values = 0, showing us that there is no significant difference.' A p-value of 0 rejects the null hypothesis of identical distributions at any conventional significance level; it does not show no difference. This error directly affects the conclusions that subfields and journals write similarly long papers with the same numbers of tables and figures. The test should be reinterpreted or replaced with an appropriate comparison, and the conclusions in §3.8-§3.9 revised accordingly.
- [Abstract vs. full text] The abstract advertises 'a first of its kind Astrophysical Spectral Fingerprint showing the distribution of research across the electromagnetic spectrum as well as the distribution of research by redshift.' No such section, figure, or tabulated result appears anywhere in the manuscript. The only redshift-related statistic is the 'Community's Favourite Redshift' and interquartile range in §4. Either the Spectral Fingerprint analysis was intended but omitted, or it should be removed from the abstract. In its current form, a promised headline result is missing.
- [§2.1, §3.4] The collaboration and geolocation statistics are based on affiliations available for only 57% of papers, with country/region information extended to 97% using a LaTeX-based method. The paper asserts that the 57% subset is representative, but provides no quantitative evidence (e.g., coverage by month, primary subject, or author count). The ADS affiliations also reflect December 2025 current positions rather than affiliations at the time of submission. Since LCI/LCR/GCI/NGCI, country rankings, and pairwise collaboration counts are central results, the absence of coverage-bias analysis and uncertainty quantification is a load-bearing gap.
- [§3.6, Fig. 14] Self-assigned keywords are generated by matching title/abstract words against a list of ~1000 frequent author-assigned keywords, and the paper then presents combined 'with self-assigned keywords' rankings as if these two sources are comparable. The paper itself shows that the lists diverge substantially: 'galaxy evolution' is third in the author-assigned list but disappears when self-assigned keywords are included. This demonstrates that the two measures are not interchangeable, yet no validation is provided for the assumption that word-matching generates keywords equivalent to author-assigned ones. The 'with self-assigned' results should be presented as a separate sensitivity analysis or explicitly validated.
minor comments (5)
- [§2.3] In the definition of EAAC, 'the same as the ACC' should read 'the same as the AAC.'
- [§2.2] In the LCR example, '60&' should be '60%'.
- [Appendix A, Figs. A6-A21] Figures A6 through A21 are all captioned 'Histogram of LCI,' which makes them uninformative as printed. If they are intended to show different indices (LCI, LCR, GCI, NGCI), the captions should be corrected.
- [§3.2, Table 3] The text says LIGO is not on the top-10 most-mentioned telescope list, but Table 3 does include LIGO among the telescope citation indices. This is not a contradiction, but the relationship between Fig. 1, Table 3, and the text would be clearer if the table were explicitly described as covering all searched telescopes, not only the top-10 list.
- [§3.3] The statement 'we estimate the community spent 17 million USD' is presented without a breakdown of journal-by-journal assumptions or a sensitivity analysis. A short table listing the top journals, their APCs, and the assumed discount rates would improve reproducibility.
Circularity Check
No circularity: the paper is a transparent data-processing census; its known LIGO matching failure is a validity issue, not a derivation that reduces to its own inputs.
full rationale
The paper's central claim is to present statistics computed from arXiv metadata and title/abstract string matching. There is no fitted model, no derived quantity that is used to predict the same quantity from which it was fit, and no load-bearing self-citation chain. The collaboration and citation indices are explicitly defined (Section 2.2, 2.3) and computed directly from collected data. The one deliberately generative step — assigning 'self-assigned keywords' to papers lacking author keywords by matching title/abstract words against a frequency list built from author-assigned keywords — is disclosed as a processing choice rather than presented as a prediction; the paper clearly separates analyses with and without these self-assigned keywords. The known LIGO undercount (Section 3.2: LIGO absent from the top-10 list yet 'GWXXXXXX' searches yield 365 mentions, so LIGO 'should indeed be much higher up on the list') is an acknowledged accuracy failure in a pattern-matching pipeline, not a circular derivation: the correction is derived from an independent naming convention, not from the telescope ranking itself. Similarly, the Apple M1 counted as Messier 1 is an admitted false positive that does not make the ranking equivalent to its input. Concerns about unquantified false-positive/false-negative rates, unreleased alias lists, and the small-sample caveats for country-level indices are correctness or reproducibility risks, not circularity. The paper does not invoke any uniqueness theorem, does not cite its own prior work as evidence, and does not rename an existing empirical pattern as a derivation. Under the stated rules, an honest non-finding is appropriate: score 0.
Axiom & Free-Parameter Ledger
free parameters (6)
- Self-assigned keyword count per paper =
3
- Top-keyword list size =
~1000
- Telescope name list size =
40
- Subfield list size =
~100
- Large-team author cutoffs =
30 and 20 authors
- Average publication cost per paper =
$2,400
axioms (4)
- domain assumption String matching of telescope and object names in titles/abstracts is a valid proxy for what instruments and targets a paper actually uses.
- domain assumption The 57% affiliation sample is representative of the full 18,660-paper dataset.
- domain assumption NASA ADS citation counts as of December 2025 are an accurate measure of a 2025 paper's influence.
- ad hoc to paper Self-assigned keywords generated from title/abstract word matching are comparable to author-assigned keywords.
invented entities (1)
-
Astrophysical Spectral Fingerprint
no independent evidence
read the original abstract
Astrophysics has experienced an overwhelming increase in research output, as is evident from the year-over-year increase in the number of research papers submitted to the online repository arXiv. As a result, keeping up with progress happening outside our respective sub-fields can be exhausting. While it is impossible to be informed on every single aspect of every sub-field, this paper aims to be the next best thing. We present a summary of statistics for every paper uploaded onto the Astrophysics arXiv over the past year - 2025. We analyse a host of metrics like the most used keywords, subfields and telescopes, the distribution of journals, the most studied astrophysical objects like GW, GRB, FRB events, exoplanets and much more. We also indexed the authors' affiliations to put into context the global distribution of research and collaboration. Combining this data with the citation information of each paper allows us to understand how influential different papers have been on the progress of the field this year. We also present a first of its kind Astrophysical Spectral Fingerprint showing the distribution of research across the electromagnetic spectrum as well as the distribution of research by redshift. Overall, these statistics highlight the general current state of the field, the hot topics people are working on and the different research communities across the globe and how they function. We hope that this is helpful for both students and professionals alike to adapt their current trajectories to better benefit the field.
Figures






Forward citations
Cited by 1 Pith paper
-
Calibration database design for the wide-field X-ray telescope on board the Einstein Probe
The WXT CALDB is a HEASARC/OGIP-compliant database of per-CMOS calibration files — bias, gain, bad pixels, effective area, response matrices, PSF and vignetting — with in-orbit updates validated against the Crab and Cas A.
Reference graph
Works this paper leans on
-
[1]
We also have the table of the top keyword and top sub-field for every country or region in our dataset at the very end
Coles P., 2025, Like a million pounds: Published by The Open Journal of Astrophysics,https://astro.theoj.org/post/ 3602-like-a-million-pounds 20 Figure A1.Histogram of LCI Figure A2.Histogram of LCR Figure A3.Histogram of GCI APPENDIX A: ADDITIONAL PLOTS Here we present some plots that we found interesting and might be interesting to some of the readers. ...
2025
discussion (0)
Sign in with ORCID, Apple, or X to comment. Anyone can read and Pith papers without signing in.