Tilting at the Turnover: Modeling the Faint-End of the UV Luminosity Function Behind Abell s1063 with JWST
Pith reviewed 2026-07-02 08:36 UTC · model grok-4.3
The pith
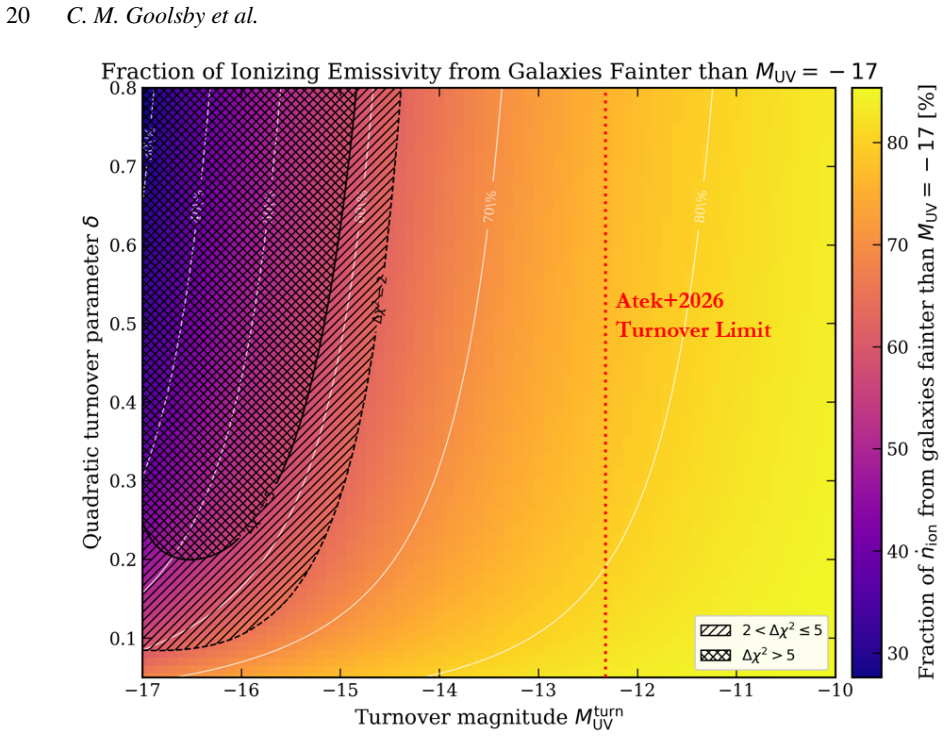
Galaxies fainter than M_UV=-17 supply more than half the UV luminosity density and at least 64% of ionizing photons at z=6.
A machine-rendered reading of the paper's core claim, the machinery that carries it, and where it could break.
Core claim
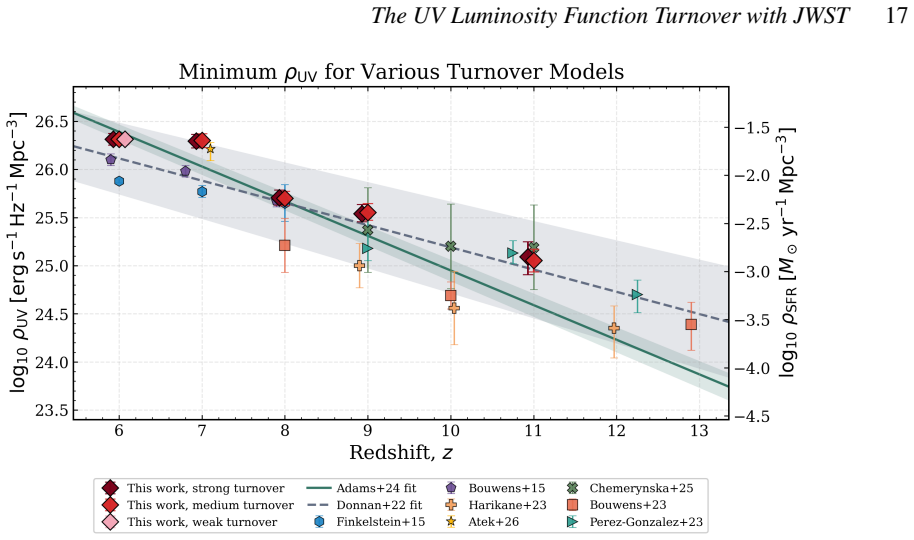
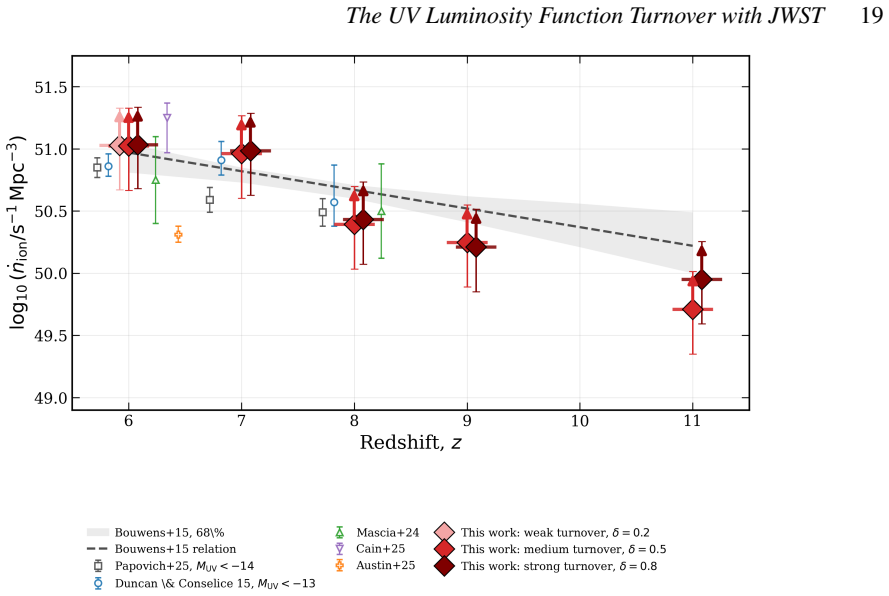
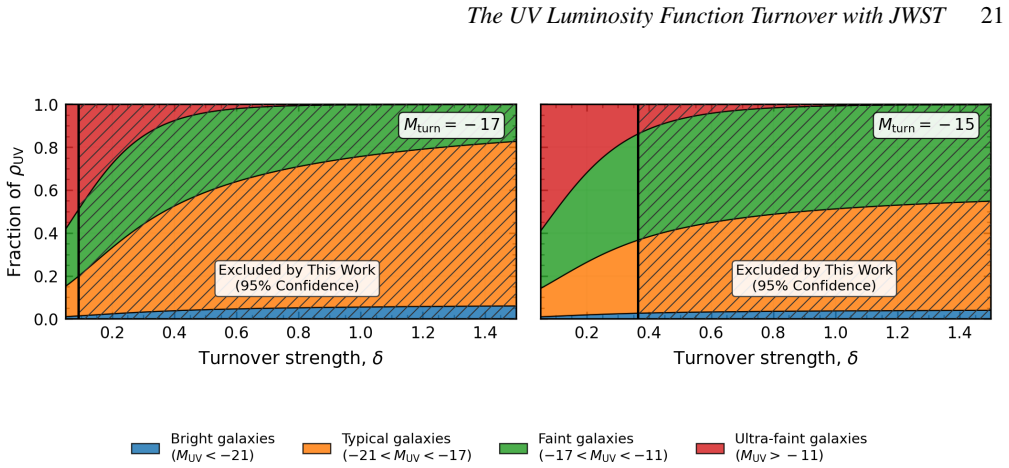
By constructing a photometric catalogue of lensed high-redshift candidates and modeling the UVLF turnover as a gradual quadratic suppression rather than a hard cutoff, the analysis shows that galaxies fainter than the conventional M_UV=-17 limit contribute more than half of the UV luminosity density and at least ∼64% of the ionizing photons produced by star-forming galaxies at z=6. Lower limits are derived as ρ_UV ≥22×10^25 erg s^-1 Hz^-1 Mpc^-3, SFRD ≥25×10^-3 M_⊙ yr^-1 Mpc^-3, and log10(n_ion/s^-1 Mpc^-3) ≥51.02. The model permits a suppressed but non-zero population beyond the turnover, so sources fainter than M_t still add to both ρ_UV and n_ion.
What carries the argument
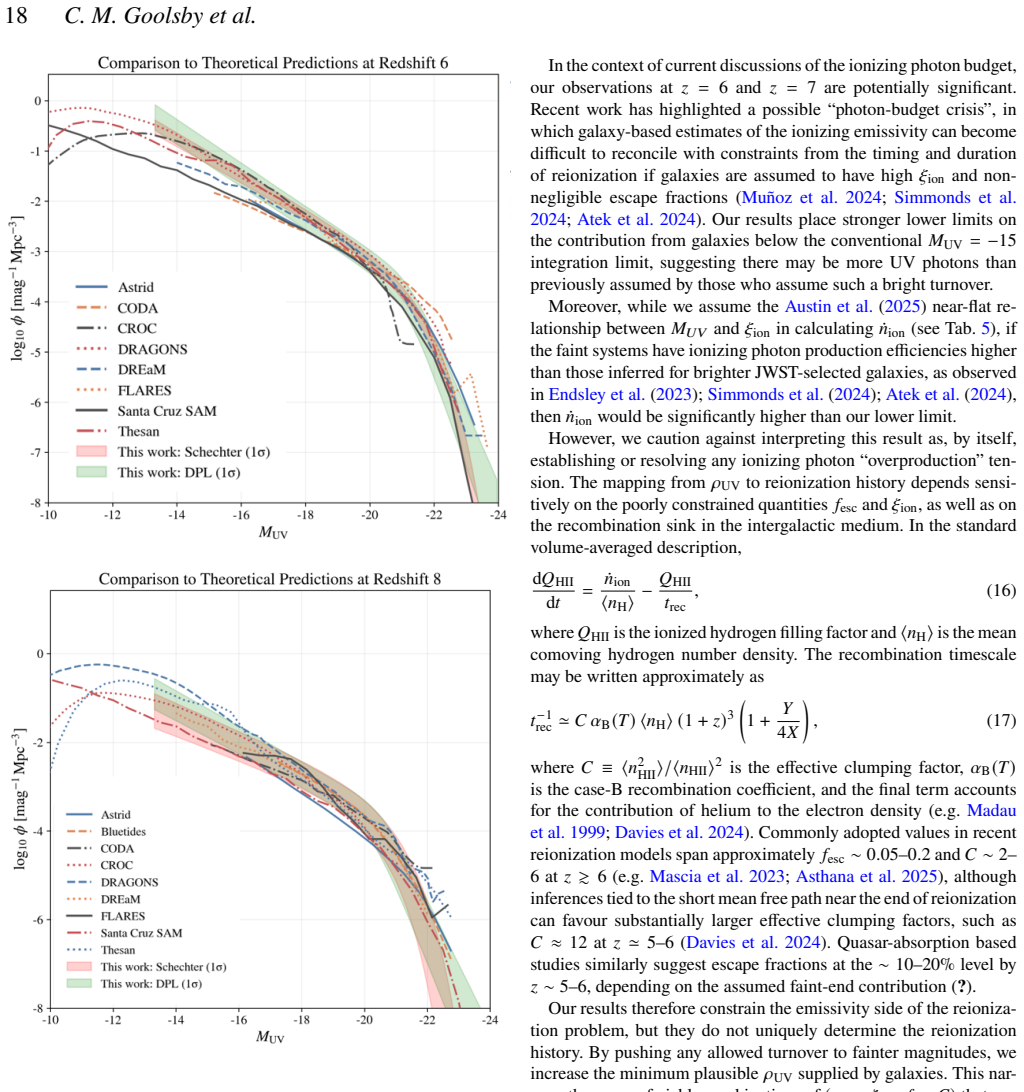
The gradual quadratic suppression model for the UV luminosity function turnover, fitted to counts of strongly lensed high-redshift candidates, which allows a reduced but non-zero contribution from galaxies fainter than the turnover magnitude.
If this is right
- Galaxies fainter than M_UV=-17 contribute more than half the UV luminosity density at z=6.
- These faint galaxies produce at least 64% of the ionizing photons from star-forming galaxies at z=6.
- The UV luminosity density at z=6 has a lower limit of 22×10^25 erg s^-1 Hz^-1 Mpc^-3.
- The star formation rate density at z=6 has a lower limit of 25×10^-3 M_⊙ yr^-1 Mpc^-3.
- Reionization models must account for the shape of any turnover to capture the contribution from sources fainter than M_t.
Where Pith is reading between the lines
- If the lensing model holds, deeper imaging could directly detect the population below M_UV=-13.5 and test whether the quadratic suppression continues or flattens.
- The large share of ionizing photons from faint galaxies implies that reionization calculations limited to brighter sources will under-predict the total photon budget.
- Repeating the same lensing analysis on additional clusters would test whether the faint-end behavior is universal or varies with environment.
- The absence of a detected turnover suggests the luminosity function may keep rising slowly at the faintest luminosities probed so far.
Load-bearing premise
The strong-lensing magnification model for Abell S1063 together with the photometric selection and completeness corrections accurately recover the intrinsic luminosities and redshifts of the high-z candidates down to M_UV≈-13.5 without large systematic biases.
What would settle it
A direct count of galaxies showing a sharp turnover at M_t brighter than -15 or a measured UV luminosity density below 22×10^25 erg s^-1 Hz^-1 Mpc^-3 at z=6 would falsify the shallow-turnover and no-turnover scenarios.
Figures
read the original abstract
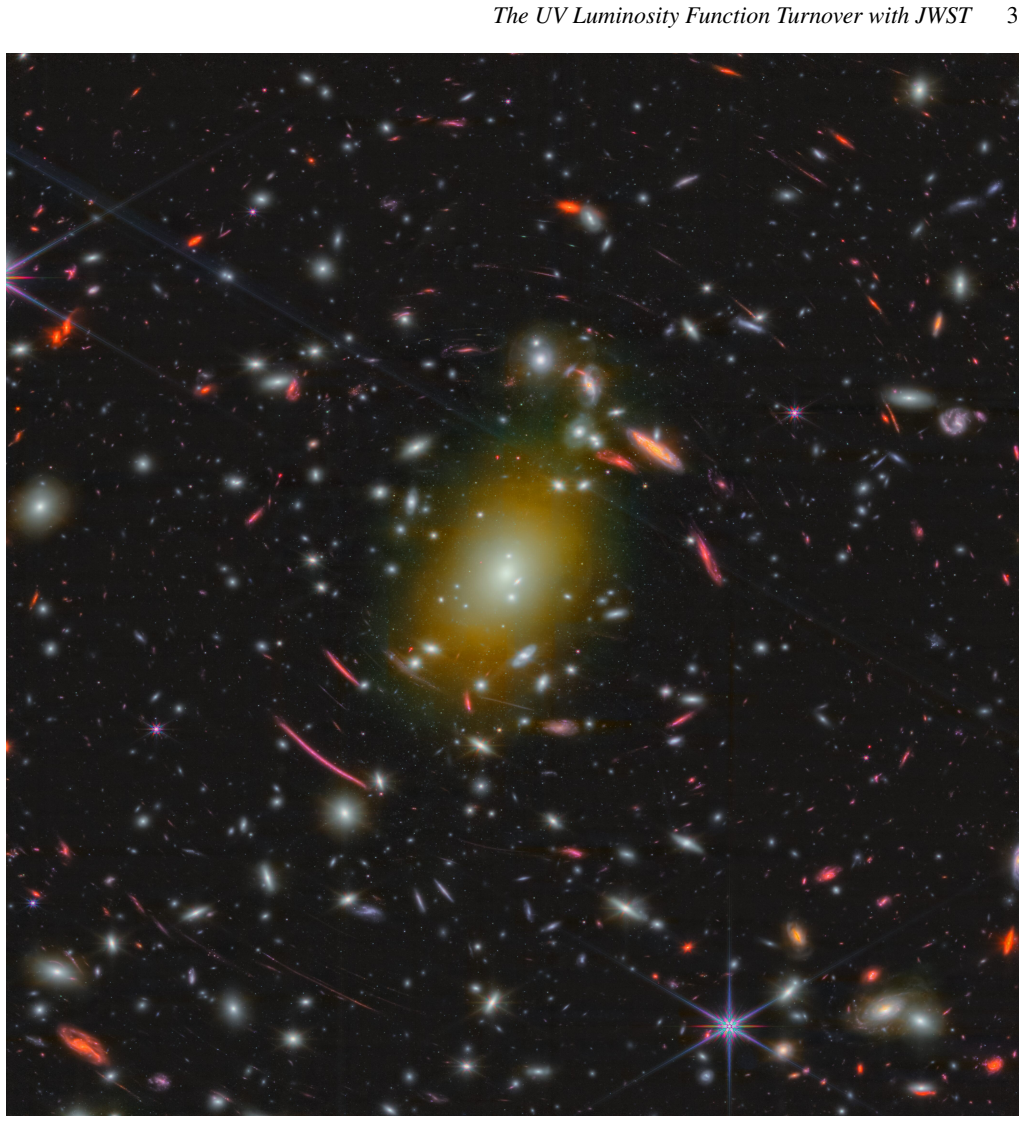
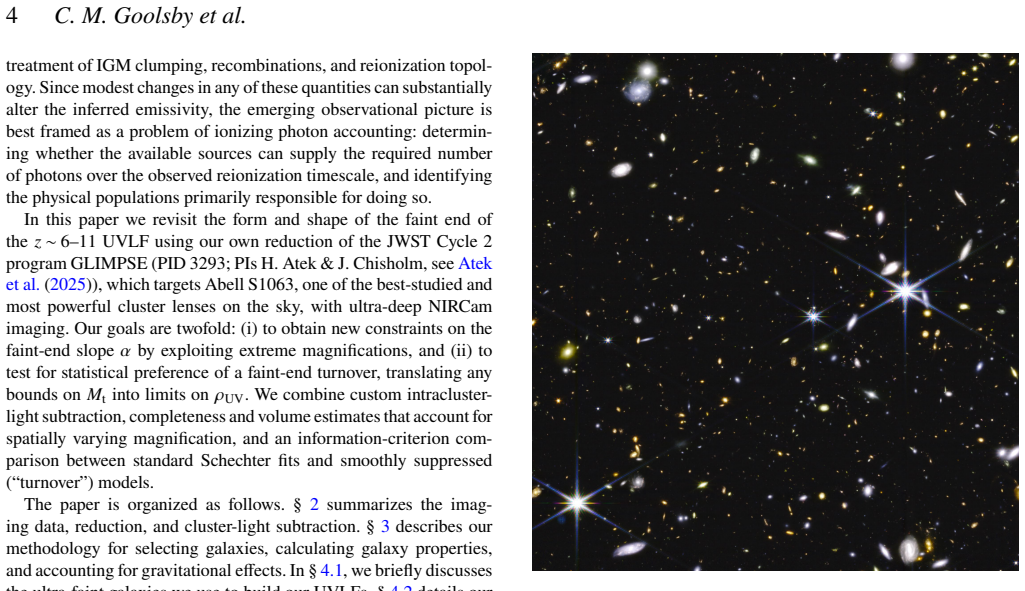
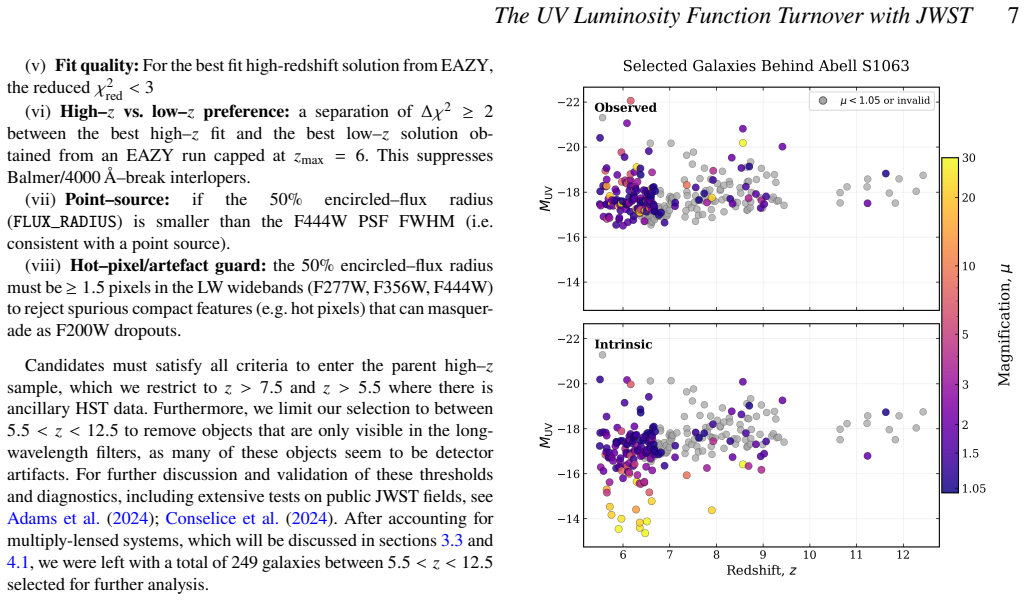
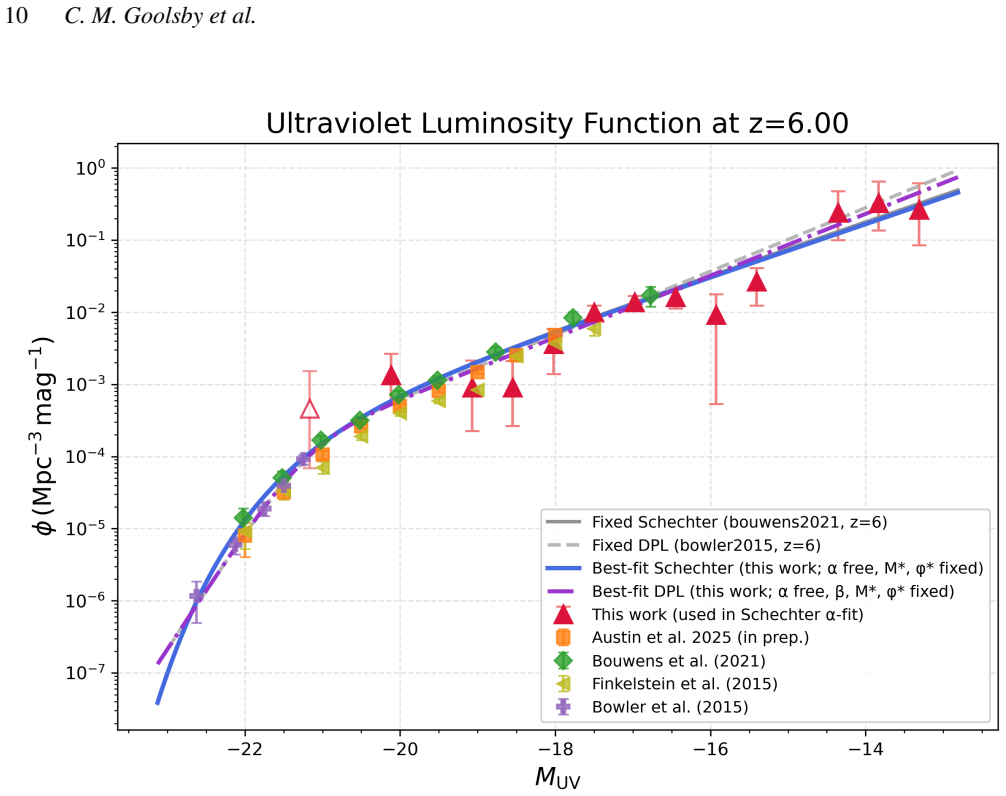
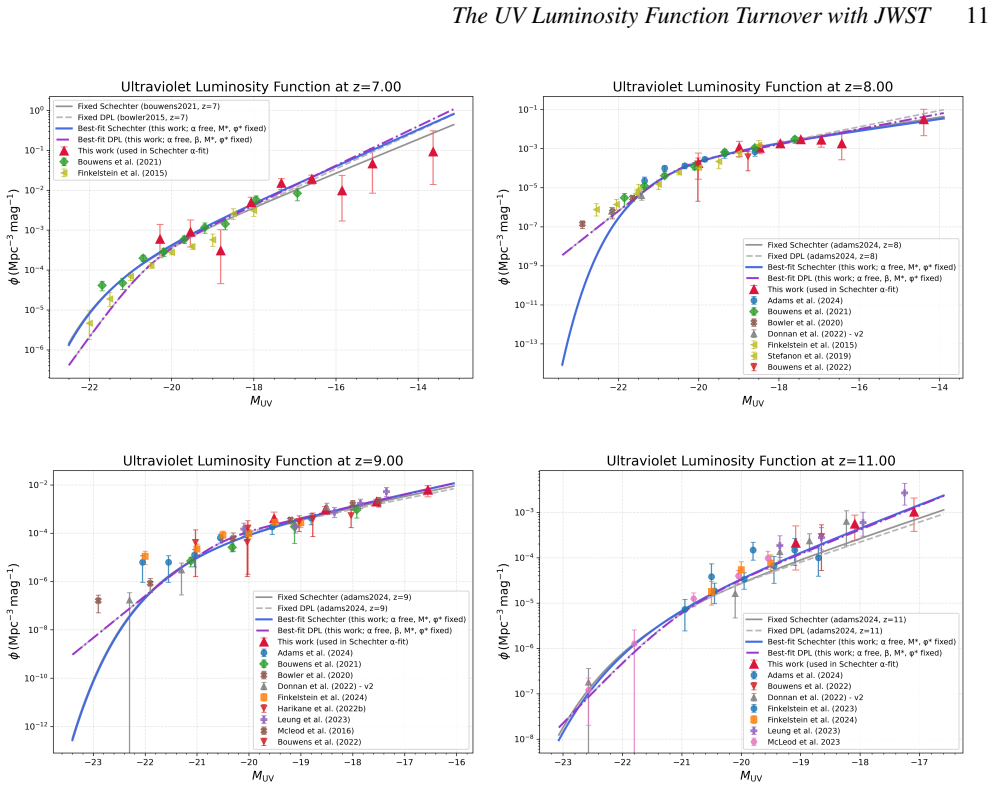
We leverage the strong gravitational field of Abell S1063 to identify faint, highly magnified galaxies using ultra-deep James Webb Space Telescope (JWST)/NIRCam imaging from the GLIMPSE survey and ancillary Hubble Space Telescope (HST)/ACS imaging from the Hubble Frontier Fields program. We construct a photometric catalogue of lensed high-redshift candidates and use these sources to constrain the faint end of the rest-frame UV luminosity function (UVLF) over $z\simeq6$--11. Rather than treating the UVLF turnover ($M_{\rm t}$) as a hard cutoff, we model it as a gradual quadratic suppression and explicitly account for the potential continued contribution of galaxies beyond the turnover. In a shallow-turnover scenario, up to one-third of the UV luminosity density can arise from sources fainter than $M_{\rm t}$. While we find no direct evidence for a turnover down to $M_{\rm UV}=-13.5$ at $z=6$, our analysis can only confidently exclude weak, medium, and strong turnover models down to $M_{\rm t}=-15.9$, $-15.1$, and $-14.8$, respectively. Across these models, we infer lower limits of the UV luminosity, star formation density, and the ionization rate as: $\rho_{\rm UV}\geq22\times10^{25}\,{\rm erg\,s^{-1}\,Hz^{-1}\,Mpc^{-3}}$, ${\rm SFRD}\geq25\times10^{-3}\,M_\odot\,{\rm yr^{-1}\,Mpc^{-3}}$, and $\log_{10}(\dot{n}_{\rm ion}/{\rm s^{-1}\,Mpc^{-3}})\geq51.02$. We find that galaxies fainter than the conventional $M_{\rm UV}=-17$ limit contribute more than half of the UV luminosity density and at least $\sim64\%$ of the ionizing photons produced by star-forming galaxies at $z=6$. Because our turnover model permits a suppressed, but non-zero, galaxy population beyond $M_{\rm t}$, sources fainter than the turnover remain contributors to both $\rho_{\rm UV}$ and $\dot{n}_{\rm ion}$, emphasizing the need to consider the turnover and its shape during reionization.
Editorial analysis
A structured set of objections, weighed in public.
Referee Report
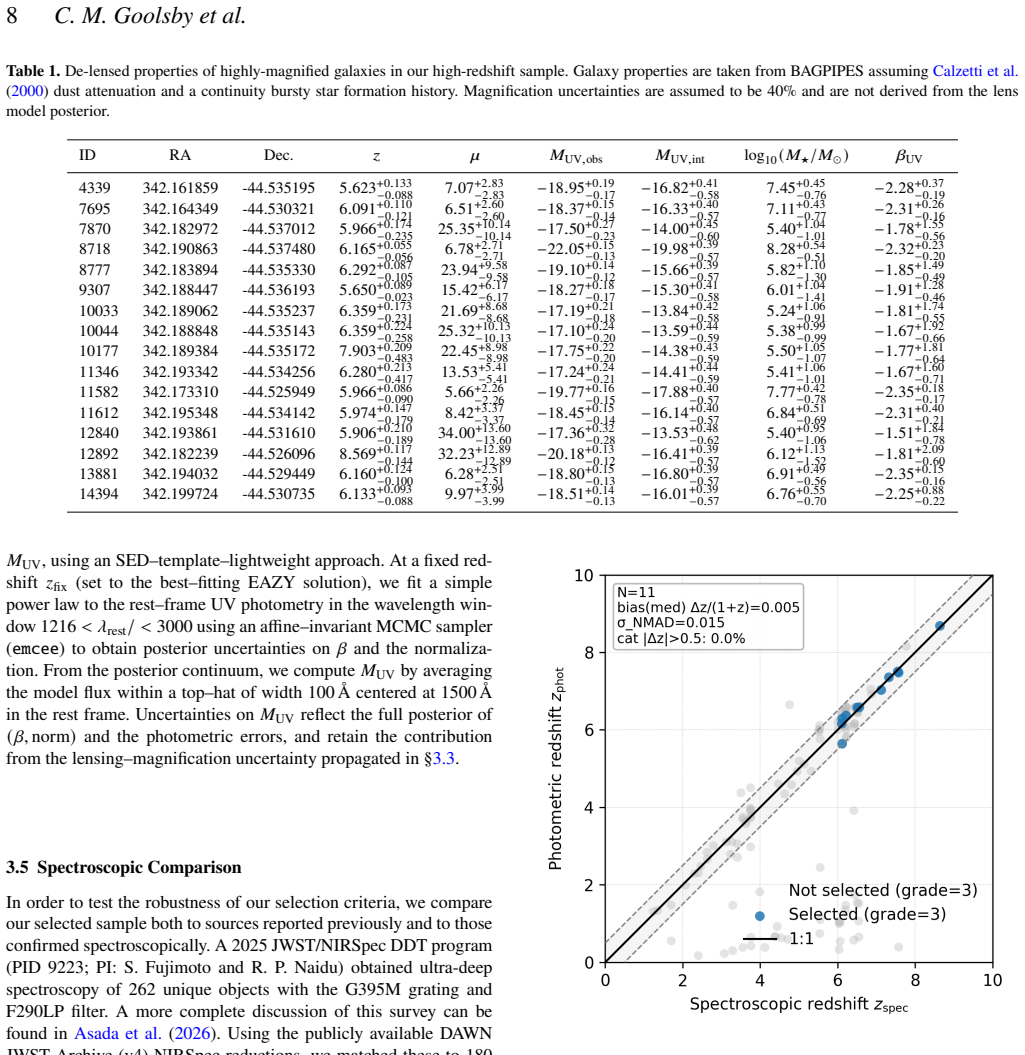
Summary. The paper uses ultra-deep JWST/NIRCam GLIMPSE imaging and HST/ACS Frontier Fields data behind the strong-lensing cluster Abell S1063 to build a photometric catalog of z≈6–11 lensed high-redshift candidates. It constrains the faint end of the rest-UV luminosity function by modeling the turnover as a gradual quadratic suppression (rather than a hard cutoff) that permits continued but suppressed contributions from galaxies fainter than M_t. No direct evidence for a turnover is found down to M_UV≈−13.5 at z=6; weak/medium/strong turnover models are excluded only down to M_t=−15.9/−15.1/−14.8. The analysis yields lower limits ρ_UV≥22×10^25 erg s^−1 Hz^−1 Mpc^−3, SFRD≥25×10^−3 M_⊙ yr^−1 Mpc^−3 and log10(n_ion)≥51.02 at z=6, together with the claim that sources fainter than the conventional M_UV=−17 limit supply >50 % of ρ_UV and ≥64 % of ionizing photons.
Significance. If the lensing magnifications, photometric redshifts and completeness corrections are accurate, the results tighten the observational lower bound on the contribution of sub-L* galaxies to the ionizing photon budget at z=6 and demonstrate that a gradual-turnover parametrization still allows substantial faint-end flux. This supplies a concrete target for reionization and galaxy-formation simulations and highlights the value of cluster-lensing fields for pushing UVLF constraints below the conventional M_UV=−17 limit.
major comments (2)
- [Methods / Results (lensing and completeness sections)] The headline lower limits and the >50 % / ≥64 % contribution statements are obtained by integrating the binned UVLF whose faint-end points rest on de-lensed magnitudes and effective volumes derived from the Abell S1063 magnification map. The manuscript must therefore demonstrate that systematic uncertainties in the lens model (and in the magnification-dependent completeness) have been propagated through to the LF bins and the integrated quantities; without this propagation the quoted lower limits cannot be regarded as robust.
- [Results (turnover exclusion and integration)] The quadratic-turnover model is fitted to the observed LF points; the exclusion limits on M_t (−15.9/−15.1/−14.8) and the 50 % / 64 % fractions are therefore sensitive to any overall shift in the faintest bins. A quantitative test (e.g., Monte-Carlo realizations of the magnification map) showing how a 0.3–0.5 mag systematic in the M_UV≈−13.5 bin propagates into the integrated ρ_UV and n_ion is required before the central claims can be accepted.
minor comments (2)
- [Abstract] The abstract states the numerical lower limits but does not define the precise integration limits or the fiducial escape fraction and ξ_ion values used to convert ρ_UV to n_ion; these should be stated explicitly in the abstract or immediately following the quoted numbers.
- [Introduction / Methods] Notation for the quadratic suppression coefficients and the turnover magnitude M_t should be introduced once in the text and used consistently; the current description mixes “quadratic suppression” and “turnover magnitude” without a single equation reference.
Simulated Author's Rebuttal
We thank the referee for the detailed and constructive report. The comments highlight important aspects of uncertainty propagation that strengthen the robustness of our conclusions. We address each major comment below and will revise the manuscript accordingly.
read point-by-point responses
-
Referee: [Methods / Results (lensing and completeness sections)] The headline lower limits and the >50 % / ≥64 % contribution statements are obtained by integrating the binned UVLF whose faint-end points rest on de-lensed magnitudes and effective volumes derived from the Abell S1063 magnification map. The manuscript must therefore demonstrate that systematic uncertainties in the lens model (and in the magnification-dependent completeness) have been propagated through to the LF bins and the integrated quantities; without this propagation the quoted lower limits cannot be regarded as robust.
Authors: We agree that systematic uncertainties in the lens model must be propagated to support the quoted lower limits. The current manuscript uses the fiducial magnification map from the literature without explicit Monte Carlo sampling of its uncertainties. In the revised version we will add Monte Carlo realizations of the Abell S1063 magnification map (incorporating both statistical and systematic errors) and propagate these through the de-lensed magnitudes, effective volumes, binned UVLF, quadratic-turnover fits, and the integrated quantities ρ_UV, SFRD and n_ion. Updated uncertainties will be reported on the lower limits and the >50 % / ≥64 % fractions. revision: yes
-
Referee: [Results (turnover exclusion and integration)] The quadratic-turnover model is fitted to the observed LF points; the exclusion limits on M_t (−15.9/−15.1/−14.8) and the 50 % / 64 % fractions are therefore sensitive to any overall shift in the faintest bins. A quantitative test (e.g., Monte-Carlo realizations of the magnification map) showing how a 0.3–0.5 mag systematic in the M_UV≈−13.5 bin propagates into the integrated ρ_UV and n_ion is required before the central claims can be accepted.
Authors: We concur that the M_t exclusion limits and the fractional contributions are sensitive to shifts in the faintest bins. The revised manuscript will include a dedicated quantitative sensitivity analysis. We will perform Monte Carlo tests that apply 0.3–0.5 mag systematic offsets to the M_UV ≈ −13.5 bin (consistent with plausible magnification uncertainties), re-fit the quadratic-turnover models, and report the resulting changes to the exclusion limits on M_t and to the integrated ρ_UV and n_ion values. This will directly quantify the robustness of the central claims. revision: yes
Circularity Check
No circularity: lower limits obtained by direct integration of data-constrained UVLF
full rationale
The derivation proceeds from photometric selection of lensed high-z candidates, construction of the observed LF, and integration of a quadratic-turnover parametrization fitted to those binned points. The reported ρ_UV, SFRD and n_ion lower limits are therefore statistical integrals over the observed sample plus the adopted functional form; they do not reduce by the paper's own equations to quantities defined solely by fitted parameters or by self-citation. No self-definitional, fitted-input-called-prediction, or load-bearing self-citation steps are present in the supplied text.
Axiom & Free-Parameter Ledger
free parameters (2)
- quadratic suppression coefficients
- turnover magnitude M_t
axioms (2)
- domain assumption The strong-lensing magnification map for Abell S1063 correctly predicts the flux boost for background sources at z~6-11.
- domain assumption Photometric redshifts and color selections isolate a clean sample of z~6-11 galaxies with negligible low-redshift contamination.
Reference graph
Works this paper leans on
-
[1]
Adams N. J., Conselice C. J., Austin D., et al., 2024, @doi [ApJ] 10.3847/1538-4357/ad2a7b , 965, 169
- [2]
-
[3]
Asthana S., et al., 2025, Monthly Notices of the Royal Astronomical Society: Letters, 539, L18
2025
-
[4]
Atek H., Richard J., Kneib J.-P., et al., 2018, @doi [Monthly Notices of the Royal Astronomical Society] 10.1093/mnras/sty1770 , 479, 5184
-
[5]
J., et al., 2024, @doi [Nature] 10.1038/s41586-024-07043-6 , 626, 975
Atek H., Labb \'e I., Furtak L. J., et al., 2024, @doi [Nature] 10.1038/s41586-024-07043-6 , 626, 975
- [6]
-
[7]
Atek H., et al., 2026, A GLIMPSE of the 99
2026
- [8]
- [9]
-
[10]
Bertin E., Arnouts S., 1996, @doi [Astronomy and Astrophysics Supplement Series] 10.1051/aas:1996164 , 117, 393
-
[12]
J., et al., 2015, @doi [The Astrophysical Journal] 10.1088/0004-637X/803/1/34 , 803, 34
Bouwens R. J., et al., 2015, @doi [The Astrophysical Journal] 10.1088/0004-637X/803/1/34 , 803, 34
-
[13]
J., et al., 2017, @doi [The Astrophysical Journal] 10.3847/1538-4357/aa76e1 , 843, 129
Bouwens R. J., et al., 2017, @doi [The Astrophysical Journal] 10.3847/1538-4357/aa76e1 , 843, 129
-
[14]
J., et al., 2021, @doi [The Astrophysical Journal] 10.3847/1538-4357/ac0821 , 917, 3
Bouwens R. J., et al., 2021, @doi [The Astrophysical Journal] 10.3847/1538-4357/ac0821 , 917, 3
-
[15]
Bowler R. A. A., et al., 2015, @doi [Monthly Notices of the Royal Astronomical Society] 10.1093/mnras/stv1417 , 452, 1817
-
[19]
Calzetti D., et al., 2000, @doi [The Astrophysical Journal] 10.1086/308692 , 533, 682
work page internal anchor Pith review doi:10.1086/308692 2000
-
[20]
Carnall A. C., et al., 2018, @doi [Monthly Notices of the Royal Astronomical Society] 10.1093/mnras/sty2203 , 480, 4379
-
[23]
E., 2010, @doi [The Astrophysical Journal] 10.1088/0004-637X/712/2/833 , 712, 833
Conroy C., Gunn J. E., 2010, @doi [The Astrophysical Journal] 10.1088/0004-637X/712/2/833 , 712, 833
work page internal anchor Pith review doi:10.1088/0004-637x/712/2/833 2010
-
[24]
Conselice C. J., et al., 2024, EPOCHS I. The Discovery and Star Forming Properties of Galaxies in the Epoch of Reionization at 6.5 < z < 18 with PEARLS and Public JWST data ( @eprint arXiv 2407.14973 ), https://arxiv.org/abs/2407.14973
-
[31]
Donnan C. T., et al., 2023, @doi [Monthly Notices of the Royal Astronomical Society] 10.1093/mnras/stac3343 , 518, 6011
-
[35]
Eldridge J. J., Stanway E. R., 2017, @doi [Publications of the Astronomical Society of Australia] 10.1017/pasa.2017.51 , 34, e058
work page internal anchor Pith review doi:10.1017/pasa.2017.51 2017
-
[37]
Feroz F., Hobson M. P., Bridges M., 2009, @doi [Monthly Notices of the Royal Astronomical Society] 10.1111/j.1365-2966.2009.14548.x , 398, 1601
-
[38]
L., et al., 2015, @doi [The Astrophysical Journal] 10.1088/0004-637X/810/1/71 , 810, 71
Finkelstein S. L., et al., 2015, @doi [The Astrophysical Journal] 10.1088/0004-637X/810/1/71 , 810, 71
-
[40]
D., Dav \'e R., 2011, @doi [The Astrophysical Journal] 10.1088/0004-637X/743/2/169 , 743, 169
Finlator K., Oppenheimer B. D., Dav \'e R., 2011, @doi [The Astrophysical Journal] 10.1088/0004-637X/743/2/169 , 743, 169
- [41]
-
[43]
Y., 2000, @doi [The Astrophysical Journal] 10.1086/317042 , 542, 535
Gnedin N. Y., 2000, @doi [The Astrophysical Journal] 10.1086/317042 , 542, 535
-
[46]
Harikane Y., et al., 2023, @doi [The Astrophysical Journal Supplement Series] 10.3847/1538-4365/acaaa7 , 265, 5
-
[49]
Ilbert O., et al., 2006, @doi [Astronomy & Astrophysics] 10.1051/0004-6361:20065138 , 457, 841
work page internal anchor Pith review doi:10.1051/0004-6361:20065138 2006
-
[50]
Illingworth G., et al., 2016, arXiv e-prints
2016
-
[52]
Jecmen M. C., et al., 2026, A GLIMPSE into the UV Continuum Slopes of the Faintest Galaxies in the Epoch of Reionization ( @eprint arXiv 2601.19995 ), https://arxiv.org/abs/2601.19995
-
[55]
Kass R. E., Raftery A. E., 1995, @doi [Journal of the American Statistical Association] 10.1080/01621459.1995.10476572 , 90, 773
-
[58]
Kroupa P., 2002, @doi [Science] 10.1126/science.1067524 , 295, 82
-
[60]
Leja J., et al., 2019, @doi [The Astrophysical Journal] 10.3847/1538-4357/ab1909 , 877, 140
-
[61]
Livermore R. C., Finkelstein S. L., Lotz J. M., 2017, @doi [Nature Astronomy] 10.1038/s41550-017-0155 , 1, 157
-
[71]
Moster B. P., Somerville R. S., Newman J. A., Rix H.-W., 2011, @doi [The Astrophysical Journal] 10.1088/0004-637X/731/2/113 , 731, 113
-
[72]
B., Mirocha J., Chisholm J., Furlanetto S
Mu \ n oz J. B., Mirocha J., Chisholm J., Furlanetto S. R., Mason C., 2024, @doi [Monthly Notices of the Royal Astronomical Society: Letters] 10.1093/mnrasl/slae086 , 535, L37
-
[74]
A., et al., 2013, @doi [The Astrophysical Journal] 10.1088/0004-637X/773/2/75 , 773, 75
Oesch P. A., et al., 2013, @doi [The Astrophysical Journal] 10.1088/0004-637X/773/2/75 , 773, 75
-
[75]
A., et al., 2018, @doi [The Astrophysical Journal] 10.3847/1538-4357/aaafcd , 855, 105
Oesch P. A., et al., 2018, @doi [The Astrophysical Journal] 10.3847/1538-4357/aaafcd , 855, 105
-
[79]
2020, @doi [Astronomy & Astrophysics] 10.1051/0004-6361/201833910 , 641, A6
Planck Collaboration Aghanim N., Akrami Y., et al. 2020, @doi [Astronomy & Astrophysics] 10.1051/0004-6361/201833910 , 641, A6
-
[84]
P., et al., 2020, @doi [Astronomy and Computing] 10.1016/j.ascom.2020.100425 , 33, 100425
Robitaille T. P., et al., 2020, @doi [Astronomy and Computing] 10.1016/j.ascom.2020.100425 , 33, 100425
-
[85]
Rowan-Robinson M., 1968, @doi [Monthly Notices of the Royal Astronomical Society] 10.1093/mnras/138.4.445 , 138, 445
-
[86]
Schechter P., 1976, @doi [The Astrophysical Journal] 10.1086/154079 , 203, 297
-
[87]
Schmidt M., 1968, @doi [The Astrophysical Journal] 10.1086/149446 , 151, 393
-
[88]
Schwarz G., 1978, Annals of Statistics, https://ui.adsabs.harvard.edu/abs/1978AnSta...6..461S 6, 461
1978
-
[91]
Stanway E. R., Eldridge J. J., 2018, @doi [Monthly Notices of the Royal Astronomical Society] 10.1093/mnras/sty079 , 479, 75
-
[93]
Ulm K., 1990, @doi [American Journal of Epidemiology] 10.1093/oxfordjournals.aje.a115529 , 131, 373
-
[96]
Whitaker K. E., et al., 2019, @doi [The Astrophysical Journal Supplement Series] 10.3847/1538-4365/ab3e4b , 244, 16
-
[97]
Williams C. C., et al., 2018, @doi [The Astrophysical Journal Supplement Series] 10.3847/1538-4365/aabfdf , 236, 33
work page internal anchor Pith review doi:10.3847/1538-4365/aabfdf 2018
-
[102]
Brammer, Gabriel B. and van Dokkum, Pieter G. and Coppi, Paolo , title =. The Astrophysical Journal , year =. doi:10.1086/591786 , eprint =
work page internal anchor Pith review doi:10.1086/591786
-
[103]
Powering reionization: assessing the galaxy ionizing photon budget at $z < 10$
Powering reionization: assessing the galaxy ionizing photon budget at z < 10. , keywords =. doi:10.1093/mnras/stv1049 , archivePrefix =. 1505.01846 , primaryClass =
work page internal anchor Pith review Pith/arXiv arXiv doi:10.1093/mnras/stv1049
-
[104]
The mass evolution of the first galaxies: stellar mass functions and star formation rates at 4 < z < 7 in the CANDELS GOODS-South field. , keywords =. doi:10.1093/mnras/stu1622 , archivePrefix =. 1408.2527 , primaryClass =
work page internal anchor Pith review Pith/arXiv arXiv doi:10.1093/mnras/stu1622
-
[105]
, title =
Conroy, Charlie and Gunn, James E. , title =. The Astrophysical Journal , year =
-
[106]
Larry Bradley and others , title =. 2022 , version =. doi:10.5281/zenodo.6825092 , url =
-
[107]
and others , title =
Robitaille, Thomas P. and others , title =. Astronomy and Computing , year =
-
[108]
Illingworth, G. and others , title =. arXiv e-prints , year =. 1606.00841 , archivePrefix =
work page internal anchor Pith review Pith/arXiv arXiv
-
[109]
and others , title =
Whitaker, Katherine E. and others , title =. The Astrophysical Journal Supplement Series , year =
-
[110]
Astronomy and Astrophysics Supplement Series , year =
Bertin, Emmanuel and Arnouts, Stéphane , title =. Astronomy and Astrophysics Supplement Series , year =
-
[111]
and others , title =
Carnall, Adam C. and others , title =. Monthly Notices of the Royal Astronomical Society , year =
-
[112]
and Eldridge, J
Stanway, Elizabeth R. and Eldridge, J. J. , title =. Monthly Notices of the Royal Astronomical Society , year =
-
[113]
Eldridge, J. J. and Stanway, Elizabeth R. , title =. Publications of the Astronomical Society of Australia , year =
-
[114]
Science , year =
Kroupa, Pavel , title =. Science , year =
-
[115]
The Astrophysical Journal , year =
Leja, Joel and others , title =. The Astrophysical Journal , year =
-
[116]
The Astrophysical Journal , year =
Calzetti, Daniela and others , title =. The Astrophysical Journal , year =
-
[117]
and Hobson, M
Feroz, F. and Hobson, M. P. and Bridges, M. , title =. Monthly Notices of the Royal Astronomical Society , year =
-
[118]
and others , title =
Ilbert, O. and others , title =. Astronomy & Astrophysics , year =
-
[119]
Caminha, G. B. and others , title =. Astronomy & Astrophysics , year =
-
[120]
Astronomy & Astrophysics , year =
Beauchesne, Benjamin and others , title =. Astronomy & Astrophysics , year =
-
[121]
and Steinhardt, Charles L
Speagle, Joshua S. and Steinhardt, Charles L. and Capak, Peter L. and Silverman, John D. , title =. The Astrophysical Journal Supplement Series , year =
-
[122]
Bouwens, R. J. and others , title =. The Astrophysical Journal , year =
-
[123]
The Astrophysical Journal , year =
Schmidt, Maarten , title =. The Astrophysical Journal , year =
-
[124]
Monthly Notices of the Royal Astronomical Society , year =
Rowan-Robinson, Michael , title =. Monthly Notices of the Royal Astronomical Society , year =
-
[125]
and others , title =
Williams, Christina C. and others , title =. The Astrophysical Journal Supplement Series , year =
-
[126]
Modelling the spectral energy distributions of galaxies: a
Chevallard, Jacopo and Charlot, St. Modelling the spectral energy distributions of galaxies: a. Monthly Notices of the Royal Astronomical Society , year =
-
[127]
Stellar population synthesis at the resolution of 2003 , journal =
Bruzual, Gustavo and Charlot, St. Stellar population synthesis at the resolution of 2003 , journal =. 2003 , volume =
2003
-
[128]
Modelling the nebular emission from star-forming galaxies , journal =
Gutkin, Julia and Charlot, St. Modelling the nebular emission from star-forming galaxies , journal =. 2016 , volume =
2016
-
[129]
and others , title =
Tomczak, Adam R. and others , title =. The Astrophysical Journal , year =
-
[130]
The Astrophysical Journal , year =
Stefanon, Mauro and others , title =. The Astrophysical Journal , year =
-
[131]
Oesch, P. A. and others , title =. The Astrophysical Journal , year =
-
[132]
Skelton, R. E. and others , title =. The Astrophysical Journal Supplement Series , year =
-
[133]
and others , title =
Momcheva, Ivelina G. and others , title =. The Astrophysical Journal Supplement Series , year =
-
[134]
American Journal of Epidemiology , year =
Ulm, Karl , title =. American Journal of Epidemiology , year =
discussion (0)
Sign in with ORCID, Apple, or X to comment. Anyone can read and Pith papers without signing in.