REVIEW 4 major objections 4 minor 27 references
Continuous Wavelet Transform and Siamese Network-Based Anomaly Detection in Multi-variate Semiconductor Process Time Series
T0 review · 4 major / 4 minor · reviewed 2026-08-06 · deepseek-v4-flash
Pith's one-line read This paper claims that a CWT-plus-Siamese VGG-16 pipeline can detect induced time-shift and amplitude anomalies in real fab trace data, with 100% identification in 20-way validation on the time-shift datasets.
desk verdict Honest incremental pipeline paper; the evaluation only measures synthetic time/amplitude shifts, so the 'real FAB' claim is overstated. read the letter →
The pith
A machine-rendered reading of the paper's core claim, the machinery that carries it, and where it could break.
The reading
What carries the argument
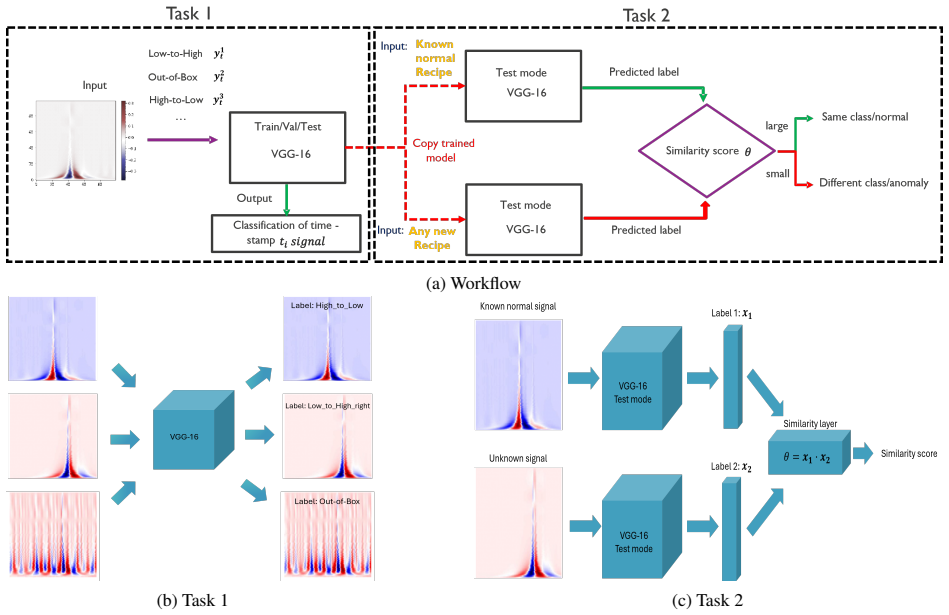
The machinery has two load-bearing parts. First, the Continuous Wavelet Transform (CWT), a time-frequency transform that localizes signal content in both time and scale, turns a window around each detected step peak into a fixed-size image, preserving fast transients and slow frequency content; the Mexican hat wavelet is used here. Second, a Siamese network with two identical VGG-16 branches, a deep convolutional image-classification architecture, shares weights and compares a known-good anchor image with a query image at the same time step, where each branch outputs class probabilities and the dot product of the two probability vectors is the similarity score. Around this core, the pipeline uses min-max normalization, asymmetric-least-squares baseline removal, and peak detection with a minimum height and spacing to isolate the step signatures that become CWT images.
What would settle it
Take the trained model to a fab trace that a process engineer has independently flagged as anomalous, such as a chamber later found to malfunction, and check whether its similarity score to the known-good anchor is as low as the synthetic anomaly scores; a high similarity for a confirmed fault would falsify the central claim.
Extended reading notes
Core claim
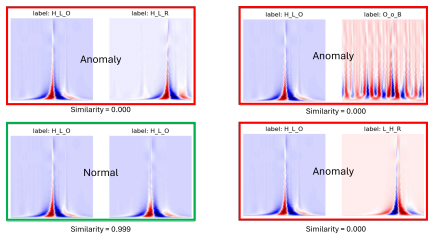
The central claim is that time-frequency image representations carry enough information to separate normal process steps from time-shifted and amplitude-scaled versions of the same steps, and that a Siamese comparator built from a fine-tuned VGG-16 can perform this separation. In the paper's formulation, each signal is min-max normalized, a baseline is subtracted via asymmetric least squares, the residual peaks are located and converted to CWT images using the Mexican hat wavelet, and those images feed a three-class classifier for low-to-high, high-to-low, and out-of-box states. That classifier reaches 100% accuracy on the non-anomalous dataset and about 99% average accuracy on a seven-class dataset containing four induced time-shift anomaly classes, with only two misclassifications, while 20-way validation of the Siamese pair comparator gives 100% correct anomaly identification on both datasets. For amplitude shifts, where single images per class prevent a confusion-matrix test, the Siamese model assigns the anchor image the highest similarity to itself (0.9571 for peak 1 and 0.9257 for peak 2) and progressively lower similarity for larger deviations, with scores near zero for factors outside the normal range. The paper concludes that the framework is effective for offline detection and localisation of anomalies in process and tool trace data.
Load-bearing premise
The load-bearing premise is that the 912 recorded fab runs are genuinely non-anomalous and that the artificially induced time shifts and amplitude scalings reproduce the signatures of real faults; if real anomalies look different, the reported accuracy will not transfer.
Editorial extensions
If this is right
- If the reported accuracy transfers beyond the induced anomalies, the same CWT-plus-Siamese pipeline can be deployed on other fab tools and chambers without redesigning thresholds, since detection is comparison-based rather than fixed-threshold.
- Because each sliding time window is scored independently, the method localises anomalies in time: an engineer can see which step in a trace deviates from the known-good reference.
- The approach trains mainly on normal reference traces, so it can be run in semi-supervised settings where labelled faults are rare, matching the paper's claim of support for both supervised and semi-supervised deployment.
- The monotonic drop in similarity as amplitude-shift factors move away from 1.0 suggests the score can rank the severity of amplitude deviations, not just flag their presence.
Reading between the lines
- Editorial inference: The 100% figure is measured on synthetically induced anomalies; real faults in the form of gradual drift, sensor degradation, or missing data may produce different CWT signatures, so the strongest test of the approach is against naturally occurring faults.
- Editorial inference: The method's window-independent scoring could be combined with temporal smoothing or sequence models to catch slow multi-window drifts; the paper lists this as future work rather than a demonstrated capability.
- Editorial inference: Because the pipeline is agnostic to the physical meaning of the variables, the same recipe of baseline subtraction, CWT imaging, and Siamese comparison could be applied to other batch manufacturing processes with step-like traces, not just semiconductor tools.
Editorial analysis
A structured set of objections, weighed in public.
Referee Report
Summary. The paper proposes an anomaly-detection pipeline for multivariate semiconductor process time series. Raw tool traces are normalized, baseline-corrected, and reduced to step-transition peaks, which are converted into 2D time-frequency images with the Continuous Wavelet Transform. A fine-tuned VGG-16 classifier is then used both for direct image classification and as the shared backbone of a Siamese network that compares an anchor (known-good) image with a query image by dot-product similarity of class-probability vectors. The authors evaluate the method on three datasets built from real fab traces: Dataset-1 contains only assumed-normal step classes, Dataset-2 adds synthetically time-shifted signals, and Dataset-3 adds synthetically amplitude-scaled signals. The reported results include 100% classification accuracy on Dataset-1, 99% accuracy with 100% N-way identification on Dataset-2, and monotonic similarity scores on Dataset-3. The abstract and introduction claim high-accuracy anomaly identification on a real FAB process dataset, and the conclusion further claims superiority over traditional statistical control schemes and many supervised ML models.
Significance. If the claimed results held, the paper would offer a practical offline anomaly-detection tool for semiconductor fab trace data, with the attractive property of requiring only normal references plus a metric-based comparison that avoids per-tool threshold recalibration. The CWT-to-image conversion and the use of a pretrained VGG-16 backbone as a Siamese feature extractor are sensible engineering choices, and the paper is clearly written with a concrete preprocessing pipeline and explicit hyperparameter discussion. However, the significance as a scientific claim about anomaly detection on real fab data is severely limited by the evaluation design: all anomaly labels are generated by the authors' own transformations, all real data are assumed normal, and the headline 100% accuracy is in part an artifact of the N-way validation protocol. The paper therefore does not provide evidence that the method detects real faults, gradual drifts, or sensor failures, which are precisely the anomalies motivating the work.
major comments (4)
- [Abstract, Section 3.1, Section 3.2.2] The central claim of "high accuracy in identifying anomalies on a real FAB process time-series dataset" is not supported by the evaluation. Section 3.1 states that all collected fab data were assumed non-anomalous because no labels were available, and Section 3.2.2 introduces anomalies by shifting the entire signal by ±2 seconds or by multiplying step segments by factors {0.5, 0.75, 1.2, 1.5, 2.5}. The classifier and Siamese network are therefore trained and evaluated on CWT images produced from exactly the same transformations they are asked to detect; the reported accuracy measures recognition of induced time shifts and amplitude scalings, not detection of real anomalies on the fab dataset. The paper's own Section 5.1 concedes the reliance on synthetic anomalies and the limited coverage of real anomaly types.
- [Section 4.2] The 100% N-way identification accuracy for Dataset-2 is misleading because the procedure dilutes misclassifications. The paper itself notes that the classifier has 99% average accuracy with 2 misclassifications, and that for k = 506 the N-way validation rounds the accuracy up to 100%. Since one correct identification out of N candidates can mask many errors, the headline metric is not a reliable measure of anomaly-detection performance. The authors should report per-class precision/recall or a standard ROC/AUC evaluation on the classification task instead of relying on the diluted N-way metric.
- [Section 4.3, Table 2] The Dataset-3 evaluation does not demonstrate anomaly detection accuracy. It uses 12 images total, one image per class, and reports similarity scores between the anchor image and amplitude-scaled versions of that same image. The monotonic decrease of similarity with increasing amplitude deviation is nearly guaranteed by construction, because the CWT images of a step signal scaled by factors {0.5, 0.75, 1.2, 1.5, 2.5} have proportionally different intensities and hence different color distributions. No accuracy on unseen data, no threshold, and no comparison with a trivial distance measure are provided, so the claim that the framework "effectively detects amplitude shift-induced anomalies" is not established.
- [Section 4 and Section 6] The paper provides no baselines or ablations. The conclusion claims the proposed approach "outperforms traditional statistical control schemes and many supervised ML models," but Section 4 reports no comparison with, for example, direct peak-timing and amplitude-threshold detection, a simple k-nearest-neighbor baseline in the raw time domain, or a non-CWT time-series classifier. Without such comparisons, it is impossible to attribute the observed separation of the synthetic classes to the CWT-plus-Siamese pipeline rather than to the trivial separability of the induced transformations. At minimum, the authors should demonstrate that the method adds value over a direct measurement of peak positions and step amplitudes, which are the exact features used to generate the anomalies.
minor comments (4)
- [Throughout] The spelling "multi-variate" is used inconsistently; the standard term in the literature is "multivariate." Please unify the terminology.
- [Section 3.2.1] The baseline-estimation parameters wi = 0.5 and λ are stated, but the peak-detection height threshold (0.1) and minimum spacing (10 seconds) are given without motivation or sensitivity analysis. The paper's own Section 5.3 acknowledges hyperparameter sensitivity, so a brief discussion or supplementary experiment would help.
- [Section 3.3 and Section 4.2] The notation for N-way validation is confusing: the text says "20-way validation" with k = 182 and k = 506, but the role of N and k is not defined precisely. Please clarify the relationship between the number of candidate images per trial and the number of trials, and state how the reported percentage is computed.
- [Section 4.1 and Figure 5] The confusion matrices are described as "optimal" and "near perfect," but the exact test-set sizes and the source of the two misclassifications in Dataset-2 are not reported. Adding the per-class cell counts would make the results reproducible and interpretable.
Circularity Check
No significant circularity: the CWT-to-Siamese pipeline is self-contained as a supervised benchmark; the absence of real anomaly labels is a validity limitation, not a circular derivation.
full rationale
The paper's derivation chain is transparent and non-circular under its stated assumptions. Section 3.1 explicitly says all real data were assumed non-anomalous because no labels existed; Section 3.2.2 then creates anomalies by defined time shifts and amplitude scalings and builds separate datasets. The classifier is trained on labeled CWT images and evaluated on held-out images from the same synthetic distribution; that is a standard supervised benchmark, not a prediction that reduces to its fitted inputs. The N-way validation's perfect score is an artifact of metric dilution, which the paper itself concedes in Section 4.2 ('the high value of k < 100 leads to a dilution of misclassifications, effectively rounding the overall accuracy up to 100%'), so the 100% figure is not a hidden forced result. Dataset-3 compares the anchor to itself and to amplitude-shifted versions; the anchor-self comparison is a deterministic sanity check, but the decreasing similarity trend is an empirical model output rather than a value imposed by construction. Section 5.1 concedes limited coverage and reliance on synthetic anomalies, which is an external-validity limitation rather than a circularity. There are no load-bearing self-citations, no imported uniqueness theorems, and no fitted parameter renamed as a prediction. The strongest legitimate criticism is that 'high accuracy on a real FAB dataset' overstates what was measured, since the real data contain no anomaly labels; that is a correctness/validity concern, not a circularity, and is outside this pass's remit.
Assumptions & free parameters
free parameters (6)
- Peak detection minimum height =
0.1
- Peak minimum spacing =
10 seconds
- CWT window size =
10 seconds centered on peak
- Baseline asymmetry weight =
0.5
- Baseline smoothness lambda =
not reported
- Amplitude shift factors =
{0.5, 0.75, 1.2, 1.5, 2.5}
assumptions (4)
- domain assumption All collected fab time-series data are assumed non-anomalous because no labels exist.
- ad hoc to paper Synthetic time-shift and amplitude-shift anomalies are representative of real fab anomalies.
- domain assumption Step-like transitions in normalized, baseline-corrected signals carry the anomaly-relevant information.
- domain assumption The Mexican hat wavelet and the chosen scale range capture distinguishing anomaly features.
Cite this review
Pith. "Pith review of Continuous Wavelet Transform and Siamese Network-Based Anomaly Detection in Multi-variate Semiconductor Process Time Series." pith.science (2026). https://pith.science/paper/VGTFNPRJ
@misc{pith2026250701999,
  author       = {Pith},
  title        = {Pith review of: Continuous Wavelet Transform and Siamese Network-Based Anomaly Detection in Multi-variate Semiconductor Process Time Series},
  year         = {2026},
  howpublished = {\url{https://pith.science/paper/VGTFNPRJ}},
  note         = {Machine review of arXiv:2507.01999}
}
read the original abstract
Semiconductor manufacturing is an extremely complex process, characterized by thousands of interdependent parameters collected across diverse tools and process steps. Multi-variate time-series (MTS) analysis has emerged as a critical methodology for enabling real-time monitoring, fault detection, and predictive maintenance in such environments. However, anomaly prediction in semiconductor fabrication presents several critical challenges, including high data dimensionality, severe class imbalance due to the rarity of true faults, noisy and missing measurements, and non-stationary behavior of production systems. Furthermore, the complex interdependencies between variables and the delayed emergence of faults across downstream stages complicate both anomaly detection and root-cause-analysis. This paper presents a novel and generic approach for anomaly detection in MTS data using machine learning. The proposed methodology consists of three main steps: a) converting MTS data into image-based representations using the Continuous Wavelet Transform, b) developing a multi-class image classifier by fine-tuning a pretrained VGG-16 architecture on custom CWT image datasets, and c) constructing a Siamese network composed of two identical sub-networks, each utilizing the fine-tuned VGG-16 as a backbone. The network takes pairs of CWT images as input -one serving as a reference or anchor (representing a known-good signal), and the other as a query (representing an unknown signal). The model then compares the embeddings of both inputs to determine whether they belong to the same class at a given time step. Our approach demonstrates high accuracy in identifying anomalies on a real FAB process time-series dataset, offering a promising solution for offline anomaly detection in process and tool trace data. Moreover, the approach is flexible and can be applied in both supervised and semi-supervised settings.
Figures


Figures from the paper (4 more)


Reference graph
Works this paper leans on
-
[1]
Error in measuring low flows could cost chipmakers millions | machine design. URL: https://www.machinedesign.com/mechanical-motion-systems/article/21837100/ error-in-measuring-low-flows-could-cost-chipmakers-millions
-
[2]
URL: https://semiengineering.com/ getting-smarter-about-tool-maintenance/
Getting smarter about tool maintenance. URL: https://semiengineering.com/ getting-smarter-about-tool-maintenance/
-
[3]
Nonlinear signal processing using neural networks: Prediction and system modelling, 6 1987
A Lapedes and R Farber. Nonlinear signal processing using neural networks: Prediction and system modelling, 6 1987
work page 1987
-
[4]
D. J. Bartholomew. Time series analysis forecasting and control. Journal of the Operational Research Society , 22:199–201, 6 1971. URL: https://www.tandfonline.com/doi/abs/10.1057/jors.1971.52, doi:10. 1057/JORS.1971.52
-
[5]
Robert F. Engle. Autoregressive conditional heteroscedasticity with estimates of the variance of united kingdom inflation. Econometrica, 50:987, 7 1982. doi:10.2307/1912773
doi:10.2307/1912773 1982
-
[6]
Designing an artificial neural network for forecasting tourism time series
Alfonso Palmer, Juan José Montaño, and Albert Sesé. Designing an artificial neural network for forecasting tourism time series. Tourism Management, 27:781–790, 10 2006. URL: https://www.sciencedirect.com/ science/article/abs/pii/S0261517705000555, doi:10.1016/J.TOURMAN.2005.05.006
-
[7]
Zico Kolter, and Vladlen Koltun
Shaojie Bai, J. Zico Kolter, and Vladlen Koltun. An empirical evaluation of generic convolutional and recurrent networks for sequence modeling. 3 2018. URL: https://arxiv.org/pdf/1803.01271
arXiv 2018
-
[8]
Deep learning with long short-term memory networks for finan- cial market predictions
Thomas Fischer and Christopher Krauss. Deep learning with long short-term memory networks for finan- cial market predictions. European Journal of Operational Research , 270:654–669, 10 2018. URL: https: //www.sciencedirect.com/science/article/pii/S0377221717310652, doi:10.1016/J.EJOR.2017. 11.054
Show all 27 references
-
[9]
Multimodal fusion for sensor data using stacked autoencoders
Pengfei Zhang, Xiaoping Ma, Wenyu Zhang, Shaowei Lin, Huilin Chen, Arthur Lee Yirun, and Gaoxi Xiao. Multimodal fusion for sensor data using stacked autoencoders. 2015 IEEE 10th International Conference on Intelligent Sensors, Sensor Networks and Information Processing, ISSNIP...
2015
-
[10]
A practical guide to wavelet analysis
Christopher Torrence and Gilbert P Compo. A practical guide to wavelet analysis. Bulletin of the American Me- teorological Society, 79:61 – 78, 1998. URL: https://journals.ametsoc.org/view/journals/bams/ 79/1/1520-0477_1998_079_0061_apgtwa_2_0_co_2.xml, doi:10.1175/1520-0477(1...
1998 doi
-
[11]
E. O. Brigham and R. E. Morrow. The fast fourier transform. IEEE Spectrum, 4:63–70, 1967. doi:10.1109/ MSPEC.1967.5217220
1967
-
[12]
Webb, Shirui Pan, Charu Aggarwal, and Mahsa Salehi
Zahra Zamanzadeh Darban, Geoffrey I. Webb, Shirui Pan, Charu Aggarwal, and Mahsa Salehi. Deep learning for time series anomaly detection: A survey. ACM Computing Surveys, 57:42, 1 2024. URL: https://dl.acm. org/doi/10.1145/3691338, doi:10.1145/3691338/SUPPL_FILE/3691338.PDF
2024
-
[13]
Equipment anomaly detection for semiconductor manufac- turing by exploiting unsupervised learning from sensory data
Chieh Yu Chen, Shi Chung Chang, and Da Yin Liao. Equipment anomaly detection for semiconductor manufac- turing by exploiting unsupervised learning from sensory data. Sensors 2020, V ol. 20, Page 5650, 20:5650, 10
2020
-
[14]
Adel, and Mustapha Ouladsine
Samia Mellah, Youssef Trardi, Guillaume Graton, Bouchra Ananou, El Mostafa E.L. Adel, and Mustapha Ouladsine. Semiconductor multivariate time-series anomaly classification based on machine learning ensemble techniques*. IF AC-PapersOnLine, 55:476–481, 1 2022. doi:10.1016/J.IFA...
2022 doi
-
[15]
Failure detection and primary cause identification of multivariate time series data in semiconductor equipment
Minjae Baek and Seoung Bum Kim. Failure detection and primary cause identification of multivariate time series data in semiconductor equipment. IEEE Access, 11:54363–54372, 2023. doi:10.1109/ACCESS.2023. 3281407
2023 doi
-
[16]
Anomaly detection in time series data and its application to semiconductor manufacturing
Rakhoon Hwang, Seungtae Park, Youngwook Bin, and Hyung Ju Hwang. Anomaly detection in time series data and its application to semiconductor manufacturing. IEEE Access, 11:130483–130490, 2023. doi:10.1109/ ACCESS.2023.3333247
2023
-
[17]
Adaptive asymmetric least squares baseline estimation for analytical instruments
Sergio Oller-Moreno, Antonio Pardo, Juan Manuel Jimenez-Soto, Josep Samitier, and Santiago Marco. Adaptive asymmetric least squares baseline estimation for analytical instruments. In 2014 IEEE 11th International Multi- Conference on Systems, Signals & Devices (SSD14) , pages 1...
2014
-
[18]
Ricker, ormsby, klander, butterworth – a choice of wavelets | cseg recorder, 9 1994
Harold Ryan. Ricker, ormsby, klander, butterworth – a choice of wavelets | cseg recorder, 9 1994. URL: https://csegrecorder.com/articles/view/ ricker-ormsby-klander-butterworth-a-choice-of-wavelets
1994
-
[19]
Very deep convolutional networks for large-scale image recognition
Karen Simonyan and Andrew Zisserman. Very deep convolutional networks for large-scale image recognition. In International Conference on Learning Representations , 2015
2015
-
[20]
Berg, and Li Fei-Fei
Olga Russakovsky, Jia Deng, Hao Su, Jonathan Krause, Sanjeev Satheesh, Sean Ma, Zhiheng Huang, Andrej Karpathy, Aditya Khosla, Michael Bernstein, Alexander C. Berg, and Li Fei-Fei. ImageNet Large Scale Visual Recognition Challenge. International Journal of Computer Vision (IJC...
2015
-
[21]
On a classical problem of probability theory b
Paul Erd˝os and Alfréd Rényi. On a classical problem of probability theory b. 9 1961. URL: https://www. renyi.hu/~p_erdos/1961-09.pdf
1961
-
[22]
Neural architecture search: A survey, 2019
Thomas Elsken, Jan Hendrik Metzen, and Frank Hutter. Neural architecture search: A survey, 2019. URL: https://arxiv.org/abs/1808.05377, arXiv:1808.05377
2019 arXiv
-
[23]
Robin M. Schmidt. Recurrent neural networks (rnns): A gentle introduction and overview, 2019. URL: https: //arxiv.org/abs/1912.05911, arXiv:1912.05911
2019 arXiv
-
[24]
Transformers in vision: A survey
Salman Khan, Muzammal Naseer, Munawar Hayat, Syed Waqas Zamir, Fahad Shahbaz Khan, and Mubarak Shah. Transformers in vision: A survey. ACM Computing Surveys, 54(10s):1–41, January 2022. URL: http: //dx.doi.org/10.1145/3505244, doi:10.1145/3505244
2022 doi
-
[25]
Lafferty, Andrew McCallum, and Fernando C
John D. Lafferty, Andrew McCallum, and Fernando C. N. Pereira. Conditional random fields: Probabilistic models for segmenting and labeling sequence data. In Proceedings of the Eighteenth International Conference on Machine Learning, ICML ’01, page 282–289, San Francisco, CA, U...
2001
-
[26]
Rahmani, and Pasi Liljeberg
Yuning Wang, Zhongqi Yang, Iman Azimi, Amir M. Rahmani, and Pasi Liljeberg. Attention-based explainable ai for wearable multivariate data: A case study on affect status prediction. In 2024 IEEE 20th International Conference on Body Sensor Networks (BSN) , pages 1–4, 2024. doi:...
2024
-
[2020]
URL: https://www.mdpi.com/1424-8220/20/19/5650/htmhttps://www.mdpi.com/1424-8220/ 20/19/5650, doi:10.3390/S20195650
Reviewed August 6, 2026 · model on record in the stance chip above.
Discussion (0). Continue with ORCID to comment.