REVIEW 3 major objections 4 minor 4 cited by
ChronoFlow: A Data-Driven Model for Gyrochronology
T0 review · 3 major / 4 minor · reviewed 2026-08-11 · deepseek-v4-flash
Pith's one-line read A neural density model trained on ~7,600 open-cluster rotation periods dates star clusters to ~15% (0.06 dex) and individual stars to ~0.7 dex, learning the full rotation distribution instead of fitting a spin-down law.
desk verdict A genuinely useful catalog and a flexible gyrochronology model; just don't treat the 0.06 dex as an absolute age accuracy — it's precision on the fiducial age scale. read the letter →
The pith
A machine-rendered reading of the paper's core claim, the machinery that carries it, and where it could break.
The reading
What carries the argument
The load-bearing object is the conditional normalizing flow: a neural spline flow with three transform layers and eight bins trained by minimizing the negative log-likelihood of $P(P_{\mathrm{rot}} \mid C_0, \sigma_{C_0}, \tau)$, with the flow density blended against a uniform background component weighted by each star's cluster membership probability and a fixed 5% outlier probability. Conditioning the density on color and photometric uncertainty is what insulates the model from selection effects in color and age, because at every age the conditional density integrates to one along the color axis rather than reflecting where stars happen to be observed. For inference, the same learned density is plugged into a factorized Bayes equation, and the cluster posterior is built as the product of individual stellar likelihoods times a uniform age prior over 1 Myr to 13.8 Gyr. The training catalog is equally load-bearing: 16 literature rotation catalogs harmonized onto Gaia DR3 photometry, de-reddened with three-dimensional dust maps, with HDBScan membership probabilities where available.
What would settle it
Hold out from training a cluster whose age is known independently of isochrone fitting, for example from the lithium-depletion boundary or from eclipsing binaries, and test whether ChronoFlow recovers that age within its claimed 0.06 dex scatter as it does for the isochronal labels in leave-one-cluster-out tests. If the scatter does not reproduce against independent ages, the claimed precision is an artifact of training-label agreement.
Extended reading notes
Core claim
ChronoFlow models the conditional distribution $P(P_{\mathrm{rot}} \mid C_0, \sigma_{C_0}, \tau)$ — rotation period given de-reddened Gaia color, photometric uncertainty, and age — as a conditional normalizing flow, so it captures the observed width and shape of the rotation sequence at fixed color and age instead of collapsing it to a mean track. Inserted into the Bayesian identity $P(\tau \mid P_{\mathrm{rot}}, C_0, \sigma_{C_0}) \propto P(P_{\mathrm{rot}} \mid C_0, \sigma_{C_0}, \tau)\,P(C_0 \mid \tau, \sigma_{C_0})\,P(\tau)$, the learned density yields posterior age distributions for single stars, and the product of stellar likelihoods across a cluster's members yields its age posterior. In leave-one-cluster-out tests the inferred cluster ages scatter around the fiducial literature ages with an intrinsic scatter of 0.06 dex and no systematic offset, while individual stellar posteriors carry a median $1\sigma$ width of about 0.7 dex, with 79% of the fiducial stellar ages falling inside the $1\sigma$ interval. The authors present this as evidence that a fully data-driven, dispersion-aware model can forward-model rotational evolution and date both coeval populations and individual stars across a wider parameter space than existing empirical models.
Load-bearing premise
The load-bearing premise is that the literature cluster ages used as training labels are accurate and that the rotation-age relation is universal across clusters at fixed color, so if the isochronal fiducial ages are systematically biased, or if metallicity or formation conditions shift rotation at fixed age and color, the measured 0.06 dex scatter reflects agreement with those labels rather than absolute age accuracy.
Editorial extensions
If this is right
- Cluster ages from rotation alone reach about 15% statistical precision, which is competitive with isochrone fitting for low-mass main-sequence populations where isochrones are weakest.
- Individual stellar ages to roughly 0.7 dex become available for main-sequence FGKM stars, enough to place the Sun at $5.1^{+1.7}_{-1.4}$ Gyr, consistent with its true age.
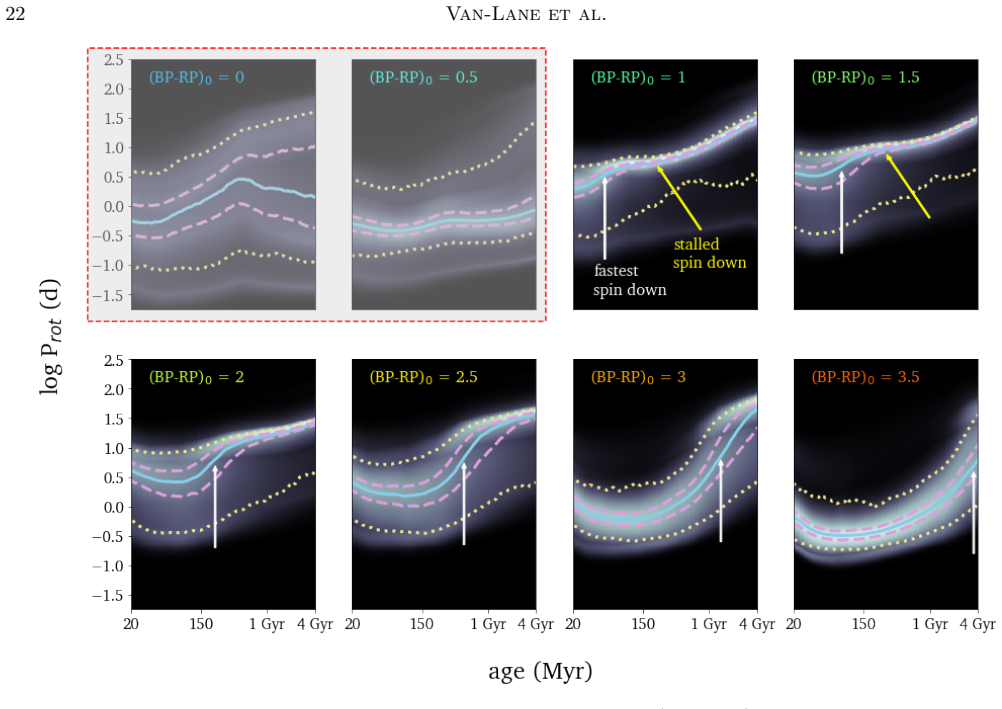
- The learned densities act as evolutionary tracks that reproduce known features such as stalled spin-down near $C_0 \approx 1$–$2$ and delayed convergence for the reddest stars, giving physical spin-down models a direct target to explain.
- Previously uncalibrated systems can be dated immediately: the paper reports $245^{+40}_{-34}$ Myr for M34, $132^{+20}_{-18}$ Myr for NGC 2516, $121^{+48}_{-25}$ Myr for NGC 6709, and $142^{+26}_{-21}$ Myr for the Theia 456 stream.
- The standardized catalog of 7,615 rotators, with membership probabilities and propagated photometric errors, is released as a public benchmark for future gyrochronology work.
Reading between the lines
- If the claimed precision survives contact with ages measured independently of isochrone fitting — lithium-depletion boundaries, eclipsing binaries, asteroseismology — gyrochronology could become the default cheap age estimator for low-mass stars across the disk; the 0.7 dex single-star scatter and the bias against intermediate-period fast rotators would still limit precision uses such as exoplanet
- The five outlier clusters are worth attention as a self-test: ChronoFlow's ages for M34 and NGC 2516 side with a younger subset of the literature, which indicates the model can disagree with its own training labels in particular cases rather than merely memorizing them.
- A concrete next test that the paper's own caveats point to is metallicity: because all its clusters are near-solar, ChronoFlow cannot yet say whether rotation-age relations differ with composition, so rotation data for metal-poor or metal-rich clusters would either confirm universality or force metallicity into the model.
- The same conditioning architecture could be retargeted at other age-sensitive observables, such as activity indices, which the paper flags as a future direction.
Signed reviews
Editorial analysis
A structured set of objections, weighed in public.
Referee Report
Summary. The paper presents ChronoFlow, a conditional normalizing-flow model for the joint distribution of rotation period and color at fixed age, trained on a newly compiled catalog of approximately 7,600 stars in 30 open clusters and associations (1.5 Myr to 4 Gyr). The authors standardize Gaia DR3 photometry, de-redden using 3D dust maps, assign cluster membership probabilities, and adopt fiducial ages from four PARSEC-based literature catalogs. They validate the model with leave-one-cluster-out cross-validation for cluster ages and batch LOOCV for individual stellar ages, report systematic uncertainties due to dust maps, membership, and calibration ages, and apply the model to M34, NGC 2516, NGC 6709, and Theia 456. The central quantitative claims are a cluster-age statistical uncertainty of 0.06 dex (about 15%), an individual stellar age uncertainty of 0.7 dex, and a total cluster-age error budget of 0.08 dex after adding 0.06 dex of systematics.
Significance. The paper makes a strong empirical contribution: it assembles the largest standardized open-cluster rotation catalog to date, makes the code publicly available, and introduces a flexible probabilistic model that captures the observed rotational dispersion without imposing a parametric spindown law. The LOOCV scheme is a meaningful test of generalization to unseen clusters, and the systematic tests in Section 6 and Appendix G are careful and well documented. The comparisons to GPgyro and gyro-interp help establish the practical regime of the model. If the headline error budget is properly qualified as precision on the adopted literature age scale, the work provides a useful empirical baseline and a forward-modeling tool for gyrochronology.
major comments (3)
- [§5.1, Table 3, §G.4]
- [§5.1, Figure 11]
- [§5.2, Figures 13–16]
minor comments (4)
- [Figure 5 caption]
- [Figure 12 caption]
- [§6.1, §6.2]
- [§5.1.1]
Circularity Check
No construction-level circularity: the age predictions are a genuinely held-out supervised regression, but the error budget is scale-relative to the adopted literature ages.
full rationale
ChronoFlow's derivation is a supervised density-estimation pipeline: rotation periods, colors, and photometric uncertainties are inputs; literature cluster ages in Section 2.4 are training labels; the conditional normalizing flow is trained with the loss in Eq. (10); and cluster/stellar age posteriors follow from Bayes' rule in Eq. (5). The headline 0.06 dex cluster-age uncertainty comes from leave-one-cluster-out cross-validation (Section 5.1), where the held-out cluster's own age label was not used to fit the model, so the recovery is not forced by construction. The systematic budget in Table 3 is likewise measured by retraining under alternative dustmaps, membership cuts, and age scales (Appendices G.1-G.4), not by re-fitting the predicted ages. The main caveat, which the paper itself acknowledges in Section 6 and Appendix G.4 ('Since cluster ages are inherently model-dependent, the choice of model calibration ages affects age inference'), is that a common multiplicative offset in all training-age labels would leave the LOOCV residuals essentially unchanged, so the 0.06 dex statistical and 0.08 dex total figures bound precision on the adopted age scale rather than absolute age accuracy against an external zero-point. The external Sun check (Section 5.2) is a single anchor with roughly 1.5 Gyr uncertainty. This is a calibration identifiability limitation, not a case where a prediction reduces by construction to its inputs; the self-citation to Van-Lane et al. (2023) is only a proof-of-concept reference and is not load-bearing here.
Assumptions & free parameters
free parameters (6)
- Outlier probability pout =
0.05
- Color cut for age inference =
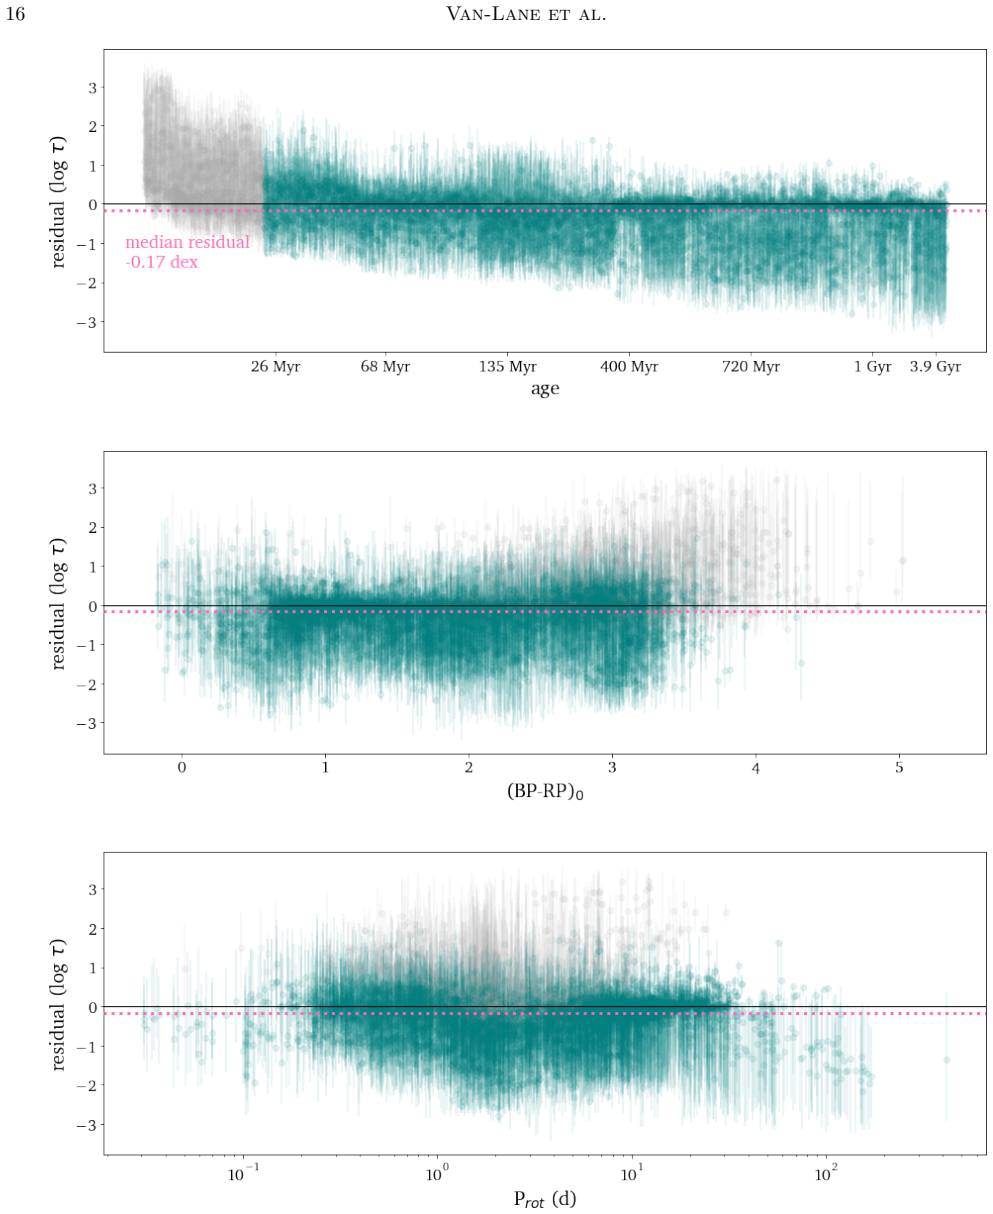
C0 = 0.5 (text says C0 > 0.5; figure captions say exclude (BP-RP)0 < 0.5)
- Duplicate-period quality cut =
df < 0.2
- Default cluster membership probability =
0.9 (and 0.5, 0.7, 0.84, 0.85 in different clusters)
- Dust conversion constant =
0.829 (Eqn. 1)
- Normalizing flow hyperparameters =
3 transform layers, 8 bins, 5000 epochs, 1e-3 to 5e-7 learning rate
assumptions (6)
- standard math Bayes' theorem and probability calculus
- domain assumption Uniform age prior on [1, 13800] Myr
- domain assumption Color distribution P(C0|tau) is uniform in [-0.05, 3.8] and independent of age
- domain assumption The rotation-age relation is universal across clusters at fixed de-reddened color
- domain assumption Fiducial literature cluster ages from G+18, B+19, CG+20, L+23 are accurate
- domain assumption De-reddening conversions in Eqns. (1)-(2) are correct
Cite this review
Pith. "Pith review of ChronoFlow: A Data-Driven Model for Gyrochronology." pith.science (2026). https://pith.science/paper/W4BQRIPN
@misc{pith2026241212244,
  author       = {Pith},
  title        = {Pith review of: ChronoFlow: A Data-Driven Model for Gyrochronology},
  year         = {2026},
  howpublished = {\url{https://pith.science/paper/W4BQRIPN}},
  note         = {Machine review of arXiv:2412.12244}
}
abstract
Gyrochronology is a technique for constraining stellar ages using rotation periods, which change over a star's main sequence lifetime due to magnetic braking. This technique shows promise for main sequence FGKM stars, where other methods are imprecise. However, the observed dispersion in rotation rates for similar coeval stars has historically been difficult to characterize. To properly understand this complexity, we have assembled the largest standardized data catalog of rotators in open clusters to date, consisting of $\approx$8,000 stars across 30 open clusters/associations spanning ages of 1.5 Myr to 4 Gyr. We have also developed ChronoFlow: a flexible data-driven model which accurately captures observed rotational dispersion. We show that ChronoFlow can be used to accurately forward model rotational evolution, and to infer both cluster and individual stellar ages. We recover cluster ages with a statistical uncertainty of 0.06 dex ($\approx$15%), and individual stellar ages with a statistical uncertainty of 0.7 dex. Additionally, we conducted robust systematic tests to analyze the impact of extinction models, cluster membership, and calibration ages. These contribute an additional 0.06 dex of uncertainty in cluster age estimates, resulting in a total error budget of 0.08 dex. We apply ChronoFlow to estimate ages for M34, NGC 2516, NGC 6709, and the Theia 456 stellar stream. Our results show that ChronoFlow can precisely estimate the ages of coeval stellar populations, and constrain ages for individual stars. Furthermore, its predictions may be used to inform physical spin down models. ChronoFlow is publicly available at https://github.com/philvanlane/chronoflow.
Figures


Figures from the paper (26 more)






Forward citations
Cited by 4 Pith papers
-
The Maunder Model and Catalog: Stellar Rotation, Bimodal Activity, and Magnetic Braking in Kepler Main-Sequence Stars
A hybrid self-supervised and consensus-supervised model yields calibrated rotation periods for 148,746 Kepler main-sequence stars and identifies bimodal signals where the longer mode is the true rotation.
-
Hints of enhanced magnetic activity after the intermediate rotation period gap as traced by the chromospheric Ca ii infrared triplet
Main-sequence Kepler stars exhibit enhanced chromospheric Ca II IRT activity after the intermediate-period gap, paralleling the photospheric Sph signature.
-
Anchoring Stellar Age Indicators: A Cross-Calibration of [C/N] and Gyrochronology Ages via the Age-Velocity-Dispersion Relation
After anchoring gyrochronology and [C/N] ages to the same age-velocity-dispersion relation, the two methods give consistent ages once small offsets are subtracted, and their valid parameter spaces are mapped.
-
Kepler meets Gaia DR3: homogeneous extinction-corrected color-magnitude diagram and binary classification
A new public catalog classifies nearly 200,000 Kepler stars by evolutionary stage and binarity using Gaia DR3 astrometry, photometry, and extinction-corrected colors.
Reference graph
Works this paper leans on
-
[1]
photometrically and spectro- scopically single stars)
We only include stars with BinPhot and BinSpec values that are both 0 (ie. photometrically and spectro- scopically single stars)
-
[2]
We only include stars with a BinRUWE value of 0. This corresponds to stars with a Gaia RUWE value of <1.4, which is a cut we apply in our final selection anyways
-
[3]
We only include stars with a BinFlag value of 0 or 1 (either a MS single star or unknown)
-
[4]
We also exclude four Pleiades stars that L23 sourced directly from the Hartman et al. (2010) catalog, but for which the original rotation period was measured in other works (Prosser et al. 1993; a reference labelled P95 which we assume to be Prosser et al. 1995; and Messina 2001), and for which Hartman et al. (2010) were not able to measure rotation perio...
work page 2010
-
[5]
If a star had a DR2 ID in the source catalog, we found the nearest neighbors in DR3 using the gaiaedr3.dr2 neighbourhood table. If there are multiple matches, we consider the angular and magnitude differences, and select the best match based on both criteria. We find a match for 2,495 rotators this way
-
[6]
If the star had a DR2 ID but no neighbor in the above step, or did not have a Gaia DR2 ID in the source catalog, we used topcat (Taylor 2005) and/or the Gaia archive search to find the closest match within 1” using the R.A. and Decl. values provided with the catalog. In some cases this radius had to be extended to 2” to find a match
work page 2005
-
[7]
(2021) catalog for which no R.A
There were 89 stars in the Godoy-Rivera et al. (2021) catalog for which no R.A. or Decl. was provided in that paper, but for which we found measurements in the rotation source catalogs for those rotators. 17 of these had Gaia DR3 matches within 1”, however four of those 17 were ambiguous so we exclude those from our sample. 36 V an-Lane et al. The other 7...
work page 2021
-
[8]
(2013) catalog had Gaia DR3 crossmatches within 1as
For H Persei, 483 of the 507 stars in the Moraux et al. (2013) catalog had Gaia DR3 crossmatches within 1as. An additional 6 had crossmatches within 5as, and 15 had crossmatches between 5 and 10as. At these larger radii, since the stars often had multiple crossmatches, we excluded these from our catalog and retain the 483 initial 1” crossmatches
work page 2013
Show all 18 references
-
[9]
stability values
The crossmatches were all double checked using apparent magnitudes in the G and V bands where available (we converted G to V and vice versa where necessary using the G − V and B − V relationships presented in table 5.8 of van Leeuwen et al. 2018). In some cases, better matches...
2018
-
[10]
Using LOOCV, we trained a model using the E23 extinctions where there was overlap in coverage, and evaluated the cluster posteriors with E23 photometry
-
[11]
We trained a model using the E23 extinctions, but used B19 to infer the cluster ages
-
[12]
We trained a model using the B19 extinctions, but used E23 to infer the cluster ages
-
[13]
The resulting posteriors for each test case are shown in figures 29 and 30
We trained a model using the B19 extinctions, and used B19 photometry to infer the cluster ages. The resulting posteriors for each test case are shown in figures 29 and 30. The scatter for all four tests for the Pleiades was small ( σ = 0.014 dex). The M35 age estimates are mo...
2020
-
[14]
The base model trained on all clusters excluding H Persei
-
[15]
These estimates come from Stauffer et al
We instead used Lithium depletion ages for the clusters that have such estimates available (α Persei, IC 2391, IC 2602, NGC 2451A, NGC 2547, and Pleiades). These estimates come from Stauffer et al. (1998), Stauffer et al. (1999), Oliveira et al. (2003), Jeffries & Oliveira (20...
1998
-
[16]
A model where we have taken the average age from all literature sources described in table 2 instead of just the four primary catalogs
-
[17]
Ages directly from Cantat-Gaudin et al. (2020). Since they do not provide ages for Hyades or M34, we instead use the Bossini et al. (2019) age for M34 and the Gaia Collaboration et al. (2018) age for Hyades
2020
-
[18]
A model where we prioritize the B+19 and G+18 ages where available, then L+23, then CG+20. We use the average of B+19 and G+18 for 11 clusters (where both have estimates), just B+19 for eight clusters, G+18 for four clusters, L+23 for two clusters, and CG+20 for the last three...
2023
Reviewed August 11, 2026 · model on record in the stance chip above.
Discussion (0). Continue with ORCID to comment.