REVIEW 3 major objections 5 minor 74 references
BYO-Eval: Build Your Own Dataset for Fine-Grained Visual Assessment of Multimodal Language Models
T0 review · 3 major / 5 minor · reviewed 2026-08-07 · deepseek-v4-flash
Pith's one-line read The paper argues that aggregate accuracy scores on general benchmarks hide predictable, model-specific perception failures in vision-language models, and that these failures surface only when a single visual attribute is varied under…
desk verdict A genuinely useful VLM stress-test toolkit; the real-synthetic 'strong proxy' claim is overstated, but the core diagnostic methodology holds up and deserves peer review. read the letter →
The pith
A machine-rendered reading of the paper's core claim, the machinery that carries it, and where it could break.
The reading
What carries the argument
The framework's organizing mechanism is the Cartesian product over controlled variables: for variables v1,...,vn the dataset is D = V1 × ... × Vn, so every combination of tested levels is rendered while unrelated scene parameters stay constant. Scenes are produced procedurally in Blender through its Python API, each image carries an automatic legend with ground-truth object states, and each task type (counting, localization, identification) has its own scoring metric, such as Mean Absolute Error for counts and L1 grid distance for localization. This design isolates the effect of the single stressed variable, turning a VLM evaluation into an interpretable diagnostic comparable to an ophthalmologic field test.
What would settle it
Render the same diagnostic tasks on natural, unmatched photographs of chessboards and poker tables and check whether the documented bias patterns still appear, such as GPT-4.1 overcounting blurred scenes and undercounting overlapped cards, or LLaMA-4-Scout emitting out-of-bounds coordinates on 4×4 boards; if those patterns vanish, the synthetic-to-real proxy claim fails. A cheaper version is to repeat the 80-scene physical reproduction check on the poker counting task, which the paper itself shows to be far harder for models.
Extended reading notes
Core claim
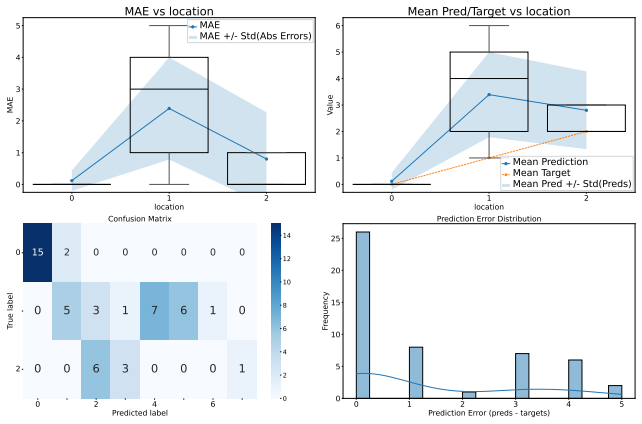
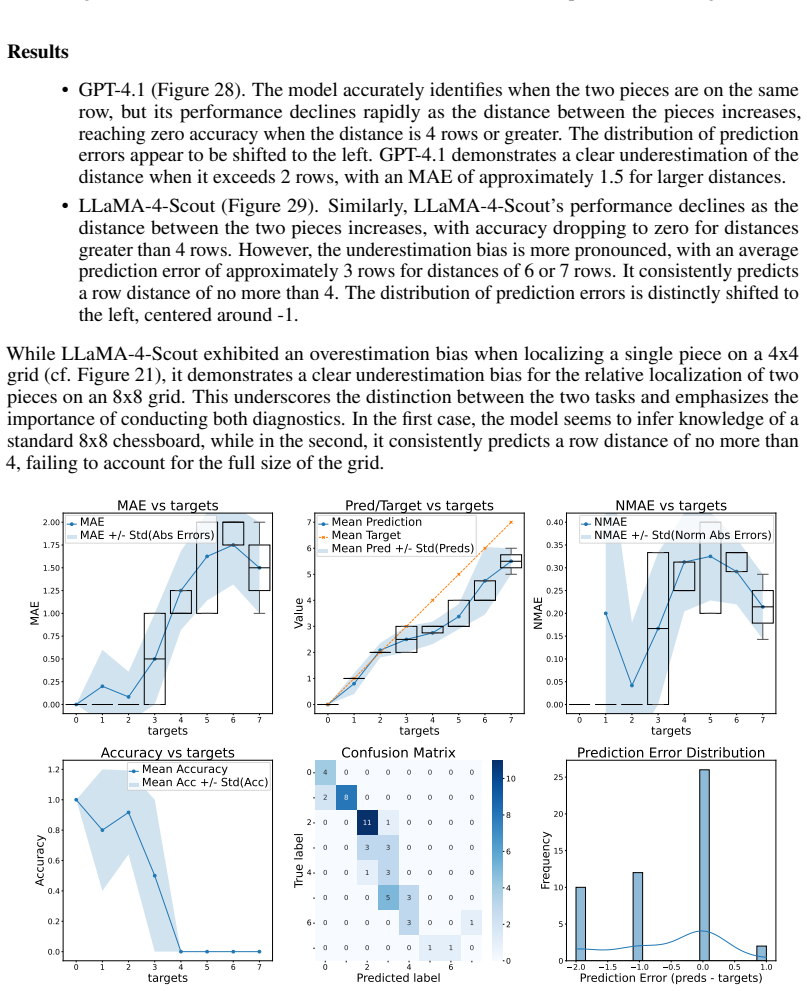
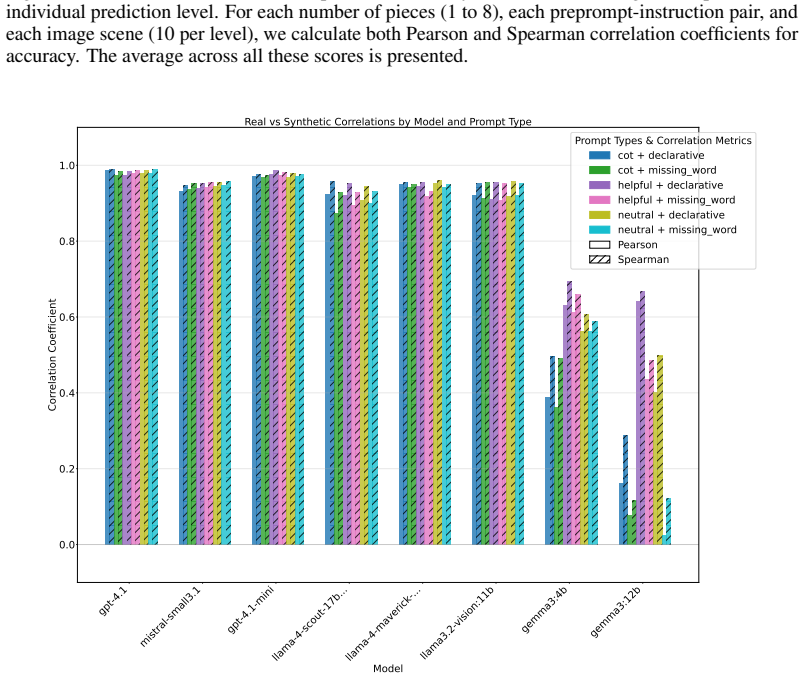
The paper's central claim is that general-purpose benchmarks mask brittle behaviors that only emerge under controlled diagnostic stress. The authors establish this by generating synthetic chess and poker images with precise, per-attribute control and measuring how each VLM's accuracy degrades as one variable is stressed. The discovered patterns are systematic and model-dependent: GPT-4.1 stays accurate up to five chess pieces yet overcounts beyond that, undercounts poker cards increasingly with horizontal overlap, and overcounts as blur rises; LLaMA-4-Scout predicts out-of-bounds row and column coordinates on 4×4 boards, apparently inferring a standard 8×8 chessboard, and underestimates relative distances between pieces on 8×8 boards. The paper further supports the real-world relevance of these synthetic diagnostics with matched physical reproductions of 80 chess scenes, reporting Spearman and Pearson correlations above 0.99 for most tested models when synthetic and real counting accuracy are compared.
Load-bearing premise
The claim that synthetic chess and poker scenes, plus physical reproductions matched to synthetic legends for counting one to eight pieces, are a valid proxy for real-world visual skills rests on those matched scenes standing in for natural, unmatched imagery.
Editorial extensions
If this is right
- Evaluation practice can move from static, aggregate benchmarks to task-specific synthetic diagnostics that separate perception failures from reasoning failures.
- Model selection for an application can be based on verified skill profiles, such as which model remains robust under blur, occlusion, or distant camera viewpoints.
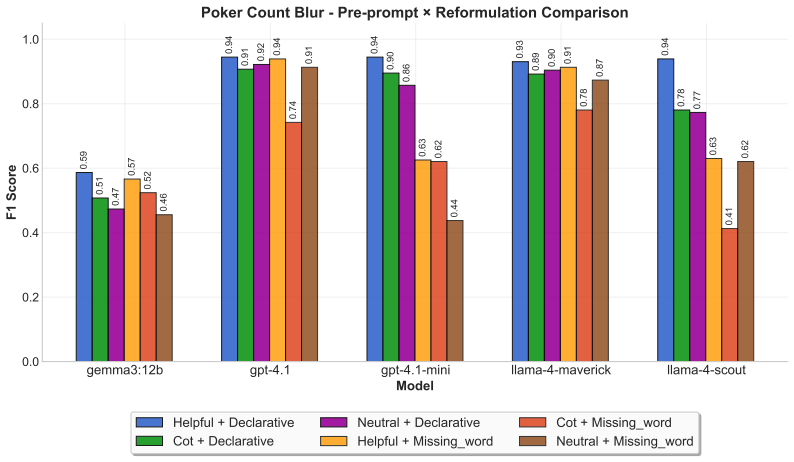
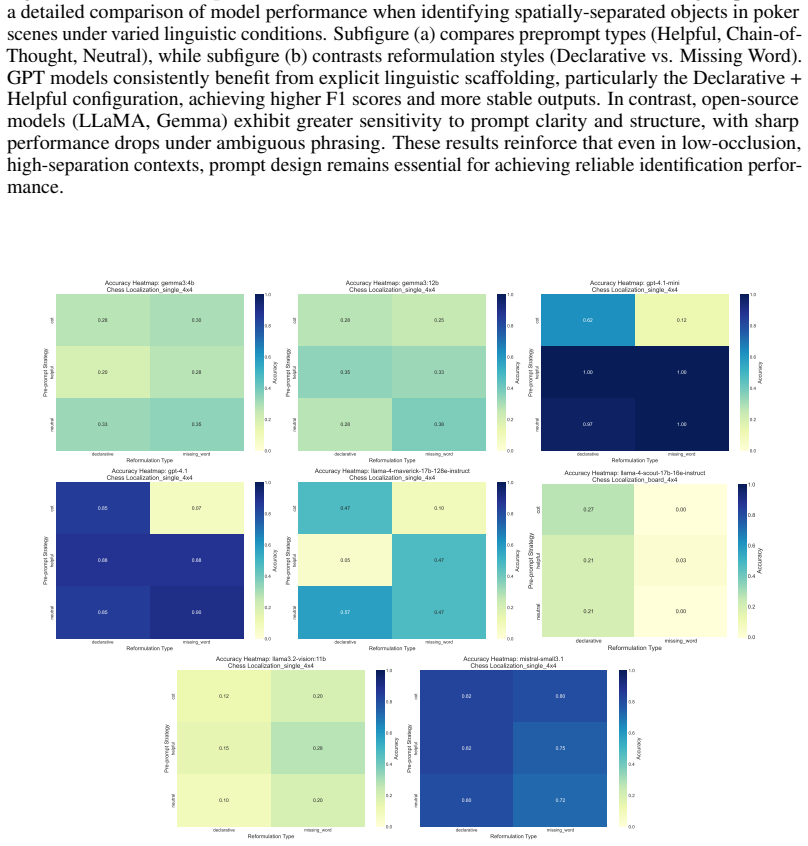
- Prompt phrasing is part of the measured capability: declarative instructions paired with helpful preprompts consistently raise accuracy, so perception scores are only meaningful when reported with the full prompt protocol.
- Strong synthetic-to-real correlation for most models implies that targeted synthetic tests can forecast counting accuracy on matched real scenes, at least in structured chess-like layouts.
- Failure modes are model-specific rather than universal, so a model that leads on an aggregate leaderboard may still be the wrong choice in a particular perceptual setting.
Reading between the lines
- If this diagnostic logic transfers to industrial scenes, the same one-attribute-at-a-time rendering could stress-test models for specific production tasks, such as counting items on a conveyor or locating defects, before deployment.
- The paper's validation covered only counting on 80 chess scenes physically reproduced from synthetic legends; an obvious extension is to test whether the documented bias patterns (blur overcount, overlap undercount, 8×8 anchoring) replicate on unconstrained real photographs.
- The strong synthetic-real agreement for chess counting may partly reflect chess being well represented in VLM training data; the poker scenes, which the paper shows are much harder, could exhibit weaker transfer and would provide a sharper test of the proxy claim.
- Following the paper's own sketch, the same framework could be extended to brightness, color, and measurement skills, producing a full perceptual skill card for each model instead of a single score.
Editorial analysis
A structured set of objections, weighed in public.
Referee Report
Summary. The paper introduces BYO-Eval, a framework for procedurally generating synthetic image datasets with controlled visual attributes (object count, blur, camera distance, overlap) to create fine-grained diagnostic tasks—counting, localization, and identification—for vision-language models (VLMs). Using Blender, the authors generate chess and poker scenes where one visual variable is varied while others are held constant, and they evaluate eight VLMs (GPT-4.1, GPT-4.1-mini, LLaMA-4-Scout/Maverick, Gemma3-4B/12B, LLaMA3.2-Vision, Mistral-3.1) on this suite. The paper reports several brittle behaviors, such as GPT-4.1 overestimating chess piece counts and underestimating overlapping poker cards, and LLaMA-4-Scout exhibiting an 8x8 board bias in 4x4 localization. It also includes a real-world validation study (Appendix E) with 80 physically recreated chess scenes, claiming strong correlations (Spearman > 0.99 for most models) between synthetic and real counting performance after averaging over samples and prompt variants. The central claim is that general-purpose benchmarks mask these brittle behaviors and that controlled diagnostic stress reveals them.
Significance. If validated, the methodology offers a useful complement to aggregate benchmarks: it is open-source, reproducible, and provides a systematic one-variable-at-a-time control over visual parameters without fitting any model parameters. The diagnostic approach, inspired by ophthalmologic stress tests, is a genuinely valuable idea for isolating perception failures from reasoning or textual biases, and the authors demonstrate a broad range of tasks across eight VLMs. However, the external-validity evidence is currently weak: the only real-world test is a single counting task on 80 scenes that are physically recreated from the same synthetic legends, and the headline correlation is computed over aggregated level means rather than per-image predictions. The internal synthetic diagnostics are the paper's core strength, but the claim that synthetic performance is a strong proxy for real-world counting is not established by the reported statistics.
major comments (3)
- [Appendix E, Figures 51–53; Section 4.2] The headline correlation of >0.99 between synthetic and real counting is computed by first averaging over 10 samples and 6 preprompt–instruction pairs, then correlating only the 8 target-count-level means. Because counting accuracy declines monotonically with object count for essentially every model on both image sets, a correlation over level means is near 1 regardless of per-image transfer. The per-sample correlations in Figure 52 are much lower—e.g., 0.48–0.57 for Gemma3-4B and 0.23–0.36 for Gemma3-12B—so the statement in Appendix E that synthetic performance is "a strong proxy for real-world counting ability" is not supported. Please report per-level or per-image correlations, or use an agreement metric (e.g., Bland–Altman limits, prediction-error agreement), and temper the "strong proxy" claim accordingly.
- [Appendix E, Figure 50; Section 5] The 80 real scenes are physical recreations of the synthetic chess legends, so high correlation partly reflects that the real stimuli replicate the synthetic content by construction rather than demonstrating transfer to natural, unmatched imagery. The paper's own Limitations section (Section 5) concedes that more realistic, industrial-scenario images are future work. Since no transfer check is provided for blur, overlap, or localization—the very behaviors highlighted as brittle in the paper—the practical real-world relevance of those diagnostic findings is not established. I recommend either adding at least one unmatched real-image condition (e.g., an existing counting benchmark) or explicitly reframing the real-synthetic comparison as a sanity check of physical plausibility, not evidence of generalization.
- [Sections 4.1, B.4, B.9; Tables 2–3; Figure 36] Per-cell sample sizes are small (k=5 or 10 images per condition) and the paper reports only means and standard deviations, with no confidence intervals or significance tests. For example, the blur-dependent overestimation of GPT-4.1 in Figure 14 is based on 5 samples per blur level, and Figure 36a shows cell-level NMAE differences (e.g., 0.00 vs. 0.40) without any measure of uncertainty. These small samples make specific quantitative claims about model biases fragile; at minimum, per-cell error bars or bootstrap intervals should be reported, and the conclusions should be limited to the observed qualitative directions rather than the precise magnitudes.
minor comments (5)
- [Abstract] The word "opthalmologic" should be spelled "ophthalmologic".
- [Section 2, paragraph 1] The phrase "precised, tailored evaluation" should read "precise, tailored evaluation".
- [Tables 2 and 3 captions] Table 2 says "Mean and standard deviation over 50 images for each task," while Table 3 says "40 samples per level"; please clarify the per-cell sample sizes and how they differ across tasks.
- [Figures 14 and 15 captions] The phrase "blur decrease (higher values meaning less blur)" is confusing given the x-axis is labeled "blur" with values 1–5; specify which direction corresponds to stronger blur.
- [Appendix C, first paragraph] The sentence "All experiments are executed using a unified evaluation pipeline..." appears nearly verbatim twice; please remove the duplicate.
Circularity Check
Real-world transfer claim rests on matched scenes and aggregated correlations; the core synthetic diagnostics are self-contained.
-
self definitional
[Appendix E (Correlation between synthetic and real data), Figures 51–53; cf. Section 5 Limitations]
"For each number of pieces, we reproduce in real life 10 chess scenes taken from the synthetic data, using their legend as ground truth (see Figure 50). ... When we average over all ten images per level and all preprompt and reformulation results, Pearson and Spearman correlation coefficients reach above 0.99 on the aggregated accuracies for the strongest models ... This high overall correlation for advanced models suggests that performance on synthetic diagnostic datasets is a strong proxy for real-world counting ability in structured visual tasks."
The 'real-world' validation set is not independently sampled: it is a physical recreation of the synthetic scenes, with the synthetic legends used as ground truth, so agreement between real and synthetic partly measures self-consistency of the reproduction rather than transfer to natural imagery. Moreover, the >0.99 correlation is obtained after averaging accuracies over 10 samples and 6 prompt variants and then correlating only 8 target-count level means; because counting accuracy declines monotonically with object count for essentially every model on both image sets, such level-mean correlations are near 1 by construction.
full rationale
The core diagnostic evaluation is self-contained: images are generated from explicit yaml configurations, ground-truth labels come from Blender scene legends, and metrics (MAE, accuracy, F1, localization distance) are standard with no fitted parameters and no prediction derived from the benchmark's own outputs. The central claim that controlled synthetic stress tests reveal brittle behaviors is supported by the internal diagnostics themselves (e.g., GPT-4.1 overcounting under blur, LLaMA-4-Scout extrapolating to an 8x8 board, overlap-induced underestimation). The only load-bearing circularity is in Appendix E: the real-world validation images are physically recreated from the synthetic legends, and the reported >0.99 correlation is computed over aggregate count-level means, while the per-sample correlations reported in the same appendix are substantially lower. That makes the 'strong proxy for real-world counting' claim partly circular and overstated, but it is a supporting validation rather than the main derivation. The self-contained nature of the synthetic diagnostic methodology keeps the overall circularity score low.
Assumptions & free parameters
free parameters (2)
- k images per configuration level =
5 or 10
- blur f-stop presets =
f/9.0, f/4.0, f/2.0, f/1.0, f/0.5
assumptions (4)
- domain assumption Rendered Blender scenes are an ecologically valid proxy for real visual scenes in VLM evaluation
- domain assumption Varying one visual variable while holding others constant isolates the tested perceptual skill
- domain assumption Prompt engineering (debiased, declarative, etc.) adequately controls linguistic priors so that errors can be attributed to perception
- standard math Standard metrics (accuracy, MAE, F1) are appropriate operationalizations of counting, localization, and identification skills
Cite this review
Pith. "Pith review of BYO-Eval: Build Your Own Dataset for Fine-Grained Visual Assessment of Multimodal Language Models." pith.science (2026). https://pith.science/paper/XVHEU2CP
@misc{pith2026250605440,
  author       = {Pith},
  title        = {Pith review of: BYO-Eval: Build Your Own Dataset for Fine-Grained Visual Assessment of Multimodal Language Models},
  year         = {2026},
  howpublished = {\url{https://pith.science/paper/XVHEU2CP}},
  note         = {Machine review of arXiv:2506.05440}
}
read the original abstract
Visual Language Models (VLMs) are now sufficiently advanced to support a broad range of applications, including answering complex visual questions, and are increasingly expected to interact with images in varied ways. To evaluate them, current benchmarks often focus on specific domains (e.g., reading charts), constructing datasets of annotated real images paired with pre-defined Multiple Choice Questions (MCQs) to report aggregate accuracy scores. However, such benchmarks entail high annotation costs, risk information leakage, and do not clarify whether failures stem from limitations in visual perception, reasoning, or general knowledge. We propose a new evaluation methodology, inspired by ophthalmologic diagnostics, leveraging procedural generation of synthetic images to obtain control over visual attributes and precisely reveal perception failures in VLMs. Specifically, we build collections of images with gradually more challenging variations in the content of interest (e.g., number of objects in a counting task) while holding other visual parameters constant. This diagnostic allows systematic stress testing and fine-grained failure analysis, shifting the focus from coarse benchmarking toward targeted and interpretable assessment of VLM capabilities. Our code is available at https://github.com/byoeval/BYO-EVAL.
Figures


Figures from the paper (50 more)










Reference graph
Works this paper leans on
-
[1]
A survey of multimodal large language model from a data-centric perspective,
T. Bai, H. Liang, B. Wan, L. Yang, B. Li, Y . Wang, B. Cui, C. He, B. Yuan, and W. Zhang, “A survey of multimodal large language model from a data-centric perspective,”arXiv:2405.16640, 2024
arXiv 2024
-
[2]
Understanding the limits of vision language models through the lens of the binding problem,
D. Campbell, S. Rane, T. Giallanza, C. N. De Sabbata, K. Ghods, A. Joshi, A. Ku, S. Frankland, T. Griffiths, J. D. Cohen, et al., “Understanding the limits of vision language models through the lens of the binding problem,” Advances in Neural Information Processing Systems, vol. 37, pp. 113436–113460, 2024
work page 2024
-
[3]
Vision language models are blind,
P. Rahmanzadehgervi, L. Bolton, M. R. Taesiri, and A. T. Nguyen, “Vision language models are blind,” in Proceedings of the Asian Conference on Computer Vision, pp. 18–34, 2024
work page 2024
-
[4]
T. Rädsch, L. Mayer, S. Pavicic, A. E. Kavur, M. Knopp, B. Öztürk, K. Maier-Hein, P. F. Jaeger, F. Isensee, A. Reinke,et al., “Bridging vision language model (vlm) evaluation gaps with a frame- work for scalable and cost-effective benchmark generation,”arXiv preprint arXiv:2502.15563, 2025
arXiv 2025
-
[5]
Vlmevalkit: An open-source toolkit for evaluating large multi-modality models,
H. Duan, J. Yang, Y . Qiao, X. Fang, L. Chen, Y . Liu, X. Dong, Y . Zang, P. Zhang, J. Wang, et al., “Vlmevalkit: An open-source toolkit for evaluating large multi-modality models,” in Proceedings of the 32nd ACM International Conference on Multimedia , pp. 11198–11201, 2024
work page 2024
-
[6]
Unibench: Visual reasoning requires rethinking vision-language beyond scaling,
H. Al-Tahan, Q. Garrido, R. Balestriero, D. Bouchacourt, C. Hazirbas, and M. Ibrahim, “Unibench: Visual reasoning requires rethinking vision-language beyond scaling,”arXiv preprint arXiv:2408.04810, 2024
arXiv 2024
-
[7]
Mme-survey: A comprehensive survey on evaluation of multimodal llms,
C. Fu, Y .-F. Zhang, S. Yin, B. Li, X. Fang, S. Zhao, H. Duan, X. Sun, Z. Liu, L. Wang,et al., “Mme-survey: A comprehensive survey on evaluation of multimodal llms,” arXiv preprint arXiv:2411.15296, 2024
arXiv 2024
-
[8]
Benchmark evaluations, applications, and challenges of large vision language models: A survey,
Z. Li, X. Wu, H. Du, H. Nghiem, and G. Shi, “Benchmark evaluations, applications, and challenges of large vision language models: A survey,”arXiv preprint arXiv:2501.02189, vol. 1, 2025
arXiv 2025
Show all 74 references
-
[9]
Chatbot arena: An open platform for evaluating llms by human preference,
W.-L. Chiang, L. Zheng, Y . Sheng, A. N. Angelopoulos, T. Li, D. Li, H. Zhang, B. Zhu, M. Jordan, J. E. Gonzalez, and I. Stoica, “Chatbot arena: An open platform for evaluating llms by human preference,” 2024
2024
-
[10]
Are we on the right way for evaluating large vision-language models?,
L. Chen, J. Li, X. Dong, P. Zhang, Y . Zang, Z. Chen, H. Duan, J. Wang, Y . Qiao, D. Lin,et al., “Are we on the right way for evaluating large vision-language models?,” arXiv:2403.20330, 2024
2024 arXiv
-
[11]
Laion-5b: An open large-scale dataset for training next generation image-text models,
C. Schuhmann, R. Beaumont, R. Vencu, et al., “Laion-5b: An open large-scale dataset for training next generation image-text models,” in NeurIPS Datasets and Benchmarks Track, 2022
2022
-
[12]
Reproducible scaling laws for contrastive language- image learning,
M. Cherti, C. Schuhmann, J. Bax, et al., “Reproducible scaling laws for contrastive language- image learning,” in CVPR, 2023
2023
-
[13]
Mapping global dynamics of benchmark creation and saturation in artificial intelligence,
S. Ott, L. Kirsch, C. Kirsch, and Y . Bengio, “Mapping global dynamics of benchmark creation and saturation in artificial intelligence,” Nature Communications, vol. 13, no. 1, p. 6724, 2022
2022
-
[14]
Sugarcrepe: Fixing hackable benchmarks for vision- language compositionality,
C.-Y . Hsieh, H. Kervadec, and Z. Akata, “Sugarcrepe: Fixing hackable benchmarks for vision- language compositionality,” inNeurIPS Datasets and Benchmarks Track, 2023
2023
-
[15]
Blender - a 3d modelling and rendering package,
B. O. Community, “Blender - a 3d modelling and rendering package,” 2018
2018
-
[16]
Is a picture worth a thousand words? delving into spatial reasoning for vision language models,
J. Wang, Y . Ming, Z. Shi, V . Vineet, X. Wang, S. Li, and N. Joshi, “Is a picture worth a thousand words? delving into spatial reasoning for vision language models,” Advances in Neural Information Processing Systems, vol. 37, pp. 75392–75421, 2024
2024
-
[17]
Good at captioning, bad at counting: Benchmarking gpt-4v on earth observation data,
C. Zhang and S. Wang, “Good at captioning, bad at counting: Benchmarking gpt-4v on earth observation data,” arXiv preprint arXiv:2401.17600, 2024. 11
2024 arXiv
-
[18]
Gpt-4.1, technical report,
A. Kumar, J. Yu, J. Hallman, M. Pokrass, A. Goucher, A. Ganesh, B. Cheng, B. McKinzie, B. Zhang, C. Koch, C. Wei, D. Medina, E. Wong, E. Kavanaugh, F. Bekerman, H. Hu, H. Ren, I. Singal, J. Kiros, J. Ai, J. Lin, J. Chien, J. McGrath, J. Lee, J. Wang, K. Lu, K. Georgiev, K. Lut...
2025
-
[19]
The llama 4 herd
Meta, “The llama 4 herd.” https://ai.meta.com/blog/ llama-4-multimodal-intelligence/ , 2025. Accessed May 2025
2025
-
[20]
Visual instruction tuning,
H. Liu, C. Li, Q. Wu, and Y . J. Lee, “Visual instruction tuning,”Advances in neural information processing systems, vol. 36, pp. 34892–34916, 2023
2023
-
[21]
Mmmu: A massive multi-discipline multimodal understanding and reasoning benchmark for expert agi,
X. Yue, Y . Ni, K. Zhang, T. Zheng, R. Liu, G. Zhang, S. Stevens, D. Jiang, W. Ren, Y . Sun, et al., “Mmmu: A massive multi-discipline multimodal understanding and reasoning benchmark for expert agi,” in CVPR, 2024
2024
-
[22]
Mmbench: Is your multi-modal model an all-around player?,
Y . Liu, H. Duan, Y . Zhang, B. Li, S. Zhang, W. Zhao, Y . Yuan, J. Wang, C. He, Z. Liu,et al., “Mmbench: Is your multi-modal model an all-around player?,” arXiv:2307.06281, 2023
2023 arXiv
-
[23]
Towards vqa models that can read,
A. Singh, V . Natarjan, M. Shah, Y . Jiang, X. Chen, D. Batra, D. Parikh, and M. Rohrbach, “Towards vqa models that can read,” inCVPR, 2019
2019
-
[24]
Seed-bench: Benchmarking multimodal llms with generative comprehension,
B. Li, R. Wang, G. Wang, Y . Ge, Y . Ge, and Y . Shan, “Seed-bench: Benchmarking multimodal llms with generative comprehension,” arXiv:2307.16125, 2023
2023 arXiv
-
[25]
Making the v in vqa matter: Elevating the role of image understanding in visual question answering,
Y . Goyal, T. Khot, D. Summers-Stay, D. Batra, and D. Parikh, “Making the v in vqa matter: Elevating the role of image understanding in visual question answering,” in CVPR, 2017
2017
-
[26]
Deepseek-r1: Incentivizing reasoning capability in llms via reinforcement learning,
D. Guo, D. Yang, H. Zhang, J. Song, R. Zhang, R. Xu, Q. Zhu, S. Ma, P. Wang, X. Bi,et al., “Deepseek-r1: Incentivizing reasoning capability in llms via reinforcement learning,” arXiv preprint arXiv:2501.12948, 2025
2025 arXiv
-
[28]
Qwen2. 5 technical report,
A. Yang, B. Yang, B. Zhang, B. Hui, B. Zheng, B. Yu, C. Li, D. Liu, F. Huang, H. Wei,et al., “Qwen2. 5 technical report,” arXiv preprint arXiv:2412.15115, 2024
2024 arXiv
-
[29]
Gpt-4 technical report,
J. Achiam, S. Adler, S. Agarwal, L. Ahmad, I. Akkaya, F. L. Aleman, D. Almeida, J. Altenschmidt, S. Altman, S. Anadkat, et al. , “Gpt-4 technical report,” arXiv preprint arXiv:2303.08774, 2023
2023 arXiv
-
[30]
Video simpleqa: Towards factuality evaluation in large video language models,
M. Cao, P. Hu, Y . Wang, J. Gu, H. Tang, H. Zhao, J. Dong, W. Yu, G. Zhang, I. Reid,et al., “Video simpleqa: Towards factuality evaluation in large video language models,”arXiv preprint arXiv:2503.18923, 2025
2025 arXiv
-
[31]
Inst-it: Boosting multimodal instance understanding via explicit visual prompt instruction tuning,
W. Peng, L. Meng, Y . Chen, Y . Xie, Y . Liu, T. Gui, H. Xu, X. Qiu, Z. Wu, and Y .-G. Jiang, “Inst-it: Boosting multimodal instance understanding via explicit visual prompt instruction tuning,” arXiv preprint arXiv:2412.03565, 2024
2024
-
[32]
Lvlm-count: Enhancing the counting ability of large vision-language models,
M. F. Qharabagh, M. Ghofrani, and K. Fountoulakis, “Lvlm-count: Enhancing the counting ability of large vision-language models,” arXiv preprint arXiv:2412.00686, 2024. 12
2024
-
[33]
Countgd: Multi-modal open-world counting,
N. Amini-Naieni, T. Han, and A. Zisserman, “Countgd: Multi-modal open-world counting,” Advances in Neural Information Processing Systems, vol. 37, pp. 48810–48837, 2024
2024
-
[34]
Mutually-aware feature learning for few-shot object counting,
Y . Jeon, S. Lee, J. Kim, and J.-P. Heo, “Mutually-aware feature learning for few-shot object counting,” Pattern Recognition, vol. 161, p. 111276, 2025
2025
-
[35]
Point segment and count: A generalized framework for object counting,
Z. Huang, M. Dai, Y . Zhang, J. Zhang, and H. Shan, “Point segment and count: A generalized framework for object counting,” in Proceedings of the IEEE/CVF Conference on Computer Vision and Pattern Recognition, pp. 17067–17076, 2024
2024
-
[36]
Mind the gap: Benchmarking spatial reasoning in vision-language models,
I. Stogiannidis, S. McDonagh, and S. A. Tsaftaris, “Mind the gap: Benchmarking spatial reasoning in vision-language models,” arXiv preprint arXiv:2503.19707, 2025
2025 arXiv
-
[37]
Tallyqa: Answering complex counting questions,
M. Acharya, K. Kafle, and C. Kanan, “Tallyqa: Answering complex counting questions,” in Proceedings of the AAAI conference on artificial intelligence, vol. 33, pp. 8076–8084, 2019
2019
-
[38]
Counting everyday objects in everyday scenes,
P. Chattopadhyay, R. Vedantam, R. R. Selvaraju, D. Batra, and D. Parikh, “Counting everyday objects in everyday scenes,” in Proceedings of the IEEE conference on computer vision and pattern recognition, pp. 1135–1144, 2017
2017
-
[39]
Pixel-wise crowd understanding via synthetic data,
Q. Wang, J. Gao, W. Lin, and Y . Yuan, “Pixel-wise crowd understanding via synthetic data,” International Journal of Computer Vision, vol. 129, no. 1, pp. 225–245, 2021
2021
-
[40]
Nwpu-moc: a benchmark for fine-grained multicategory object counting in aerial images,
J. Gao, L. Zhao, and X. Li, “Nwpu-moc: a benchmark for fine-grained multicategory object counting in aerial images,” IEEE Transactions on Geoscience and Remote Sensing , vol. 62, pp. 1–14, 2024
2024
-
[41]
An empirical analysis on spatial reasoning capabilities of large multimodal models,
F. Shiri, X.-Y . Guo, M. G. Far, X. Yu, G. Haffari, and Y .-F. Li, “An empirical analysis on spatial reasoning capabilities of large multimodal models,” arXiv preprint arXiv:2411.06048, 2024
2024 arXiv
-
[42]
Spatialrgpt: Grounded spatial reasoning in vision language models,
A.-C. Cheng, H. Yin, Y . Fu, Q. Guo, R. Yang, J. Kautz, X. Wang, and S. Liu, “Spatialrgpt: Grounded spatial reasoning in vision language models,”arXiv preprint arXiv:2406.01584, 2024
2024 arXiv
-
[43]
Autobench-v: Can large vision-language models benchmark themselves?,
H. Bao, Y . Huang, Y . Wang, J. Ye, X. Wang, X. Chen, Y . Zhao, T. Zhou, M. Elhoseiny, and X. Zhang, “Autobench-v: Can large vision-language models benchmark themselves?,”arXiv preprint arXiv:2410.21259, 2024
2024 arXiv
-
[44]
Text-to-image cross-modal generation: A systematic review,
M. ˙Zelaszczyk and J. Ma´ndziuk, “Text-to-image cross-modal generation: A systematic review,” arXiv preprint arXiv:2401.11631, 2024
2024 arXiv
-
[45]
A survey on hallucination in large vision-language models,
H. Liu, W. Xue, Y . Chen, D. Chen, X. Zhao, K. Wang, L. Hou, R. Li, and W. Peng, “A survey on hallucination in large vision-language models,” arXiv preprint arXiv:2402.00253, 2024
2024 arXiv
-
[46]
Task me anything,
J. Zhang, W. Huang, Z. Ma, O. Michel, D. He, T. Gupta, W.-C. Ma, A. Farhadi, A. Kembhavi, and R. Krishna, “Task me anything,”arXiv preprint arXiv:2406.11775, 2024
2024 arXiv
-
[47]
Provision: Programmatically scaling vision-centric instruction data for multimodal language models,
J. Zhang, L. Xue, L. Song, J. Wang, W. Huang, M. Shu, A. Yan, Z. Ma, J. C. Niebles, S. Savarese, et al., “Provision: Programmatically scaling vision-centric instruction data for multimodal language models,” arXiv preprint arXiv:2412.07012, 2024
2024 arXiv
-
[48]
A new benchmark: On the utility of synthetic data with blender for bare supervised learning and downstream domain adaptation,
H. Tang and K. Jia, “A new benchmark: On the utility of synthetic data with blender for bare supervised learning and downstream domain adaptation,” in Proceedings of the IEEE/CVF conference on computer vision and pattern recognition, pp. 15954–15964, 2023
2023
-
[49]
Perceptionlm: Open-access data and models for detailed visual understanding,
J. H. Cho, A. Madotto, E. Mavroudi, T. Afouras, T. Nagarajan, M. Maaz, Y . Song, T. Ma, S. Hu, S. Jain, et al., “Perceptionlm: Open-access data and models for detailed visual understanding,” arXiv preprint arXiv:2504.13180, 2025
2025 arXiv
-
[50]
A survey of synthetic data augmentation methods in machine vision,
A. Mumuni, F. Mumuni, and N. K. Gerrar, “A survey of synthetic data augmentation methods in machine vision,” Machine Intelligence Research, vol. 21, no. 5, pp. 831–869, 2024
2024
-
[51]
Physbench: Benchmarking and enhancing vision-language models for physical world understanding,
W. Chow, J. Mao, B. Li, D. Seita, V . Guizilini, and Y . Wang, “Physbench: Benchmarking and enhancing vision-language models for physical world understanding,” arXiv preprint arXiv:2501.16411, 2025. 13
2025 arXiv
-
[52]
Balrog: Benchmarking agentic llm and vlm reasoning on games,
D. Paglieri, B. Cupiał, S. Coward, U. Piterbarg, M. Wolczyk, A. Khan, E. Pignatelli, Ł. Kuci´nski, L. Pinto, R. Fergus, et al., “Balrog: Benchmarking agentic llm and vlm reasoning on games,” arXiv preprint arXiv:2411.13543, 2024
2024 arXiv
-
[53]
Mistral small 3.1
M. AI, “Mistral small 3.1.” https://mistral.ai/news/mistral-small-3-1 , 2025. Ac- cessed May 2025
2025
-
[54]
Gemma 3 technical report,
G. Team, A. Kamath, J. Ferret, S. Pathak, N. Vieillard, R. Merhej, S. Perrin, T. Matejovicova, A. Ramé, M. Rivière, et al., “Gemma 3 technical report,” arXiv preprint arXiv:2503.19786, 2025
2025 arXiv
-
[55]
Llama 3.2,
Meta, “Llama 3.2,” 2025. Accessed May 2025
2025
-
[56]
The llama 3 herd of models,
A. Dubey, A. Jauhri, A. Pandey, A. Kadian, A. Al-Dahle, A. Letman, A. Mathur, A. Schelten, A. Yang, A. Fan, et al., “The llama 3 herd of models,” arXiv preprint arXiv:2407.21783, 2024
2024 arXiv
-
[57]
Mapping global dynamics of benchmark creation and saturation in artificial intelligence,
S. Ott, A. Barbosa-Silva, K. Blagec, J. Brauner, and M. Samwald, “Mapping global dynamics of benchmark creation and saturation in artificial intelligence,”Nature Communications, vol. 13, no. 1, p. 6793, 2022
2022
-
[58]
Betterbench: Assessing ai benchmarks, uncovering issues, and establishing best practices,
A. Reuel, A. Hardy, C. Smith, M. Lamparth, M. Hardy, and M. J. Kochenderfer, “Betterbench: Assessing ai benchmarks, uncovering issues, and establishing best practices,” arXiv preprint arXiv:2411.12990, 2024
2024 arXiv
-
[59]
Hypersim: A photorealistic synthetic dataset for holistic indoor scene understanding,
M. Roberts, J. Ramapuram, A. Ranjan, A. Kumar, M. A. Bautista, N. Paczan, R. Webb, and J. M. Susskind, “Hypersim: A photorealistic synthetic dataset for holistic indoor scene understanding,” in Proceedings of the IEEE/CVF international conference on computer vision, pp. 10912–...
2021
-
[60]
Blenderproc2: A procedural pipeline for photorealistic rendering,
M. Denninger, D. Winkelbauer, M. Sundermeyer, W. Boerdijk, M. W. Knauer, K. H. Strobl, M. Humt, and R. Triebel, “Blenderproc2: A procedural pipeline for photorealistic rendering,” Journal of Open Source Software, vol. 8, no. 82, p. 4901, 2023
2023
-
[61]
Chain-of- thought prompting elicits reasoning in large language models,
J. Wei, X. Wang, D. Schuurmans, M. Bosma, F. Xia, E. Chi, Q. V . Le, D. Zhou,et al., “Chain-of- thought prompting elicits reasoning in large language models,” Advances in neural information processing systems, vol. 35, pp. 24824–24837, 2022. 14 A Framework overview In this sec...
2022
-
[62]
Defining a Y AML file specifying a range of piece counts for chess images
-
[63]
Running the dataset generator, which builds each scene in Blender, applies the specified configu- rations, and renders the images
-
[64]
Saving, for each image, a legend file containing all parameters, and extracting answers for a suite of questions
-
[65]
Using the resulting image-question-answer triplets for downstream model training or evaluation. In summary, our pipeline provides a fully automated, extensible, and transparent process for generat- ing annotated visual reasoning datasets, with precise experimental control over...
-
[66]
The number of pieces in the image is:
We do not systematically include all results for every task, but instead provide representative diagnostics for both GPT-4.1 and LLaMA-4-Scout. Overall, the following key observations can be made: • Counting: These diagnostics reveal model biases in specific domains. GPT-4.1 t...
-
[67]
Define dataset configuration (Y AML): Select variables, types, values, and randomization
-
[68]
Generate variable combinations: VariableCombinationGenerator produces exhaustive or sampled experimental setups
-
[69]
Build chess configuration: ChessConfigGenerator converts high-level variables into board and pieces configs
-
[70]
Generate images: ChessImageGenerator runs the rendering, using selected style factories and noise configs
-
[71]
base_pile_config
Trace metadata: Outputs both images and accompanying legend files for reproducibility. Example Application Scenarios • Piece Identification Tasks: Varying piece types with controlled counts chess.type_config: variate_type: varying_all variate_levels: [pawn, rook, knight, bisho...
-
[72]
Convert Configurations: Parse internal configuration dictionaries (scene, board/table, pieces/- cards, camera, noise) into a unified intermediate structure
-
[73]
Build Hierarchical Legends: Construct structured dictionaries capturing all relevant parameters and object details
-
[74]
Format Legends: Output both human-readable text files and machine-readable JSON files
-
[75]
Write to Disk: Save legends alongside rendered images for downstream use. 61 Chess Legends • Board: Dimensions, pattern, position, material, and colors • Pieces: Type, position (board/world), color, scale, and other properties • Camera: Distance, angles, world coordinates • No...
Reviewed August 7, 2026 · model on record in the stance chip above.
Discussion (0). Sign in to comment.