REVIEW 3 major objections 4 minor 39 references
Analyzing Patterns and Influence of Advertising in Print Newspapers
T0 review · 3 major / 4 minor · reviewed 2026-08-15 · deepseek-v4-flash
Pith's one-line read Companies that advertise more in a newspaper receive more articles and more positive coverage in that same paper, according to an analysis of 12,358 Indian print editions.
desk verdict The new print-ad dataset and pipeline are the real contribution; the paper's own appendix undercuts its headline claim that ad spending predicts positive sentiment. read the letter →
The pith
A machine-rendered reading of the paper's core claim, the machinery that carries it, and where it could break.
The reading
What carries the argument
The load-bearing object is the weighted ad ratio, $$\text{Weighted Ad Ratio} = \frac{\text{scaling factor} \times \text{ad area}}{\text{page area}},$$ where the scaling factor is the ratio of a page's actual rate-card price to the paper's base per-square-centimeter rate; it converts every ad into a comparable measure of how much prominence the advertiser bought, which is what makes comparisons across pages, papers, and languages meaningful. The argument then runs through a panel regression of total sentiment and article count on this ratio, with newspaper-by-company fixed effects and time fixed effects that absorb stable differences between papers and advertisers as well as shared shocks. The ratio is computable at scale only because of the extraction pipeline — page segmentation with a fine-tuned object-detection model, OCR (text recognition) in three scripts, and machine translation into English — which the authors validate at 96.8% mean average precision, a standard detection-accuracy score, and with 0.94 F1 for the keyword filters that assign ads and articles to advertisers. Sentiment is scored by a classifier that assigns each article a value of $-1$, $0$, or $1$, and the coverage count is the number of articles per period that match the advertiser's keywords.
What would settle it
A company-level event study would settle the claim: find firms whose ad spending in one newspaper fell abruptly for reasons outside that newspaper's control (a budget cut, a boycott, a merger) while their spending in a matched paper stayed flat, and check whether coverage volume and sentiment in the cut paper decline relative to the control. The paper's own anecdote of a conglomerate buying more ads after a scandal, with sentiment gradually recovering, is one instance of the pattern; replicating it systematically across the 155 companies, or exploiting a regulation that forces ad-spend changes, would discriminate the influence channel from coincidence or salience.
Extended reading notes
Core claim
The central claim is that in Indian print newspapers, the more a company advertises in a given paper, the more articles that paper publishes about the company and the more positively those articles are worded. The evidence is a panel regression of monthly coverage on a weighted ad ratio — ad area divided by page area, multiplied by a rate-card scaling factor so that a front-page half-page ad counts for more than an inside-page one — estimated with newspaper-by-company fixed effects and time fixed effects. For corporate advertisers the coefficient on the ad ratio is positive and statistically significant in every specification of the main model: 0.0189 for total sentiment with no fixed effects and 0.0137 with both sets of fixed effects, and between 0.436 and 0.223 for the monthly count of articles. A popularity control built from web-search interest leaves the coverage association significant but weakens the sentiment association to non-significance when company fixed effects are included, a qualification the authors report rather than hide. For government advertisers the same regressions yield negative or null coefficients, which the authors attribute to the legally mandated, non-withdrawable character of most government ads: newspapers have no incentive to return favor for revenue they are guaranteed by law.
Load-bearing premise
The analysis stands on the assumption that mistakes in classifying articles and ads by keyword are randomly distributed across page numbers and page positions; if those mistakes cluster on prominent pages, the measured link between advertising and coverage would be biased rather than real.
Editorial extensions
If this is right
- In the main model, a one-percentage-point increase in a company's weighted ad ratio is associated with a 0.0189-unit gain in total sentiment (on a scale the paper takes as running from $-1$ to $1$) and, depending on the specification, between 0.22 and 0.44 additional articles about the company per time period in the same newspaper.
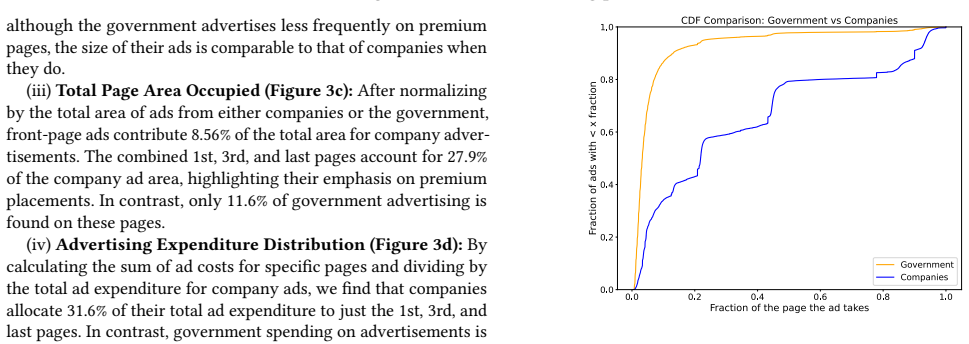
- Corporate advertisers put 27.9% of their ad area and 31.6% of their ad spending on the front, third, and back pages, so any influence they obtain operates on the paper's most visible pages, where readers see ads and coverage together.
- The absence of a positive ad–coverage link for legally mandated government advertising supports the authors' reading that the corporate link runs through the advertiser's power to choose and withdraw spending rather than through a property of the measurement itself.
- For article volume, the ad ratio stays a significant predictor even when a web-search popularity term and fixed effects are added, while popularity's own coefficient flips sign across models; the authors conclude that ad spending is the more reliable driver of media attention, while noting that the sentiment association weakens under the same controls.
- Because the pipeline, code, and dataset are released, the same regressions can be rerun for other countries, languages, and time periods, turning the Indian finding into a testable template for media-influence research elsewhere.
Reading between the lines
- The correlation is consistent with editors returning favor for ad money, but it is also compatible with a salience story in which newspapers write more about firms that dominate the ad market because those firms are economically important; the design cannot fully separate the two, although the government placebo makes a pure measurement artifact unlikely.
- A sharper test the paper's own data enables but does not run: compare articles about a company that appear on the same page as the company's ad with articles about the same company elsewhere in the same issue — if coverage is more positive next to the ad, the bias is partly a page-layout decision rather than a whole-editorial-tone decision.
- The mechanism predicts a steeper ad–coverage gradient at newspapers that depend more heavily on a given advertiser's revenue; since the dataset contains ad areas and rate cards, advertiser revenue share per paper is computable and the gradient can be tested directly.
- Running the same pipeline on digital news outlets, where ad placement is programmatic and advertisers do not negotiate with the newsroom, would be a natural control — a weaker correlation there would point to negotiated influence rather than general commercial pressure.
Signed reviews
Editorial analysis
A structured set of objections, weighed in public.
Referee Report
Summary. The paper introduces an image-processing and OCR pipeline that extracts articles and advertisements from digitized print newspapers, and applies it to five Indian newspapers in three languages over roughly six years, assembling over 12,000 editions and hundreds of thousands of ads. The authors use this dataset to describe the print advertising ecosystem (who advertises, placement, size, timing, and topics) and then run panel regressions relating a weighted ad ratio to the volume and sentiment of news coverage received by government and corporate advertisers. The headline finding is that corporate advertising is positively and robustly associated with both coverage volume and sentiment, while government advertising shows weaker or negative associations.
Significance. If the central claims held, this would be a valuable large-scale contribution to the media-bias and advertiser-influence literature, which has mostly relied on smaller or single-outlet studies. The dataset itself is a substantial asset: the authors make code and data public, cover multiple languages and regions, and document a reproducible extraction pipeline with reported detection and OCR accuracy. The descriptive findings on ad placement, size distributions, and government versus corporate spending are new for the Indian print market and are likely to be useful to other researchers. However, the paper's most consequential claim—that corporate advertising robustly predicts more favorable news tone—is undermined by the paper's own popularity-controlled regressions in Appendix E, Table 4, as detailed below. The coverage-volume result appears more robust and is a meaningful finding in its own right, but it is a weaker claim than advertiser influence on news tone.
major comments (3)
- [Section 5.2 and Appendix E, Table 4] The abstract's claim that the ad-sentiment relationship is 'robust over time and across different levels of advertiser popularity' is contradicted by the paper's own Appendix Table 4. In all four specifications that add a Google Trends popularity control, the Total Ad Page Percent coefficient on total sentiment is non-significant (-0.0003, 0.0018, -0.0016, -0.0011), and three of the four coefficients are negative. Section 5.2 even concedes that 'neither ad spending nor popularity shows consistent significance on sentiment across all specifications when company and time effects are included.' This is an internal inconsistency in the central claim. Furthermore, Tables 2 and 4 use different samples and aggregation levels (155 entities / 72 periods versus 40 entities / 1372 periods), and the manuscript does not explain which sample is preferred or how the samples differ. The authors should reconcile these tables, report the popularity-controlled specification as the main specification if it is the more appropriate one, and revise the abstract and Section 5.2 so that the strength of the sentiment claim matches the evidence.
- [Section 4, Keyword Identification and Section 5.1 regression setup] The analysis assumes that keyword-based misclassification of articles and ads is randomly distributed across page numbers and page areas. This assumption is load-bearing because the weighted ad ratio is constructed from page-specific scaling factors, and the coverage measures are extracted from the same pages. If misclassification is correlated with page prominence—for example, if front-page articles are more likely to mention large brands, or if front-page advertisements are larger and thus more likely to be correctly detected—then the estimated coefficients linking ad ratio to coverage would be biased. The authors should provide a sensitivity analysis or validation that directly tests whether misclassification rates vary by page number and page area, rather than asserting randomness.
- [Section 5.2, interpretation of effect size] The statement that a 1% increase in weighted ad ratio leads to an average increase of 0.0189 units in total sentiment score, and that this is 'substantial' given the -1 to 1 sentiment scale, requires clarification of the dependent variable. If total sentiment is a sum of per-article scores (-1, 0, 1) over a period, then the coefficient is not directly comparable to the per-article scale, and calling it substantial may be misleading. If it is an average, the claim needs a different justification. The manuscript should state clearly how 'total sentiment' is aggregated and provide an effect-size discussion that is consistent with that definition.
minor comments (4)
- [Appendix A, Table 3] The text says performance degraded with the larger dataset, yet Table 3 shows that the larger dataset has higher recall (97.8% versus 88.8%) even though mAP and precision are slightly lower. Please clarify whether the degradation refers to mAP alone or to a weighted criterion, and why the first model is preferred.
- [Appendix D, Figure 24] The single-entity example (Adani) is presented as demonstrating 'the influence of advertising on sentiment,' but a case study of one conglomerate around one scandal cannot establish a general causal relationship. Please either soften the language or add more examples with quantitative support.
- [Section 3.2, OCR error rates] The claim that Tesseract achieves 'an error rate of less than 5%' and that Surya's performance is 'close to 1% error rate' is reported without a citation or evaluation on this dataset. Please provide the evaluation details or reduce the strength of these claims.
- [Throughout] There are several minor typographical and formatting issues: 'Corporates' is used inconsistently as a noun, 'cr' appears incomplete in the Introduction ('such as “bribe,” “scam,” “corrupt,” and other relevant terms'), and some references (e.g., [8], [37]) lack access dates or are cited imprecisely. A careful proofread is needed.
Circularity Check
No circular derivation: ad ratio and coverage are measured from distinct page segments with external rate cards; the Appendix E sentiment inconsistency is a robustness problem, not circularity.
full rationale
The paper's derivation chain is not circular. The independent variable is the Weighted Ad Ratio, defined as Scaling Factor * Ad Area / Page Area, where the scaling factors come from published newspaper rate cards (Appendix F, Table 6), not from coverage or sentiment. The dependent variables are coverage volume (count of articles mentioning an entity) and total sentiment (sum of TweetNLP sentiment scores of those articles), both computed from article segments. Ad and article segments are separated by a YOLOv8 segmentation model; ad text and article text are OCR'd separately. No fitted parameter is renamed as a prediction, and no self-citation is load-bearing: all cited methods (Beattie et al., Reuter & Zitzewitz, TweetNLP, etc.) are external prior work. The only circularity-adjacent concern is stated explicitly in Section 4: 'Our methodology assumes that any potential misclassifications at the keyword identification stage are randomly distributed across page numbers and page areas.' This is a measurement-error assumption about keyword overlap between ad and article classification, not an equivalence by construction, so it does not make the regression coefficient a tautology. Separately, the paper's own Appendix E, Table 4 shows that adding Google Trends popularity and company/time fixed effects makes the sentiment coefficient non-significant and often negative, and Section 5.2 admits 'neither ad spending nor popularity shows consistent significance on sentiment across all specifications when company and time effects are included.' That is an internal inconsistency that weakens the abstract's 'robust' claim, but it is a statistical robustness failure, not a circular derivation. Thus there is no circularity to score above 0.
Assumptions & free parameters
assumptions (4)
- domain assumption Keyword misclassification is randomly distributed across page numbers and page areas.
- domain assumption Panel fixed effects absorb unobserved confounders.
- domain assumption OCR and translation errors do not affect keyword-based entity matching.
- domain assumption Google Trends search interest is a valid control for company popularity.
Cite this review
Pith. "Pith review of Analyzing Patterns and Influence of Advertising in Print Newspapers." pith.science (2026). https://pith.science/paper/Z5FAOUNY
@misc{pith2026250510791,
  author       = {Pith},
  title        = {Pith review of: Analyzing Patterns and Influence of Advertising in Print Newspapers},
  year         = {2026},
  howpublished = {\url{https://pith.science/paper/Z5FAOUNY}},
  note         = {Machine review of arXiv:2505.10791}
}
read the original abstract
This paper investigates advertising practices in print newspapers across India using a novel data-driven approach. We develop a pipeline employing image processing and OCR techniques to extract articles and advertisements from digital versions of print newspapers with high accuracy. Applying this methodology to five popular newspapers that span multiple regions and three languages, English, Hindi, and Telugu, we assembled a dataset of more than 12,000 editions containing several hundred thousand advertisements. Collectively, these newspapers reach a readership of over 100 million people. Using this extensive dataset, we conduct a comprehensive analysis to answer key questions about print advertising: who advertises, what they advertise, when they advertise, where they place their ads, and how they advertise. Our findings reveal significant patterns, including the consistent level of print advertising over the past six years despite declining print circulation, the overrepresentation of company ads on prominent pages, and the disproportionate revenue contributed by government ads. Furthermore, we examine whether advertising in a newspaper influences the coverage an advertiser receives. Through regression analyses on coverage volume and sentiment, we find strong evidence supporting this hypothesis for corporate advertisers. The results indicate a clear trend where increased advertising correlates with more favorable and extensive media coverage, a relationship that remains robust over time and across different levels of advertiser popularity.
Figures


Figures from the paper (15 more)


Reference graph
Works this paper leans on
-
[1]
Ben Bagdikian. 2004. H., 2004, The New Media Monopoly
work page 2004
- [2]
-
[3]
Jose Camacho-Collados, Kiamehr Rezaee, Talayeh Riahi, Asahi Ushio, Daniel Loureiro, Dimosthenis Antypas, Joanne Boisson, Luis Espinosa-Anke, Fangyu Liu, Eugenio Martínez-Cámara, Gonzalo Medina, Thomas Buhrmann, Leonardo Neves, and Francesco Barbieri. 2022. TweetNLP: Cutting-Edge Natural Language Processing for Social Media. arXiv:2206.14774 [cs.CL] https:...
arXiv 2022
-
[4]
Media Research Users Council. 2020. Indian Readership Survey 2019 Q4. https: //mruc.net/uploads/posts/cd072cdc13d2fe48ac660374d0c22a5d.pdf
work page 2020
-
[5]
David Croteau and William Hoynes. 2006. The business of media: Corporate media and the public interest . Pine forge press
work page 2006
-
[6]
Buroshiva Dasgupta. 2017. Tackling ‘bias’ and fake coverage in the Indian media. (2017)
work page 2017
-
[7]
Rafael Di Tella and Ignacio Franceschelli. 2011. Government Advertising and Media Coverage of Corruption Scandals. American Economic Journal: Applied Economics 3, 4 (October 2011), 119–51. https://doi.org/10.1257/app.3.4.119
-
[8]
Javed Farooqui. 2024. Strong outlook: Indian print media industry is poised to record robust growth in 2024. https://economictimes.indiatimes.com/industry/ media/entertainment/media/strong-outlook-indian-print-media-industry-is- poised-to-record-robust-growth-in-2024/articleshow/107801911.cms. [Accessed 13-10-2024]
Show all 39 references
-
[9]
Jay Gala, Pranjal A Chitale, A K Raghavan, Varun Gumma, Sumanth Doddapa- neni, Aswanth Kumar M, Janki Atul Nawale, Anupama Sujatha, Ratish Pudup- pully, Vivek Raghavan, Pratyush Kumar, Mitesh M Khapra, Raj Dabre, and Anoop Kunchukuttan. 2023. IndicTrans2: Towards High-Quality ...
2023
-
[10]
Matthew Gentzkow and Jesse M. Shapiro. 2010. What Drives Media Slant? Evidence From U.S. Daily Newspapers. Econo- metrica 78, 1 (2010), 35–71. https://doi.org/10.3982/ECTA7195 Conference acronym ’XX, June 03–05, 2018, Woodstock, NY Vardhan et al. arXiv:https://onlinelibrary.wi...
2010 doi
-
[11]
Matthew Gentzkow, Jesse M Shapiro, and Michael Sinkinson. 2014. Competition and ideological diversity: Historical evidence from us newspapers. American Economic Review 104, 10 (2014), 3073–3114
2014
-
[12]
Martin Gilens and Craig Hertzman. 2000. Corporate ownership and news bias: Newspaper coverage of the 1996 Telecommunications Act. Journal of Politics 62, 2 (2000), 369–386
2000
-
[13]
James T Hamilton. 2004. All the news that’s fit to sell: How the market transforms information into news. Princeton University Press
2004
-
[14]
Glenn Jocher, Ayush Chaurasia, and Jing Qiu. 2023. Ultralytics YOLOv8. https: //github.com/ultralytics/ultralytics
2023
-
[15]
Johnson and B
A. Johnson and B. Smith. 2023. The State of News Media Finances. Columbia Journalism Review (June 2023)
2023
-
[16]
Nadine Lindstädt and Oliver Budzinski. 2011. Newspaper vs. Online Advertising– Is There a Niche for Newspapers in Modern Advertising Markets? Online Advertising–Is There a Niche for Newspapers in Modern Advertising Markets(2011)
2011
-
[17]
Aisha Majid. 2024. Top 25 US newspaper circulations: Print circulations of largest titles fall 14% in year to September 2023. https://pressgazette.co.uk/media- audience-and-business-data/media_metrics/us-newspaper-circulation-2023/. Accessed: 13-10-2024
2024
-
[18]
Robert D McChesney. 2004. The problem of the media: US communication politics in the twenty-first century . NYU Press
2004
-
[19]
MediaScience. 2024. The Benchmark Series: The Powerful Impact of Ad Placement . MediaScience. https://www.mediascience.com/case-studies/results-the-largest- cross-media-advertising-effectiveness-study-in-australia/
2024
-
[20]
NewsMediaWorks. 2022. The Power of Print: Advertising Effectiveness in Newspa- pers. Research Report. NewsMediaWorks
2022
-
[21]
Taberez Ahmed Neyazi. 2011. India on television: how satellite news channels have changed the way we think and act
2011
-
[22]
PaddlePaddle Contributors. 2024. PaddleOCR: Awesome multilingual OCR toolk- its based on PaddlePaddle (practical ultra lightweight OCR system, support 80+ languages recognition, provide data annotation and synthesis tools, support training and deployment among server, mobile, ...
2024
-
[23]
Wolfram Peiser. 2000. Cohort replacement and the downward trend in newspaper readership. Newspaper Research Journal 21, 2 (2000), 11–22
2000
-
[24]
Pew Research Center. 2023. Local News Preferences in the Digital Age
2023
-
[25]
Pew Research Center. 2023. Newspaper Readership Demographics
2023
-
[26]
Robert G Picard. 2011. The economics and financing of media companies . Fordham Univ Press
2011
-
[27]
Andrea Prat and David Strömberg. 2013. The political economy of mass media. Advances in economics and econometrics 2 (2013), 135
2013
-
[28]
Riccardo Puglisi and James M Snyder Jr. 2015. Empirical studies of media bias. In Handbook of media economics . Vol. 1. Elsevier, 647–667
2015
-
[29]
Jonathan Reuter and Eric Zitzewitz. 2006. Do Ads Influence Editors? Advertising and Bias in the Financial Media. The Quarterly Journal of Economics 121, 1 (2006), 197–227. https://EconPapers.repec.org/RePEc:oup:qjecon:v:121:y:2006:i:1:p:197- 227
2006
-
[30]
Reuters Institute. 2023. Digital News Report 2023
2023
-
[31]
Reynolds Journalism Institute. 2024. The importance of ads on article pages: Balancing revenue and reader experience . Reynolds Journalism In- stitute. https://rjionline.org/news/the-importance-of-ads-on-article-pages- balancing-revenue-and-reader-experience/
2024
-
[32]
Boczkowski
Ignacio Siles and Pablo J. Boczkowski. 2012. Making sense of the newspaper crisis: A critical assessment of existing research and an agenda for future work.New Me- dia & Society 14, 8 (2012), 1375–1394. https://doi.org/10.1177/1461444812455148 arXiv:https://doi.org/10.1177/146...
2012 doi
-
[33]
Dries Smet and Stijn Vanormelingen. 2012. The Advertiser is Mentioned Twice. Media Bias in Belgian Newspapers. (01 2012)
2012
-
[34]
Ray Smith. 2007. An overview of the Tesseract OCR engine. InNinth international conference on document analysis and recognition (ICDAR 2007) , Vol. 2. IEEE, 629– 633
2007
-
[35]
Ray Smith. 2007. An Overview of the Tesseract OCR Engine. In ICDAR ’07: Proceedings of the Ninth International Conference on Document Analysis and Recognition. IEEE Computer Society, Washington, DC, USA, 629–633. https: //storage.googleapis.com/pub-tools-public-publication-dat...
2007
-
[36]
Shrihari Sridhar and Srinivasaraghavan Sriram. 2015. Is online newspaper adver- tising cannibalizing print advertising? Quantitative Marketing and Economics 13 (2015), 283–318
2015
-
[37]
The New York Times Company. 2023. 2023 Annual Report
2023
-
[38]
Vik Paruchuri. 2024. GitHub - VikParuchuri/surya: OCR, layout analysis, reading order, table recognition in 90+ languages. https://github.com/VikParuchuri/surya. [Accessed 14-10-2024]
2024
-
[39]
government,
Vik Paruchuri. 2024. GitHub - VikParuchuri/surya: OCR, layout analysis, reading order, table recognition in 90+ languages. https://github.com/VikParuchuri/ surya?tab=readme-ov-file#limitations. [Accessed 14-10-2024]. Analyzing Patterns and Influence of Advertising in Print New...
2024
Reviewed August 15, 2026 · model on record in the stance chip above.
Discussion (0). Continue with ORCID to comment.