Pith. sign in

REVIEW 4 major objections 4 minor 16 cited by

Unquenched Charmonium and Beyond

T0 review · 4 major / 4 minor · reviewed 2026-08-02 · deepseek-v4-flash

Pith's one-line read Hadronic loops, not exotic particles, may explain the XYZ charmonium puzzles.

desk verdict A comprehensive but self-referential review of the Lanzhou unquenched-charmonium program; the thesis that coupled-channel effects matter is plausible, but the quantitative evidence is softer than the abstract claims. read the letter →

arxiv 2602.19887 v3 pith:7TI5CCFV submitted 2026-02-23 hep-ph hep-exhep-latnucl-th

classification hep-phhep-exhep-latnucl-th
keywords charmoniumspectroscopyunquenchedQCDhadronicloopmechanismcoupled-channeleffectsXYZstatesexotichadronsY(4220)initialsinglepionemission
verification ladder T0 review T1 audit T2 compute T3 formal

The pith

A machine-rendered reading of the paper's core claim, the machinery that carries it, and where it could break.

The reading

This review argues that the apparent failures of quenched quark models—which treat charmonium as a pure charm-anticharm pair—are systematic, and that adding coupled-channel effects (hadronic loops of charmed mesons) resolves a long list of puzzles: the rho-pi decay-rule violation, the unusually large non-D-Dbar width of psi(3770), the low mass of X(3872), the peculiar pair X(3915)/Z(3930), the Y(4260) problem, and the charged states Z_c(3900) and Z_b(10610). The central idea is that physical charmonia are mixtures of a bare c-cbar core and virtual charmed-meson pairs; the resulting mass shifts and interference patterns reproduce data that quenched models miss, including line shapes and branching ratios. The payoff is that many states usually labelled exotic become ordinary consequences of these unquenched dynamics, and the same machinery extends to bottomonium and light-flavor vector mesons. The quantitative price is an empirical form-factor cutoff, Lambda = m_E + alpha Lambda_QCD, with alpha tuned case by case.

What carries the argument

The load-bearing object is the hadronic loop: a charmonium state dissociates into a virtual D(*) Dbar(*) pair, which rescatters through exchange of a third charmed meson into the observed light final state. Its amplitude is regulated by a monopole or dipole form factor with cutoff Lambda = m_E + alpha Lambda_QCD, alpha being a free parameter fixed per channel. Around this core, the review assembles three auxiliary mechanisms: coupled-channel mass equations (quantum-mechanical mass-shift and field-theoretic once-subtracted dispersion relations) that shift bare quark-model masses; coherent interference between a direct e+e- annihilation amplitude and known charmonium-resonance amplitudes to bu

What would settle it

A global fit of a single alpha (plus a minimal set of couplings) to all the reviewed channels—rho-pi, psi(3770) non-DDbar, X(3915) to J/psi omega, chi_c1 to omega phi, Y(4220) width, and the Z_c production line shapes—with no per-channel tuning. If the resulting predictions miss the measured branching ratios or line shapes by an order of magnitude (the chi_c1 to omega phi discrepancy cited in the review already hints at this), the unquenched-loop framework as formulated is ruled out. An independent lattice-QCD computation of the charmonium self-energy and its mass shifts would provide the same

Watch

Extended reading notes

Core claim

The paper's central claim is that the unquenched picture—in which charmonium states couple to charmed-meson-pair channels through hadronic loops—is the essential ingredient for a unified description of the charmonium-like XYZ states and their decay anomalies. The review walks through the evidence: hadronic loops supply the long-distance amplitude that destructively interferes with the short-distance three-gluon amplitude in J/psi and psi(3686) decays, solving the rho-pi puzzle; the same loops generate the unexpectedly large non-D-Dbar branching fraction of psi(3770); coupled-channel mass shifts pull X(3872) down to the D-Dbar* threshold and explain the near-degeneracy and narrow width of X(3

Load-bearing premise

All quantitative results rely on the empirical form-factor regularization with cutoff Lambda = m_E + alpha Lambda_QCD and on alpha being tuned separately for each channel; if this regularization is not a faithful stand-in for the true coupled-channel dynamics, the claimed solutions reduce to re-describing the fitted inputs.

Editorial extensions

If this is right

  • Most XYZ states can be assigned to conventional charmonium or to loop/interference artifacts without needing compact tetraquarks or hybrids.
  • The rho-pi puzzle and other 12%-rule violations follow from destructive interference between the short-distance three-gluon amplitude and long-distance charmed-meson loops.
  • X(3915) and Z(3930) are both conventional 2P charmonia: the small mass gap comes from opposite-signed coupled-channel shifts, and the narrow width of X(3915) from node suppression in the radial wave function.
  • Y(4260) is not a single resonance; its line shape is interference of psi(4160), psi(4415), and a direct amplitude, while Y(4220) is a genuine narrow state with a predicted partner near 4.38 GeV.
  • Z_c(3900) and Z_b(10610) can be produced by initial single pion emission, and additional charged Z_cs states are predicted.

Reading between the lines

Editorial extensions of the paper, not claims the author makes directly.

  • Editorial extension: if the hadronic-loop mechanism is the real underlying description, the tuned cutoff parameter alpha should become a single universal constant when all channels are fitted simultaneously; the spread of values quoted in the review is the most direct lever for testing the framework.
  • Editorial extension: the same unquenched dynamics suggest that many other near-threshold enhancements in heavy-quark spectroscopy, beyond the XYZ set, may be loop artifacts; a systematic unquenched re-analysis of the known spectrum is a natural next step.
  • Editorial extension: a sharp test would be the psi(3770) to gamma eta_c and chi_c2(2P) to D Dbar branching ratios, where the loop amplitude is not drowned by the short-distance term.
  • Editorial extension: energy-dependent phase analysis of high-statistics e+e- scans could distinguish genuine poles from interference bumps; under the review's own scheme, Y(4320) and Y(4390) would dissolve as independent states.
Share X Bluesky LinkedIn Reddit HN

Editorial analysis

A structured set of objections, weighed in public.

Desk editor's note, referee report, and a circularity audit.

Referee Report

4 major / 4 minor

Summary. This review argues that the observed spectrum of charmonium-like XYZ states and the long-standing anomalies in charmonium decays require a departure from quenched potential models. Its central mechanism is the hadronic loop/coupled-channel effect, regulated by a monopole/dipole form factor, which is used to explain the rho-pi puzzle, the large non-DDbar width of psi(3770), helicity-selection-rule violations, the X(3872)/X(3915)/Z(3930) 2P spectroscopy, and the Y problem, and to predict charged Z_b/Z_c states through the initial single pion emission mechanism. The review extends the same picture to bottomonium and light vector mesons, and thus presents itself as a unified framework. It is a synthesis of a large body of work, much of it from the authors' own group.

Significance. If the quantitative hadronic-loop calculations are reliable, this is a significant synthesis with falsifiable predictions (e.g., psi(4380), Z_cs structures, chi_c2 -> K* Kbar, psi(3770) -> gamma eta_c) and with an honest disclosure of failures such as chi_c1 -> omega phi and the missing psi(3D) partner. The strengths are the breadth of the compilation, the explicit list of puzzles, and the clearly presented calculational scheme. However, the central claim that the unquenched picture gives 'compelling solutions' is not yet supported at the quantitative level: the form-factor cutoff parameter alpha is adjusted separately in most applications, and at least one flagship prediction misses data by two orders of magnitude. Without a global-alpha consistency test, the review's headline conclusion overstates the evidence.

major comments (4)
  1. [§2.2, Eq. (4); §2.2.1; §2.2.3.1; §3.3.3] The quantitative engine of the review is the hadronic-loop amplitude regulated by the form factor with cutoff Lambda = m_E + alpha Lambda_QCD. The parameter alpha is not universal: it is 0.13 in the rho-pi fit (§2.2.1), 1.14-1.28 for chi_c1 -> K*Kbar, 0.98±0.27 for M1 transitions (§2.2.3.2), and 1-4 for X(3915)->J/psi omega (§3.3.3). Predicted widths vary by more than an order of magnitude over the allowed ranges (e.g., 3.5×10^-3 to 0.15 MeV for X(3915)->J/psi omega). Since many observables are computed after alpha is adjusted in the same or a closely related channel, the abstract's claim of a unified, essential description is not established. The authors should perform and report a global-alpha cross-check: fix one alpha (or a physically motivated alpha extracted from one well-measured channel) and compare with all the rates in Tables 2-4 and the X(3915)/Y-sector results, or explicitly
  2. [§2.2.3.1, Table 3] Table 3 shows a two-order-of-magnitude failure: chi_c1 -> omega phi is predicted at (2.5-6.9)×10^-7 in Ref. [63] while the measured value is (2.2±0.6±0.2)×10^-5. The text acknowledges the discrepancy but still counts the hadronic-loop mechanism as providing a consistent description of the chi_c1 -> VV anomalies. This is load-bearing because chi_c1 -> omega phi is a double-OZI/helicity-suppressed channel central to the application. The authors should either supply an explicit mechanism (e.g., revised omega-phi mixing or an extra amplitude) that brings the prediction within a factor of a few, or list this channel as an unresolved failure and temper the corresponding conclusion.
  3. [§4.4.2-§4.4.3] The Y-problem solution is built on Y(4220) as a 'scaling point'. The mass spectrum is fitted with Y(4220) assigned as psi(4S), and the 4S-3D mixing angle theta is constrained by the Y(4220) mass to predict the psi(4380) partner. The paper itself states that 'there is no experimental evidence supporting the existence of its partner psi(3D) state' (§4.4.2). The later claim that a coupled-channel mechanism 'explains the origin of such a large mixing angle' is deferred to §4.5.1, but no quantitative derivation appears in the review. Thus the psi(4380) prediction is to a large extent a fit-informed assignment rather than an independent falsifiable outcome. The authors should present the coupled-channel computation of theta with uncertainties and state explicitly which e+e- datasets constrain psi(4380), including channels where it is not observed.
  4. [§4.4.1] The numerical evidence for Y(4220) as a genuine resonance rests on the 2R vs 3R fit comparison. The printed chi^2/n.d.f. values are internally inconsistent: for e+e- -> D0 D*- pi+ the 3R fit is quoted as 226/78 while the 2R fit is 69/74, i.e., the fit worsens when Y(4220) is added, contradicting the sentence that the fit quality 'dramatically improves'. If this is a typographical error, it must be corrected and the correct values checked; if not, the D0 D*- pi+ channel actually argues against the need for Y(4220) and the conclusion must be re-examined.
minor comments (4)
  1. [§2.1.1, Eq. (2) and Table 1] The branching ratios for K+ K*(892)- + c.c. are given with contradictory powers of ten in Eq. (2) and Table 1 (10^-5 vs 10^-3 for psi(3686), and 10^-3 vs 10^-1 for J/psi). Please reconcile with the PDG values.
  2. [§2.2, §3.3.2, §3.3.4] There are several typographical errors that should be corrected, including 'mechanim' in the §2.2 heading, 'bewteen' in §3.3.2, and 'disappeare' in §3.3.4.
  3. [Footnote 2 and §3.3.2] The main text uses the large width of X(3860) as a decisive argument against identifying it as chi_c0(2P), while the footnote notes that X(3860) is omitted from the PDG summary table and that the J^PC preference is only 2.5 sigma. Please frame this as a tentative argument rather than as established input.
  4. [Abstract and §1] The phrase 'compelling solutions' and the 'paradigm shift' framing are stronger than the quantitative evidence presented in the body. The abstract should echo the caveats about alpha-tuning and the chi_c1->omega phi failure that the body honestly contains.

Circularity Check

3 steps flagged · score 6.0 of 10

Several 'unquenched' solutions are parameterized to the very data they claim to explain: the ρπ puzzle, χ_c1→γV decays, and the Y(4220)-centered spectrum.

  1. fitted input called prediction [Section 2.2.1, Decoding the ρπ puzzle through the hadronic loop mechanism]
    "The model is constrained using the experimental branching ratios for two reference channels: J/ψ→ρ0π0 and J/ψ→K∗+K−+c.c.. A global fit yields the parameter values: α=0.13, |G_S^PV|=4.51×10^-3 GeV^-1. With these parameters fixed, predictions are made for all other J/ψ→PV channels. ... By fixing the relevant parameters with the experimental data for J/ψ, ψ′→ρπ and K∗K¯+c.c., they reached a similar conclusion: the destructive interference between the long-distance charmed-meson loops and the short-distance amplitudes in ψ′ decays leads to the observed deviations from the “12% rule”."

    The ρπ and K*K branching ratios that define the puzzle are the fitting inputs. The 'destructive interference' that is claimed to explain the suppressed ρπ channel is therefore a property of the fit, not a prediction. The ψ′ suppression is likewise reproduced only after fixing parameters to the ψ′→ρπ and K*K data, so the 'solution' reduces to re-describing the input anomalies.

  2. fitted input called prediction [Section 2.2.3.2, Radiative decays (χ_c1→γV)]
    "The corresponding α ranges for χ_c1→γρ0, γω, γϕ are 2.18<α<2.35, 2.06<α<2.28, and 1.16<α<2.77, respectively, all of which lie within a reasonable parameter space. Notably, a common α range of 2.18<α<2.28 is found for all three radiative decay channels. Thus, the hadronic loop mechanism can serve as the underlying source that reduces the discrepancy..."

    α is not fixed a priori; for each channel the α interval is selected as the range where the theoretical curve overlaps the measured branching ratio. The 'common α range' is an intersection of three individually fitted intervals, so it is a post-fit consistency check rather than a parameter-free prediction. Presenting this as evidence that the hadronic loop mechanism is 'the underlying source' turns the fit into a purported explanation.

1 more flagged steps
  1. fitted input called prediction [Section 4.4.2, Y(4220) as a scaling point to reconstruct J/ψ family within the unquenched picture; Section 4.4 intro]
    "By fitting the masses of fourteen experimentally established charmonium states, including ... together with Y(4220) assigned as the ψ(4S) state, all model parameters can be constrained, which induced the mass of ψ(4S) as 4274 MeV. ... the identification of Y(4220)—a narrow structure near 4.2 GeV—as a scaling point for constructing the higher charmonium family within an unquenched framework, and the emergence of a distinctive mass spectrum for vector charmonia in the 4-4.5 GeV region, which aligns with all available experimental data..."

    Y(4220) is an explicit fitting input: it is one of the states used to constrain the model parameters and is called the 'scaling point' for the higher charmonium spectrum. The later statement that the resulting 4–4.5 GeV mass spectrum 'aligns with all available experimental data' is therefore partly guaranteed by construction, since Y(4220) itself is in the fitted data set. The associated 'prediction' of the partner ψ(4380) is then 'confirmed' by adding a free resonance to a fit, further weakening the independence of the test.

full rationale

The review's central claim—that the unquenched picture is essential and provides compelling solutions—is supported largely by hadronic-loop calculations whose cutoff parameter α is tuned per process or per observable. Three explicit examples are flagged. In the ρπ puzzle, the same anomalous branching ratios used to fix α and the effective short-distance coupling are then said to be explained by destructive interference. In χ_c1→γV, α ranges are selected channel-by-channel by requiring overlap with experiment, and the existence of a common interval is offered as evidence. In the Y-problem sector, Y(4220) is explicitly used as a fitting input and 'scaling point'; its presence in the resulting spectrum cannot be counted as a prediction. These are not merely 'non-consensus' concerns but specific reductions of 'solutions' to the data they were fitted to. At the same time, the paper includes genuine external experimental data and some earlier parameter-free structural arguments (e.g., the 2014 mass-gap estimate of a narrow state near 4.26 GeV), so the circularity is partial rather than total. The score of 6 reflects that several central 'predictions' reduce by construction while the overall enterprise retains independent phenomenological content.

Assumptions & free parameters 7 free parameters · 6 assumptions · 2 invented entities

The review's central argument — unquenched hadronic loops explain the XYZ anomalies — carries a large upstream debt: (i) quantitative loop amplitudes depend on an empirical form-factor cutoff Λ = m_E + αΛ_QCD with α fitted per application; (ii) the 'bare masses' on which loop shifts act come from quenched quark models fitted to the same spectrum; (iii) the Y-problem narrative relies on the assignment Y(4220) = ψ(4S) built into the calibrating mass set; (iv) universality to bottomonium and light flavor is asserted rather than derived. The predicted entities (ψ(4380), Z_cs states) do carry falsifiable handles, keeping the ledger from being purely circular.

free parameters (7)
  • α (hadronic-loop form-factor cutoff) = varies per channel: 0.13; 0.8–1.3; 1.14–1.28; 2.18–2.28; 1–4
    Λ = m_E + αΛ_QCD with Λ_QCD = 220 MeV (Eq. 4); α is fitted to the very branching ratios the loop calculation claims to explain; results vary by orders of magnitude over the admitted α ranges.
  • |G_S^PV| short-distance J/ψ→VP coupling = 4.51×10^-3 GeV^-1
    §2.2.1: global fit to J/ψ→ρ0π0 and J/ψ→K*K−; the other VP channels are then presented as predictions using this fitted universal coupling.
  • ω–ϕ mixing angle θ = 3.4° ± 0.2°
    §2.2.3.1 Eq. (10), taken from prior literature; the χ_c1→ωϕ prediction at this angle fails by ~10^2, exposing the framework's quantitative sensitivity to this input.
  • 4S–3D mixing angle θ_4S−3D = ±(30°–36°)
    §4.4.3 Eqs. (44)–(46): chosen so that the lower eigenstate reproduces the Y(4220) mass interval; the partner ψ(4380) is then 'predicted' from this calibrated angle.
  • Subtraction point s0 in once-subtracted dispersion relation = s0 = m_J/ψ²
    §3.2 Eq. (26): the −81 MeV shift that brings χ_c1(2P) to the X(3872) mass depends on this choice and on the transition-amplitude normalization from the QPC model.
  • Screened-potential parameters (σ, μ, ε_i) = σ = 0.26–0.32 GeV²; μ ≈ 0.14–0.16 GeV; ε_i per interaction type
    §4.2.2/§4.4.2: the unquenched potential model is calibrated on the masses of 14 established states plus Y(4220) assigned as ψ(4S) (Ref. [300]); the resulting mass 4274 MeV is an output of a fit that already contains the state being identified.
  • Fano-like interference background (normalization g, slope a, phases ϕ_k) = g, a, ϕ_k (fit; no table in excerpt)
    §4.4.1 formula: the conclusion that Y(4320)/Y(4390) are 'killed' as independent states depends on this empirical background parameterization and the chosen resonant amplitudes.
assumptions (6)
  • ad hoc to paper Loop amplitudes regularized by the empirical monopole/dipole form factor with cutoff Λ = m_E + αΛ_QCD dominate the long-distance physics
    Eq. (4) and variants throughout §§2.2, 3.3.3; this is the paper's central modeling assumption, not derived from QCD.
  • domain assumption Two-body charmed-meson channels (D̄D, D̄D*, D*D̄*) dominate coupled-channel self-energies and rescattering amplitudes
    §§3.2 (Eqs. 17–19) and 2.2; multi-meson and three-body intermediate states are neglected.
  • domain assumption Quenched quark-model (Cornell/GI) masses are legitimate 'bare' masses on which loop corrections act
    §3.2 Eq. (17): M0 = 3.936 GeV from the GI model for χ_c1(2P); the quoted −81 MeV shift presupposes this bare value.
  • standard math The 12% rule and helicity selection rule give the correct quenched baseline
    §2.1, Eq. (1): the 'puzzles' are defined as deviations from these perturbative QCD expectations.
  • ad hoc to paper Inference to best explanation: an anomaly reproduced by the hadronic-loop mechanism is caused by that mechanism
    The review's overarching argument; no uniqueness proof rules out rival mechanisms (molecules, tetraquarks, hybrids, triangle singularities) producing the same line shapes.
  • ad hoc to paper Universality: unquenched effects apply equally to bottomonium and light-flavor sectors
    §1: 'this effect is universally present in all hadrons', and §7; asserted as an extrapolation from the charmonium applications reviewed.
invented entities (2)
  • ψ(4380) (4S–3D mixed partner of Y(4220)) independent evidence
    purpose: Replaces the Y(4320)/Y(4390) structures and the e+e−→D D̄*_2(2460) enhancement near 4.37 GeV with a single mixed charmonium state; provides a testable partner for Y(4220).
    Predicted mass 4.364–4.400 GeV, dilepton width ~0.25–0.30 keV, and a distinctive DD*_2(2460) decay mode; the review reports a subsequent 4R fit to BESIII ψ(3686)π+π− data finding m = 4374 ± 13 MeV. The entity was introduced in earlier group papers (Ref. [300]), but it has a falsifiable handle.
  • Z_cs / isoscalar Z_c partner structures independent evidence
    purpose: Charged hidden-charm(-strange) four-quark candidates generated by initial single (chiral) pion emission, predicted in J/ψπ±, ψ(3686)π±, and h_cπ± spectra.
    Searchable in BESIII/Belle II data; the review cites partial experimental support, though at the time of writing the Z_cs signals are not firmly established.

how reviews work

0 comments
Cite this review

Pith. "Pith review of Unquenched Charmonium and Beyond." pith.science (2026). https://pith.science/paper/7TI5CCFV

@misc{pith2026260219887,
  author       = {Pith},
  title        = {Pith review of: Unquenched Charmonium and Beyond},
  year         = {2026},
  howpublished = {\url{https://pith.science/paper/7TI5CCFV}},
  note         = {Machine review of arXiv:2602.19887}
}
abstract

The year 2024 marked the 50th anniversary of the discovery of the $J/\psi$ particle, which unveiled the charm quark and the charmonium spectrum, instigating the "November Revolution" in particle physics. This discovery catalyzed the development of quenched potential models, most notably the Cornell model, which provided a foundational quantitative description of the hadronic spectrum. However, the landscape of hadron spectroscopy has been profoundly transformed since the turn of the 21st century with the observation of numerous charmonium-like states, such as $X(3872)$, which exhibit properties starkly at odds with quenched model predictions. These discrepancies, exemplified by the "$X(3872)$ low-mass puzzle" and the "$Y$ problem" associated with vector states like $Y(4260)$, underscore the critical limitations of the quenched approximation and signal the necessity for a new theoretical paradigm. This review synthesizes recent advances in hadronic spectroscopy, arguing that the unquenched picture, which incorporates coupled-channel effects such as hadronic loops, is essential for a unified description of these new states and associated anomalies. We demonstrate how unquenched effects provide compelling solutions to long-standing puzzles in charmonium decays (e.g., the "$\rho\pi$ puzzle" and anomalous dipion transitions), predict and explain the existence of exotic charged states like $Z_c(3900)$ and $Z_b(10610)$ via mechanisms such as Initial Single Pion Emission, and offer a framework for understanding interactions between charmonia and with nucleons. Furthermore, we emphasize the universality of unquenched effects, extending their application to bottomonium and light-flavor sectors. As experimental precision continues to improve, we advocate for the systematic development of unquenched hadronic spectroscopy.

Figures

Figures reproduced from arXiv: 2602.19887 by the authors.

Figure 1
Figure 1. A paradigm shift from the quenched to the unquenched picture. [PITH_FULL_IMAGE:figures/full_fig_p004_1.png] view at source ↗
Figure 2
Figure 2. Comparison of the dipion invariant-mass distribution between the experimental measurement [ [PITH_FULL_IMAGE:figures/full_fig_p010_2.png] view at source ↗
Figure 3
Figure 3. Quark-level short-distance contribution for the [PITH_FULL_IMAGE:figures/full_fig_p011_3.png] view at source ↗
Figures from the paper (129 more)
Figure 4
Figure 4. Figure 4: Quark-level (left) and hadron level (right) long-distance contribution for the [PITH_FULL_IMAGE:figures/full_fig_p011_4.png]
Figure 5
Figure 5. Figure 5: Feynman diagrams for J/ψ → ρ 0π 0 via D (∗) -meson loops. Diagrams (a)–(f) involve neutral charmed mesons; charged-meson loops follow by replacement D (∗)0 → D (∗)± . Adapted from Ref. [59]. The dominant long-distance contribution is modeled by the hadronic loop mechan…
Figure 6
Figure 6. Figure 6: Quark- and hadron-level Feynman diagrams illustrating the hadronic loop transitions [PITH_FULL_IMAGE:figures/full_fig_p013_6.png]
Figure 7
Figure 7. Figure 7: Left panel: The decay widths for the non- [PITH_FULL_IMAGE:figures/full_fig_p014_7.png]
Figure 8
Figure 8. Figure 8: t-channel (a, b) and s-channel (c) hadronic loop of ψ(3770) → VP. Figure adapted from Ref. [62]. Both Refs. [62] and [61] find that the t-channel transitions appear to play a dominant role in the ψ(3770) → VP decays, whereas the s-channel and EM contributions are gener…
Figure 9
Figure 9. Figure 9: Hadronic loop contributions to χc1 → VV at the quark and hadron levels. The ellipsis indicates additional hadron level diagrams obtained via the charge-conjugation operation D (∗) (s) ⇌ D¯ (∗) (s) . Figure adapted from Ref. [63] The processes χc1 → VV proceed via the h…
Figure 10
Figure 10. Figure 10: Contour plots showing the dependence of BR(χc1 → ωω), BR(χc1 → ϕϕ), and BR(χc1 → ωϕ) on the parameters θ and α. The region between the two vertical solid lines denotes the range allowed by the 1σ uncertainty of the mixing angle θ. The figure is adapted from Ref. [63].…
Figure 11
Figure 11. Figure 11: Hadronic loop diagrams illustrating the long-distance contributions of [PITH_FULL_IMAGE:figures/full_fig_p017_11.png]
Figure 12
Figure 12. Figure 12: Feynman diagrams for the J/ψ → γηc process in the hadronic loop mechanism. The left panel shows the triangle diagram contributions, while the right panel shows the contact terms. Similar diagrams also occur in ψ ′ → γηc and γη′ c [170]. From [PITH_FULL_IMAGE:figures/…
Figure 13
Figure 13. Figure 13: The left panel shows the typical quark level diagrams that describe the hadronic loop contributions to the processes [PITH_FULL_IMAGE:figures/full_fig_p019_13.png]
Figure 14
Figure 14. Figure 14: The branching ratios of χc1 → γρ0 , γω, γϕ as functions of the parameter α. The red dashed lines with blue bands represent the experimental measurements [72], while the blue solid curves denote the theoretical predictions incorporating both the hadronic loop contribut…
Figure 15
Figure 15. Figure 15: The comparison between experimental and theoretical masses is shown in each subfigure. The experimental values are positioned on the [PITH_FULL_IMAGE:figures/full_fig_p022_15.png]
Figure 16
Figure 16. Figure 16: The low-mass puzzle for selected hadrons. This figure is updated from Ref. [ [PITH_FULL_IMAGE:figures/full_fig_p023_16.png]
Figure 17
Figure 17. Figure 17: Loop diagrams: (a) electron-photon, (b) quark-level hadron, (c) hadron-level hadron. [PITH_FULL_IMAGE:figures/full_fig_p024_17.png]
Figure 18
Figure 18. Figure 18: Solutions of the coupled-channel equation for [PITH_FULL_IMAGE:figures/full_fig_p024_18.png]
Figure 19
Figure 19. Figure 19: Solution of the coupled-channel equation for [PITH_FULL_IMAGE:figures/full_fig_p025_19.png]
Figure 20
Figure 20. Figure 20: (a) The DD¯ invariant mass spectrum from γγ → DD¯ [50]. (b) The ωJ/ψ invariant mass (W) distribution from γγ → ωJ/ψ candidate events [49]. (c) The ϕJ/ψ invariant mass spectrum from γγ → ϕJ/ψ [329]. All results are from the Belle Collaboration. Furthermore, the product…
Figure 21
Figure 21. Figure 21: The observed P-wave charmonium states and candidates (a), the comparisons of theoretical and experimental decay widths of Z(3930) with assignment of χc2(2P) and X(3915) with interpretation of χc0(2P), and the theoretical widths of χcJ (3P) and the comparisons of theor…
Figure 22
Figure 22. Figure 22: Comparison of masses between χcJ (2P) states from the GI model and the observed X(3872), X(3915), and Z(3930). The figures are taken from Ref. [321]. frameworks that move beyond the static quark model by dynamically incorporating the dressing of the bare cc¯ core with…
Figure 23
Figure 23. Figure 23: (a) Radial wave functions of χcJ (2P) states for different values of the oscillator parameter β. (b) Decay amplitude for χc0(2P) → DD¯ as a function of β, showing contributions from positive (RnL(p) > 0, dashed-dotted) and negative (RnL(p) < 0, dotted) wave function r…
Figure 24
Figure 24. Figure 24: Diagrams for the decays χ ′ c0 → J/ψω (a) and χ ′ c2 → J/ψω (b-d), taken from Ref. [224]. Here χ ′ c0 and χ ′ c2 are χc0(2P) and χc2(2P), respectively. 1 2 3 4 102 103 [PITH_FULL_IMAGE:figures/full_fig_p031_24.png]
Figure 25
Figure 25. Figure 25: Dependence on the parameter α of (a) the ratio of decay widths Γ(χ ′ c0 → J/ψω)/Γ(χ ′ c2 → J/ψω), and (b) the partial widths for χ ′ c0,c2 → J/ψω (shown for the monopole form factor as an example). Figure adapted from Ref. [224]. Here χ ′ c0 and χ ′ c2 are χc0(2P) and…
Figure 26
Figure 26. Figure 26: Feynman diagrams for (a) the direct non-resonant process and (b) the resonant contributions via [PITH_FULL_IMAGE:figures/full_fig_p032_26.png]
Figure 27
Figure 27. Figure 27: (a) Fitted DD¯ invariant mass spectrum (red histogram) compared with Belle (blue dots) and BaBar (green triangles) data. (b) Fitted cos θ ∗ distribution (red histogram) compared with Belle data (blue dots) and background (cyan histogram). Figures from Ref. [349]. The …
Figure 28
Figure 28. Figure 28: The invariant mass spectra of D +D − (a), D −K + (b), and D +K + (c) in B + → D +D −K + process from LHCb [350]. 3.3.5. The experimental measurement of B → KDD from the LHCb Collaboration ¯ The decay B + → D +D −K + proceeds via a b¯ → cc¯s¯ transition and offers a cl…
Figure 29
Figure 29. Figure 29: The observations of charmonium-like Y states. The data are obtained from Refs. [51, 379, 52, 53, 54, 56, 55, 380, 388, 392, 396, 397]. The abundance of phenomena associated with these Y states presents a challenging yet promising issue: how to understand their nature.…
Figure 30
Figure 30. Figure 30: The observed Y(4260) in the e + e − → J/ψπ+π − process from the BaBar Collaboration [51]. The experimental journey of Y(4260) resonance commenced in 2005 with the BaBar collaboration’s analysis of initial-state radiation (ISR) events using 233 fb−1 of data collected a…
Figure 31
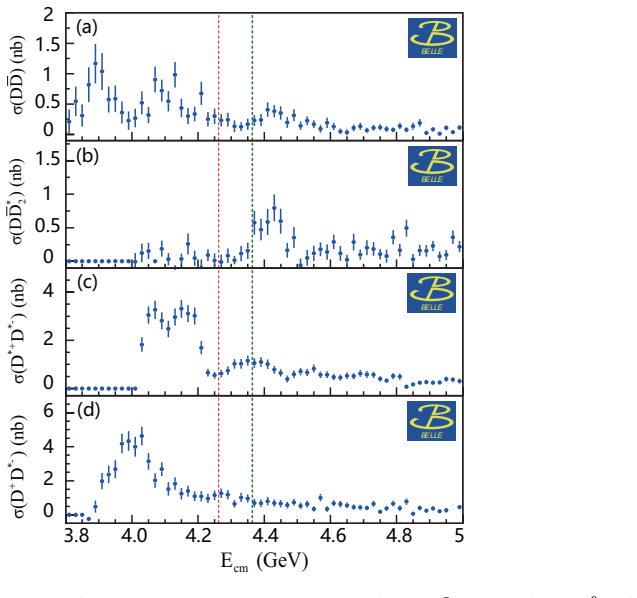
Figure 31. Figure 31: The experimental cross sections of e + e − annihilation from Belle Collaboration in e + e − → DD¯ (a) [455], e + e − → D 0D −π + (b) [450], e + e − → D ∗+D ∗− (c) [449], and e + e − → D +D ∗− (d) [449] channels. The vertical red and green dashed lines represent the ce…
Figure 32
Figure 32. Figure 32: The experimental R value taken from the PDG [456] (a) and the detailed data in the range of √ s = 4.1∼4.4 GeV (b). The vertical red lines in figure (b) represent the central masses of Y(4260) and Y(4360). The figure is taken from Ref. [19]. 38 [PITH_FULL_IMAGE:figure…
Figure 33
Figure 33. Figure 33: The diagram depicting the direct production (left panel) and the production via intermediate charmonium (right panel). The figure is [PITH_FULL_IMAGE:figures/full_fig_p039_33.png]
Figure 34
Figure 34. Figure 34: The fitted results of the e + e − → J/ψπ+π − events distribution (left panel), and the change of the line shape of the cross section by adding the contributions from the terms |MNoR| 2 , |Aψ1 | 2 , 2Re(Aψ1M∗ NoR), |Aψ2 | 2 , 2Re(Aψ2M∗ NoR), and 2Re(Aψ1A∗ ψ2 ), step by…
Figure 35
Figure 35. Figure 35: The fitted results of the [PITH_FULL_IMAGE:figures/full_fig_p040_35.png]
Figure 36
Figure 36. Figure 36: The charmonium spectrum obtained by Cornell group [10]. The vertical scale is schematic. State Mass (GeV) Exp Exp Mass (GeV) 1S 3.095 J/ψ 3.096 1P 3.522 χc1(1P) 3.510 2S 3.684 ψ(3686) 3.686 1D 3.810 ψ(3770) 3.773 3S 4.110 ψ(4040) 4.040 2D 4.190 ψ(4160) 4.160 4S 4.460 …
Figure 37
Figure 37. Figure 37: Comparison of the physical masses of the [PITH_FULL_IMAGE:figures/full_fig_p044_37.png]
Figure 38
Figure 38. Figure 38: A comparison between the J/ψ and Υ families [479]. 44 [PITH_FULL_IMAGE:figures/full_fig_p044_38.png]
Figure 39
Figure 39. Figure 39: The dependence of the total decay width of [PITH_FULL_IMAGE:figures/full_fig_p045_39.png]
Figure 40
Figure 40. Figure 40: The measured cross sections of e + e − → J/ψπ+π − [55], e + e − → hcπ +π − [56], e + e − → ψ(3686)π +π − [380], e + e − → hcη [381], e + e − → D 0D ∗−π + [382], e + e − → χc0ω [383], e + e − → J/ψη [384], e + e − → J/ψπ0π 0 [385], e + e − → µ +µ − [386], e + e − → ηcπ…
Figure 41
Figure 41. Figure 41: Measured cross sections of e + e − annihilation into light hadronic final states, in which although no obvious Y(4220) signal is observed, their line shapes exhibit possible structures around 4.2 GeV that warrant confirmation with higher-statistics data in the future.…
Figure 42
Figure 42. Figure 42: The Fano-like interference fit to the cross sections for the [PITH_FULL_IMAGE:figures/full_fig_p053_42.png]
Figure 43
Figure 43. Figure 43: Status of the charmonium-like Y states before 2017 and their updated situation after 2017 (left panel), and the measured resonance parameters of the Y(4220) state in several hidden-charm processes (right panel). Figure adapted from Refs. [327, 300]. In Ref. [300], int…
Figure 44
Figure 44. Figure 44: Experimental cross sections of selected open-charm production channels in [PITH_FULL_IMAGE:figures/full_fig_p056_44.png]
Figure 45
Figure 45. Figure 45: The masses and the open-charm decay behaviors of [PITH_FULL_IMAGE:figures/full_fig_p057_45.png]
Figure 46
Figure 46. Figure 46: Characteristic energy levels of the vector charmonium states in the unquenched charmonium spectrum. Figure is from Ref. [ [PITH_FULL_IMAGE:figures/full_fig_p059_46.png]
Figure 47
Figure 47. Figure 47: (a) The fitted results of the e + e − → ψ(3686)π +π − from Belle and BESIII [380, 521]. (b) The fitted results of the e + e − → ΛcΛ¯ c from Belle and BESIII [54, 520]. The figures are adopted from Ref. [327]. From [PITH_FULL_IMAGE:figures/full_fig_p060_47.png]
Figure 48
Figure 48. Figure 48: (a) The dependence of masses and widths of [PITH_FULL_IMAGE:figures/full_fig_p061_48.png]
Figure 49
Figure 49. Figure 49: The fitted results of the e + e − → π +D 0D ∗− (a) [516], e + e − → ηJ/ψ (b) [236], e + e − → K +K − J/ψ (c) [233], dimuon invariant mass spectra in B + → K +µ +µ − (d) [524] and e + e − → DsD ∗ s (e) [524] processes by the unquenched charmonium spectroscopy. 63 [PIT…
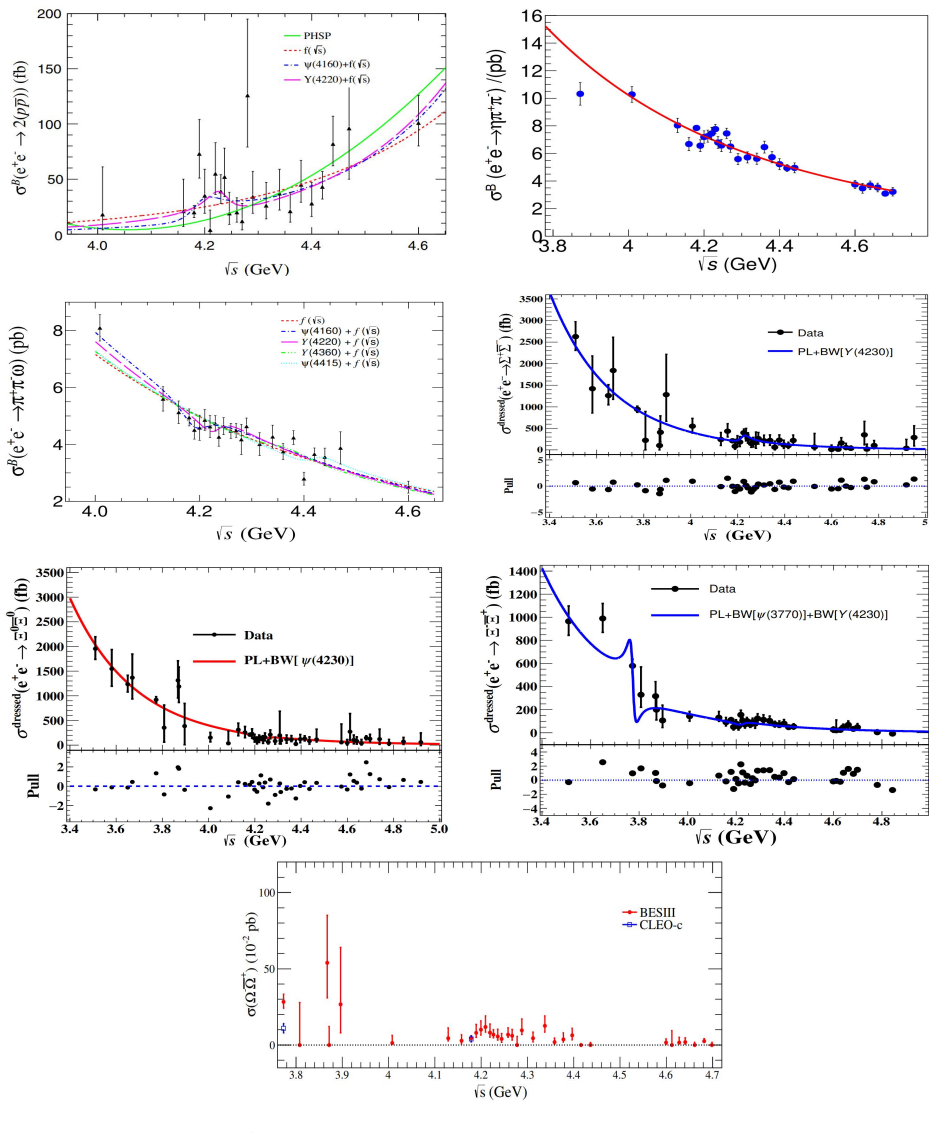
Figure 50
Figure 50. Figure 50: (a) Schematic diagram illustrating the 4 [PITH_FULL_IMAGE:figures/full_fig_p064_50.png]
Figure 51
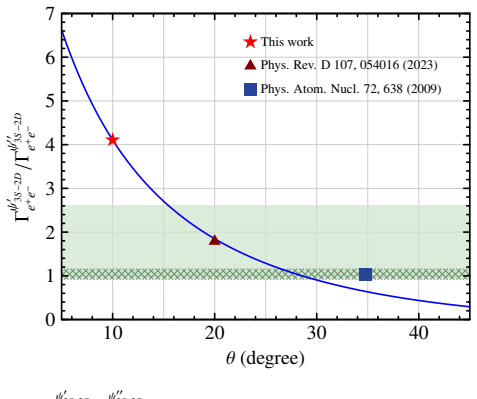
Figure 51. Figure 51: The ratio of dielectronic widths Γ ψ ′ 3S -2D e +e − /Γ ψ ′′ 3S -2D e +e − as a function of the 3S -2D mixing angles. The red pentagram represents the prediction of this work (θ ≈ 10◦ and ratio Γ ψ ′ 3S -2D e +e − /Γ ψ ′′ 3S -2D e +e − ≈ 4.1). The light green and dark…
Figure 52
Figure 52. Figure 52: Coupled-channel description of (a) the e + e − → nonopen-charm hadron and (b) the inclusive hadronic cross sections. Vertical dashed lines indicate the D 0D¯ 0 and D +D¯ − thresholds. nonopen-charm hadron data are from Ref. [538], inclusive hadronic data are from Ref.…
Figure 53
Figure 53. Figure 53: (a) Coupled-channel description of the e + e − → DD¯ cross section. The red solid line represents the full model including ψ(2S ), ψ(1D), and ψ(3S ). Experimental data are from Belle [455] and BESIII [545, 539]. (b) Cross section when either ψ(2S ) or ψ(3S ) is remove…
Figure 54
Figure 54. Figure 54: The mass of Υ(10860) in the inclusive process e + e − → hadrons (blue dots with error bars) and in the hidden bottom processes e + e − → (bb¯)π + pi− with {(bb¯) = Υ(1S, 2S, 3S ), hb(1P, 2P)} (red dots with error bars). The PDG average (black dot with error bar) is al…
Figure 55
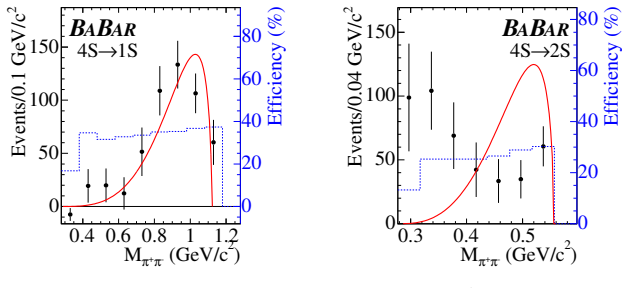
Figure 55. Figure 55: The diagram contributing to Υ(nS ) → Υ(mS )π +π − (left panel) and the peak shifts caused by the triangle diagrams (right panel). Source: Taken from [568]. anomalous large partial widths of Υ(10860) hidden-bottom dipion decays are also a challenge to our understanding…
Figure 56
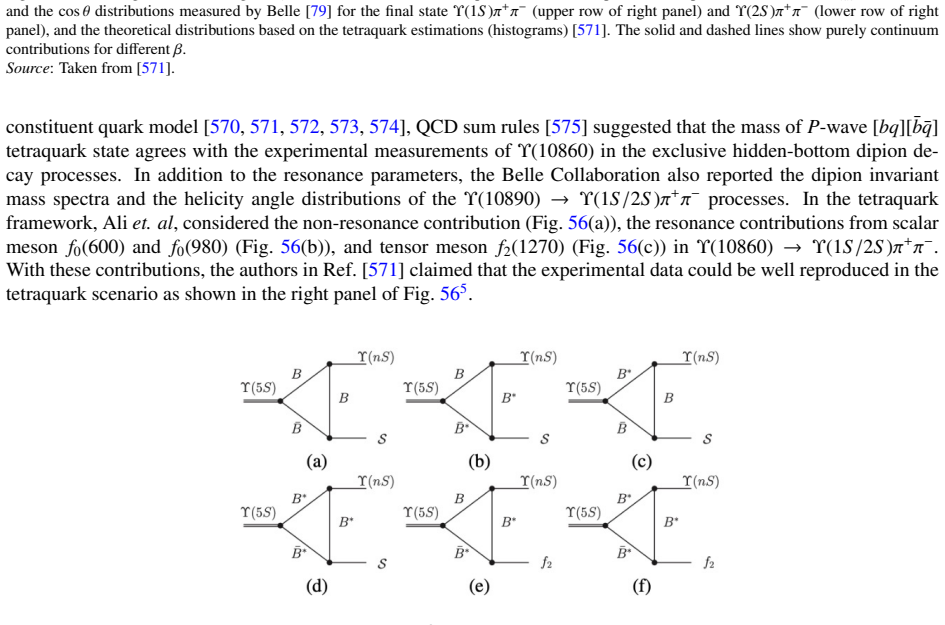
Figure 56. Figure 56: The diagram contributing to Yb(10890) → Υπ +π − in tretraquark scenario (left panel) and dipion invariant mass (mππ) distribution and the cos θ distributions measured by Belle [79] for the final state Υ(1S )π +π − (upper row of right panel) and Υ(2S )π +π − (lower row…
Figure 57
Figure 57. Figure 57: The schematic diagrams for Υ(5S ) decays into Υ(nS )S (diagrams (a)-(d)) and Υ(nS )f2(1270) (diagrams (e)-(f)) (n = 1, 2) via bottom meson loops. Source: Taken from [576]. 5.1.3. Puzzles in the dipion invariant mass distributions and cos θ distributions. In their stud…
Figure 58
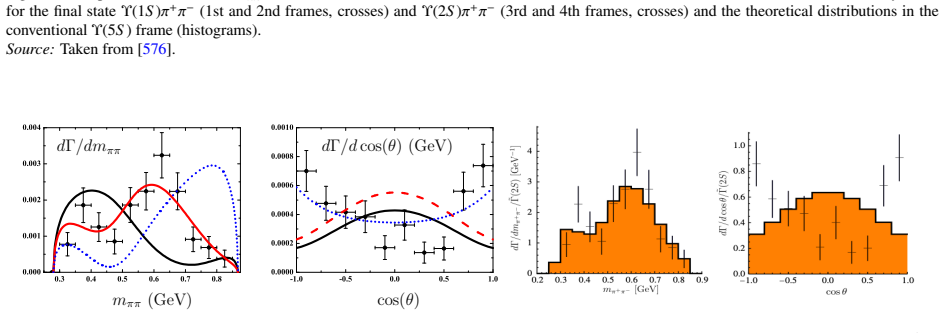
Figure 58. Figure 58: Dipion invariant mass (mππ) distributions (1st and 3rd frames) and the cos θ distributions (2nd and 4th frames) measured by Belle for the final state Υ(1S )π +π − (1st and 2nd frames, crosses) and Υ(2S )π +π − (3rd and 4th frames, crosses) and the theoretical distribu…
Figure 59
Figure 59. Figure 59: Dipion invariant mass (mππ) distributions (1st and 3rd frames) and the cos θ distributions (2nd and 4th frames) of Υ(5S ) → Υ(2S )π +π − reproduced by Chen et al in Ref. [576] (left panel) and in the in the erratum of Ref. [571]. Source: Taken from [576, 571]. In Ref.…
Figure 60
Figure 60. Figure 60: Comparison of fit results (open histogram) with experiment data (points with error bars) for event in the [PITH_FULL_IMAGE:figures/full_fig_p074_60.png]
Figure 61
Figure 61. Figure 61: The hb(1P) (a) and hb(2P) (b) yields as a function of Mmiss(π) (points with error bars) and results of the fit (histogram). Source: Taken from [80] [PITH_FULL_IMAGE:figures/full_fig_p075_61.png]
Figure 62
Figure 62. Figure 62: Diagrams contributing to Υ(5S ) → Υ(2S )π +π − . Here, diagram (a) represents the Υ(5S ) direct decay into Υ(2S )π +π − , while diagram (b) denotes the intermediate hadronic loop contribution to Υ(5S ) → Υ(2S )π +π − . (c) and (d) describe the intermediate Z ± b contr…
Figure 63
Figure 63. Figure 63: The mππ (left frame), mΥ(2S )π (middle frame) invariant mass spectra, and cos θ distribution (right frame) for Υ(5S ) → Υ(2S )π +π − process. The histograms are the fitting results with the contributions from Zb(10610) and Zb(10650), and the dots with errors correspon…
Figure 64
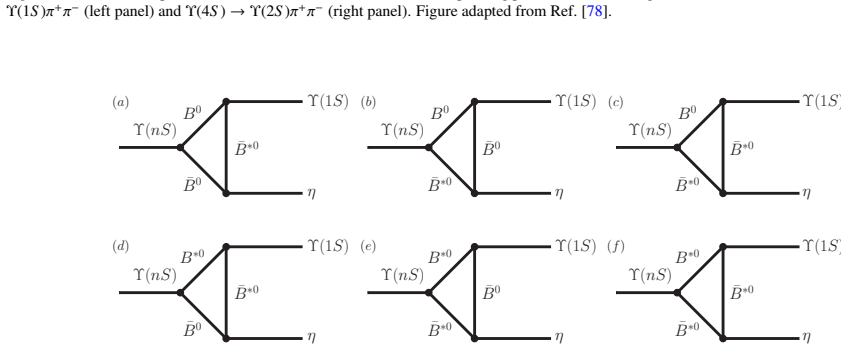
Figure 64. Figure 64: The schematic diagrams for Υ(5S ) → Υ(nS )π +π − by the ISPE mechanism. Here, diagrams (a) and (b) are related to each other by particle antiparticle conjugation, i.e., B (∗) ⇌ B¯(∗) and π + ⇌ π − . After performing the transformations B (∗)+ ⇌ B (∗)0 , B (∗)− ⇌ B¯(∗)…
Figure 65
Figure 65. Figure 65: The obtained theoretical line shapes of dΓ(Υ(5S ) → Υ(nS )π +π − )/dmΥ(nS )π + , and the comparison of our result with the Belle data (the third column) [80]. The first, the second and the fourth columns correspond to the numerical result considering BB¯ ∗ + h.c., B ∗…
Figure 66
Figure 66. Figure 66: The theoretical curves of dΓ(Υ(5S ) → hb(1P)π +π − )/dmhb (1P)π + (the first column) and dΓ(Υ(5S ) → hb(2P)π +π − )/dmhb (2P)π + (the second column). For easily comparing our result with the experimental data, one adopts the vertical dashed and dotted lines to denote …
Figure 67
Figure 67. Figure 67: (Color online.) The invariant mass spectra of [PITH_FULL_IMAGE:figures/full_fig_p080_67.png]
Figure 68
Figure 68. Figure 68: (Color online.) A comparison of the hcπ ± mass distribution of ψ(4160) → hc(1P)π +π − (solid line) predicted in this work and measure￾ment by CLEO-c (points with errors) [617]. Here, CLEO-c measured the hc(1P)π ± mass distribution from e + e − → hc(1P)π +π − at ECM = …
Figure 69
Figure 69. Figure 69: Fit to the Mmax(π ± J/ψ) distributions of e + e − → π +π − J/ψ at √ s = 4.26 GeV form the BESIII (diagram (a)) [550] and Belle (diagrma (b)) [551] Collaborations. Dots with error bars are experimental data from BESIII and Belle Collaborations [550, 551], the red solid…
Figure 70
Figure 70. Figure 70: The typical diagrams depicting Y(4260) → J/ψπ+π − decay. Here, diagram (a) denotes Y(4260) direct decay into J/ψπ+π − , diagram (b) describes the intermediate hadronic loop contribution to Y(4260) → J/ψπ+π − , and diagrams (c) and (d) are from the ISPE mechanism. Sour…
Figure 71
Figure 71. Figure 71: (color online). The distributions of the [PITH_FULL_IMAGE:figures/full_fig_p083_71.png]
Figure 72
Figure 72. Figure 72: (color online). Feynman diagrams contributing to the process [PITH_FULL_IMAGE:figures/full_fig_p084_72.png]
Figure 73
Figure 73. Figure 73: (color online). Combined fit for the ψ(3686)π ± and π +π − invariant mass spectra at different center-of-mass energies reported by the BESIII Collaboration in Ref. [380]. The black dashed and red solid curves are the fitted results under three-charmonium and four-char…
Figure 74
Figure 74. Figure 74: The di-η (diagrams (a) and (b))and di-kaon (diagrams (c) and (d)) decays in the ISChE mechanism. It’s worth mentioning that in the di-η decay process, the initial and final states could be connected by both the charmed meson loops (diagram (a)) and charmed-strange mes…
Figure 75
Figure 75. Figure 75: The Mmax(J/ψη) distributions of Y(4660) → ηηJ/ψ (left panel) and ψ(4790) → ηηJ/ψ (right panel). Here, the diagrams (a), (b) and (c) are the lineshapes resulted from the intermediate DD¯, D ∗D¯ + H.c. and D ∗D¯ ∗ , respectively, while the digrams (d), (e) and (f) are t…
Figure 76
Figure 76. Figure 76: Dependence of the distribution of dΓ/dmJ/ψK+ on the J/ψK + invariant mass spectrum (red solid curves). The diagrams (a) and (d), diagrams (b) and (e), and diagrams (c) and (f), are the results considering the intermediate DD¯ s + H.C., D ∗D¯ s + DD¯ ∗ s + H.C., and D …
Figure 77
Figure 77. Figure 77: Invariant mass distributions of (a) K +K − , (b) K + J/ψ, and (c) K − J/ψ for K +K − J/ψ events with 4.4 < M(K +K − J/ψ) < 5.5 GeV/c 2 . Solid histograms are for events in the J/ψ signal region, and the shaded histograms are normalized background from the J/ψ mass sid…
Figure 78
Figure 78. Figure 78: The experimental observation of Z − cs (left panel) in the K + recoil mass spectra of e + e − → K + (D − s D ∗0 + D ∗− s D 0 ) [666] and Z 0 cs (right panel) in the K 0 s recoil mass spectra of e + e − → K 0 s (D + s D ∗− + D ∗+ s D − ) [667] by the BESIII Collaborati…
Figure 79
Figure 79. Figure 79: Distributions of Mmax(K ± J/ψ) of e + e − → K +K − J/ψ reported by BESIII Collaboration [668]. The red dashed, blue dash-dotted, and pink dotted lines are the signal component of Zcs, the phase space and the combinatorial background, respectively. Source: Taken from […
Figure 80
Figure 80. Figure 80: Distributions of RM2 (K ± ) of e + e − → K +K −ψ(3686) (diagram (a) and (b)) and mK 0 S ψ(3686) of e + e − → K 0 S K 0 S ψ(3686) reported by BESIII Collaboration [669, 670] . Source: Taken from [669, 670] 91 [PITH_FULL_IMAGE:figures/full_fig_p091_80.png]
Figure 81
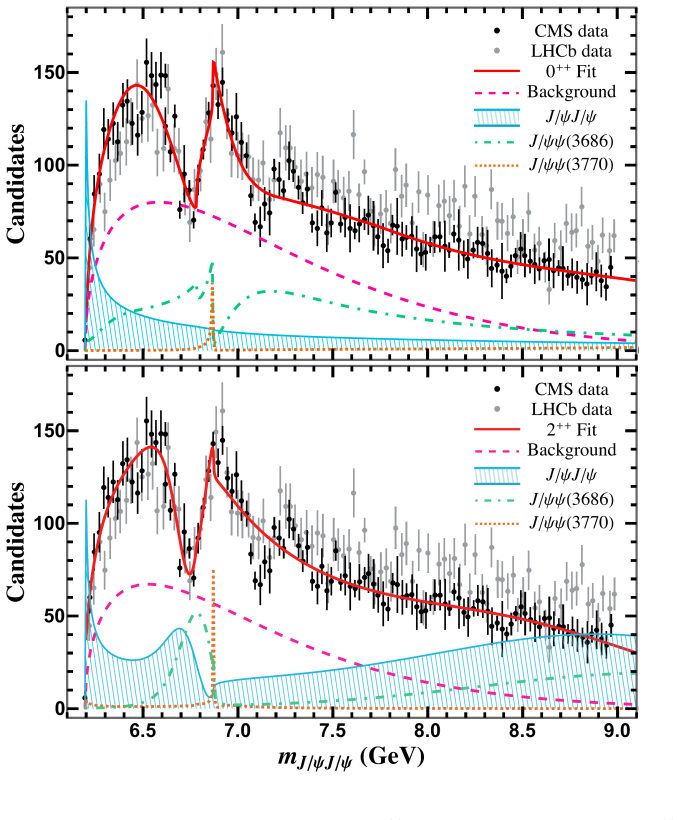
Figure 81. Figure 81: Di-J/ψ invariant mass spectra with p di−J/ψ T > 5.2 GeV from LHCb, showing fits with (a) NRSPS+DPS, (b) model I, and (c) model II [84]. though it altered the extracted masses and widths. 6.5 7 7.5 8 8.5 9 0 20 40 60 80 100 120 140 160 180 Candidates / 25 MeV Data Fit …
Figure 82
Figure 82. Figure 82: CMS di-J/ψ mass spectrum fitted with three Breit-Wigners without (left) and with (right) interference [86]. ATLAS also analyzed di-J/ψ and J/ψ + ψ(2S ) channels using 140 fb−1 at 13 TeV [85]. For di-J/ψ, two models were employed: model A included three interfering res…
Figure 83
Figure 83. Figure 83: Fitted spectra in di-J/ψ channel with models A (a), B (b), and in J/ψ + ψ(2S ) channel with models α (c) and β (d), by ATLAS [85]. 93 [PITH_FULL_IMAGE:figures/full_fig_p093_83.png]
Figure 84
Figure 84. Figure 84: The schematic diagrams for the production mechanism of a double charmonium [PITH_FULL_IMAGE:figures/full_fig_p096_84.png]
Figure 85
Figure 85. Figure 85: Fit results to the experimental results, where (I) for LHCb data fit [ [PITH_FULL_IMAGE:figures/full_fig_p097_85.png]
Figure 86
Figure 86. Figure 86: Extracted pole positions from Refs. [779], where left is for the two channel model, right is for the three channel model [779]. the stabilities of the poles there are different. This means, if there actually exists X(6600), and the description on the dip and X(6900) i…
Figure 87
Figure 87. Figure 87: The J/ψψ(2S ) invariant mass spectrum, where (a) is the predictions given by Ref. [779], (b) is a comparison with ATLAS data presented in Ref. [784]. Then, to further study the quantum numbers of the experimental observed structures in di-J/ψ spectrum, Ref. [780] perf…
Figure 88
Figure 88. Figure 88: Fit results to the LHCb data. Here, the top left figure considers [PITH_FULL_IMAGE:figures/full_fig_p099_88.png]
Figure 89
Figure 89. Figure 89: Feynman diagrams of the scattering amplitudes of charmonia given in Ref. [ [PITH_FULL_IMAGE:figures/full_fig_p100_89.png]
Figure 90
Figure 90. Figure 90: , it is found that this model can provide very strong contributions to the interactions between vector charmonia, since there all exists poles near thresholds, including J/ψJ/ψ, J/ψψ(2S ), and ψ(2S )ψ(2S ) channels. Furthermore, a comparison of the scattering cross se…
Figure 91
Figure 91. Figure 91: Two-pion exchanges between the ψ(2S ) and J/ψ, where (a) is for t-channel and (b) is for u-channel. (c) The contributions to the amplitude for the transition ψα → ψβππ including the coupled-channel (ππ and KK¯) FSI. In (c), the solid and dashed lines label charmonia a…
Figure 92
Figure 92. Figure 92: The DD¯ triangle diagram in J/ψψ(3770) scattering process, where ψ ′′ denotes the ψ(3770) meson [790]. Another mechanism to explore the nature of X(6900) is proposed by Ref. [790]. Since this peak is closed to the J/ψψ(3770) threshold, considering that ψ(3770) can str…
Figure 93
Figure 93. Figure 93: (a): Triangle diagram contribution, with [PITH_FULL_IMAGE:figures/full_fig_p103_93.png]
Figure 94
Figure 94. Figure 94: (I) A novel approach enabling one-boson exchange for e [PITH_FULL_IMAGE:figures/full_fig_p103_94.png]
Figure 95
Figure 95. Figure 95: The fit results on experimental data are presented, with the top panel for 0 [PITH_FULL_IMAGE:figures/full_fig_p104_95.png]
Figure 96
Figure 96. Figure 96: The S -wave N-cc¯ potential extracted at t/a = 13, 14, and 15 for N-J/ψ with 4S 3/2 (a), with 2S 1/2 (b), and N-ηc with 2S 1/2 (c). The red bands show the fit results with phenomenological three-range Gaussians at t/a = 14. The three potentials at t/a = 14 are also sh…
Figure 97
Figure 97. Figure 97: (Color online). The Ωccc-Ωccc potential V(r) in the 1S 0 channel as a function of separation r at Euclidean time t/a = 25 (red square), 26 (blue diamond) and 27 (green circle). c c¯ c c¯ c c¯ q q¯ qq¯ creation qq¯ annihilation ⋯⋯ A A A A A A B B B B C C C C “Breathing…
Figure 98
Figure 98. Figure 98: Breathing hadron inspired by unquenched picture. [PITH_FULL_IMAGE:figures/full_fig_p107_98.png]
Figure 99
Figure 99. Figure 99: The R value as a function of center-of-mass energy √ s from various experiments. The step-like structure corresponds to the opening of new quark flavor thresholds, while sharp peaks indicate vector meson resonances. Notable structures include the ϕ(1020), J/ψ, ψ(2S ),…
Figure 100
Figure 100. Figure 100: Bottomonium mass spectrum. From left to right: predictions of the modified GI model [ [PITH_FULL_IMAGE:figures/full_fig_p111_100.png]
Figure 101
Figure 101. Figure 101: A comparison of the results of screening potential model and those obtained by a coupled-channel quark model [ [PITH_FULL_IMAGE:figures/full_fig_p111_101.png]
Figure 102
Figure 102. Figure 102: Schematic diagram for a typical hadronic transition in the QCDME approach. Here, MGE denotes multipole gluon emission from the [PITH_FULL_IMAGE:figures/full_fig_p112_102.png]
Figure 103
Figure 103. Figure 103: Measured dipion invariant mass distributions for the processes [PITH_FULL_IMAGE:figures/full_fig_p113_103.png]
Figure 104
Figure 104. Figure 104: The fitted dipion invariant mass distributions and the corresponding predictions for the angular distributions [PITH_FULL_IMAGE:figures/full_fig_p115_104.png]
Figure 105
Figure 105. Figure 105: Feynman diagram illustrating the hadronic loop contributions to the transitions [PITH_FULL_IMAGE:figures/full_fig_p115_105.png]
Figure 106
Figure 106. Figure 106: Feynman diagram illustrating the hadronic loop contributions to the transitions [PITH_FULL_IMAGE:figures/full_fig_p116_106.png]
Figure 107
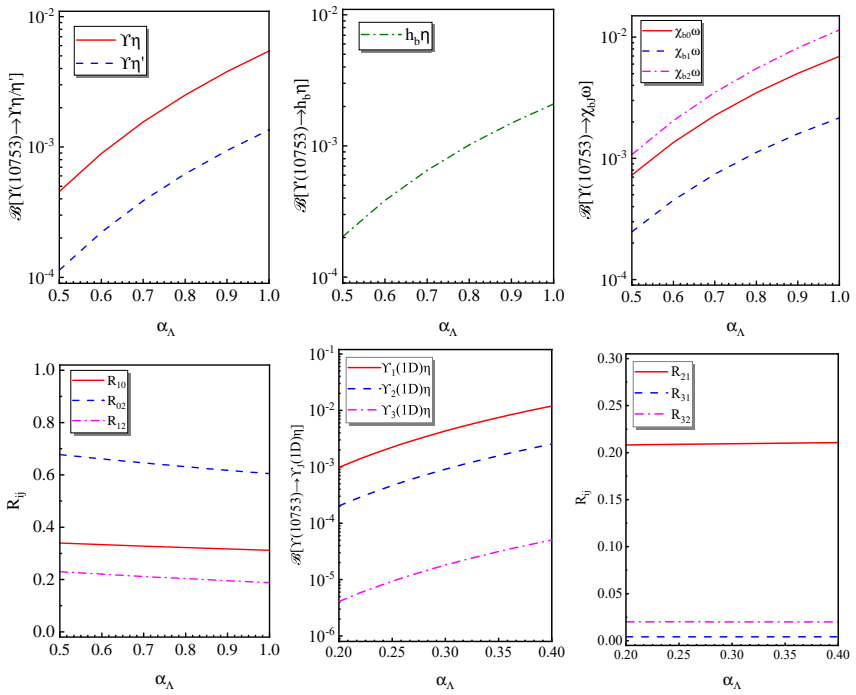
Figure 107. Figure 107: Feynman diagrams illustrating the η transitions of Υ(10860) → Υ(13DJ )η with J = 1, 2, 3. Adapted from Ref. [878]. It is found that the branching ratios for Υ(10860) → Υ(13DJ )η are of the order of O(10−3 ), which are comparable to those of the experimentally observe…
Figure 108
Figure 108. Figure 108: The predicted branching ratios of Υ(10860) → Υ(13DJ )η (left panel), as well as the ratios between them (right panel). Figure adapted from Ref. [878]. Following the publication of the theoretical work, the Belle Collaboration reported the first observation of the pro…
Figure 109
Figure 109. Figure 109: Feynman diagram depicting Υ(10860) → χbJω decay within the hadronic loop mechanism. Figure adapted from Ref. [880]. 118 [PITH_FULL_IMAGE:figures/full_fig_p118_109.png]
Figure 110
Figure 110. Figure 110: The branching ratios of Υ(10860) → χbJω as functions of the parameter αΛ. The horizontal bands represent the experimental measurements reported by the Belle Collaboration [871], while the vertical bands indicate the reasonable ranges of αΛ where the theoretical resul…
Figure 111
Figure 111. Figure 111: Cross sections for e + e − → Υ(nS )π +π − measured by the Belle Collaboration [566], showing the structure of Υ(10753). The figure is adapted from Ref. [566]. 121 [PITH_FULL_IMAGE:figures/full_fig_p121_111.png]
Figure 112
Figure 112. Figure 112: The predicted masses (left panel) and dielectron widths (right panel) of the mixed bottomonium states [PITH_FULL_IMAGE:figures/full_fig_p122_112.png]
Figure 113
Figure 113. Figure 113: Schematic diagrams for the Υ(10753) → Υ(nS )π +π − (n = 1, 2, 3) processes within the hadronic-loop mechanism. Here, S represents the scalar mesons σ and f0(980). The figure is adapted from Ref. [898]. from the measured cross sections [566]. These quantities are dire…
Figure 114
Figure 114. Figure 114: Dependence of the branching ratios BR[Υ(10753) → Υ(nS )π +π − ] (n = 1, 2, 3) on the parameter αΛ. The red solid lines represent the predictions from the hadronic loop mechanism [898], while the gray bands with blue dotted lines indicate the experimental values extra…
Figure 115
Figure 115. Figure 115: Predicted dipion invariant-mass spectra for the decays [PITH_FULL_IMAGE:figures/full_fig_p123_115.png]
Figure 116
Figure 116. Figure 116: Distributions of dipion mass at √ s = 10.746 GeV for Υ(1S )π +π − (left panel) and Υ(2S )π +π − (right panel). Adapted from Ref. [899]. The other two-body hidden-bottom decay channels of Υ(10753) have also been systematically studied within the hadronic loop mechanis…
Figure 117
Figure 117. Figure 117: The predicted branching ratios and characteristic ratios for the two-body hidden-bottom decay channels of [PITH_FULL_IMAGE:figures/full_fig_p125_117.png]
Figure 118
Figure 118. Figure 118: (1) The predicted branching ratios for Υ(10753) → ηbη (′) and Υ(10753) → ηb(1S )ω within the hadronic loop mechanism; (2) the characteristic ratios between BR[Υ(10753) → ηbη (′) ] and BR[Υ(10753) → ηbω], evaluated with the η–η ′ mixing angle taken as −19.1 ◦ or −14.4…
Figure 119
Figure 119. Figure 119: Measured resonance parameters of the Y(2175) (left panel) and the ρ(2150) (right panel) from different experimental processes. The figures are adapted from Refs. [946, 916]. The current difficulties encountered in the construction of high-exciting light-flavor mesons…
Figure 120
Figure 120. Figure 120: Comparison between the theoretical predictions and experimental measurements for the masses of light-flavor vector mesons. Adapted [PITH_FULL_IMAGE:figures/full_fig_p130_120.png]
Figure 121
Figure 121. Figure 121: Simultaneous description of the cross sections for the seven open-strange processes [PITH_FULL_IMAGE:figures/full_fig_p131_121.png]
Figure 122
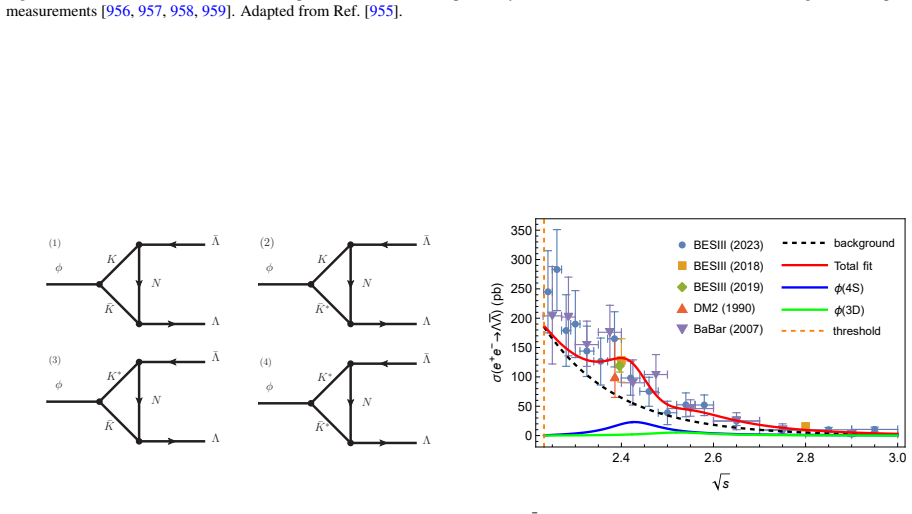
Figure 122. Figure 122: Measured cross section for the process e + e − → ΛΛ¯ reported by the BESIII Collaboration in 2023 [955], together with previous measurements [956, 957, 958, 959]. Adapted from Ref. [955]. φ K K¯ N Λ¯ Λ φ K K¯ ∗ N Λ¯ Λ φ K∗ K¯ N Λ¯ Λ φ K∗ K¯ ∗ N Λ¯ Λ (1) (2) (3) (4) B…
Figure 123
Figure 123. Figure 123: Left panel: Feynman diagrams for the processes [PITH_FULL_IMAGE:figures/full_fig_p132_123.png]
Figure 124
Figure 124. Figure 124: A comparison of resonance parameters of the reported [PITH_FULL_IMAGE:figures/full_fig_p133_124.png]
Figure 125
Figure 125. Figure 125: Feynman diagrams for the reactions e + e − → ωη and e + e − → ωπ0π 0 . Panels (a) and (b) correspond to e + e − → ωη. Panels (c)–(e) depict the mechanisms of e + e − → ωπ0π 0 . Here, ω ∗ denotes the ω(4S ) and ω(3D) intermediate states, while X1 denotes ρ, ρ(1450), a…
Figure 126
Figure 126. Figure 126: Fitted results to the experimental cross section data and the corresponding resonance contributions for [PITH_FULL_IMAGE:figures/full_fig_p134_126.png]
Figure 127
Figure 127. Figure 127: The measured cross sections for (a) e + e − → ρπ and (b) e + e − → ρ(1450)π → π +π −π 0 . The red points with error bars denote the experimental data. The blue solid curve with the shaded band represents the total fit, while the green dashed curve shows the continuum…
Figure 128
Figure 128. Figure 128: The masses of the mixed state ω ′ 4S−3D and ω ′′ 4S−3D as function of the 4S -3D mixing angle θ. The light red horizontal band represents the measured mass of the Y(2119), while the yellow vertical bands indicate the mixing angles at which the theoretical mass of ω ′…
Figure 129
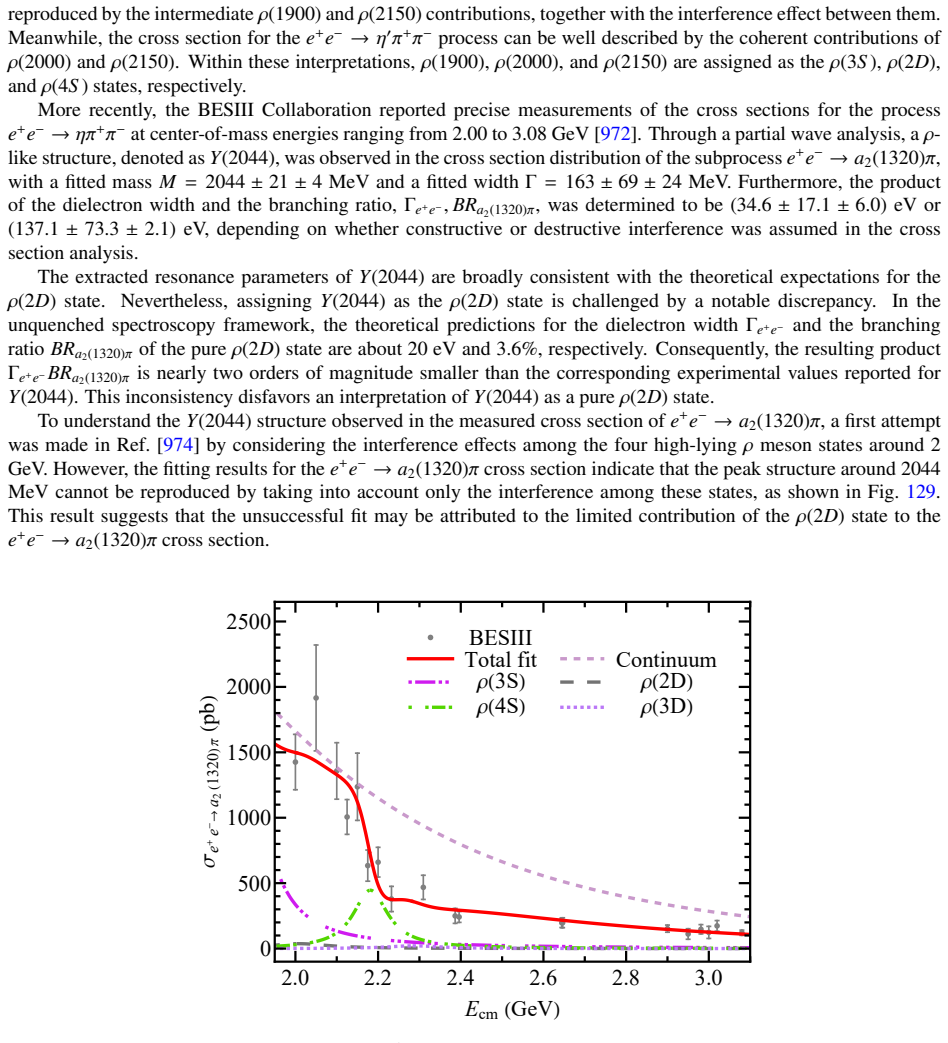
Figure 129. Figure 129: Fit to the measured cross section of the process [PITH_FULL_IMAGE:figures/full_fig_p137_129.png]
Figure 130
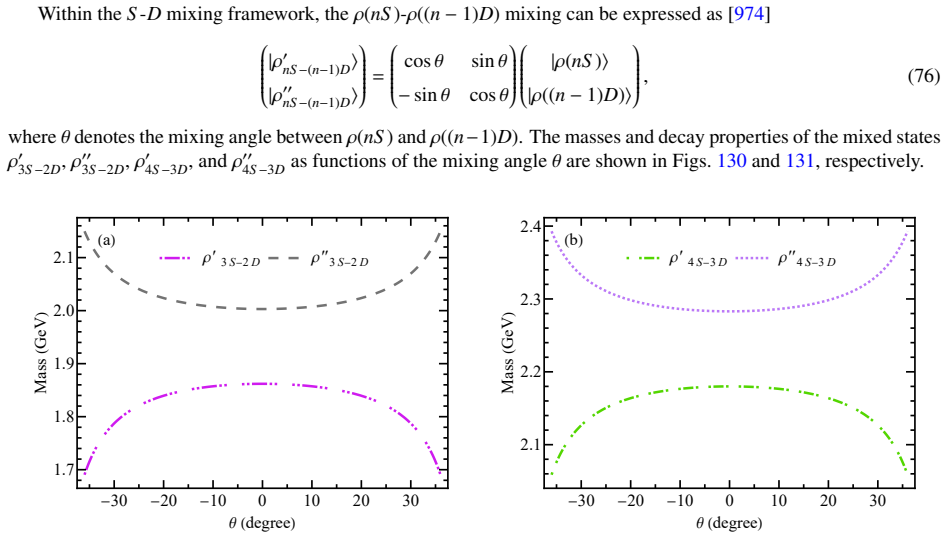
Figure 130. Figure 130: Masses of the mixed states as functions of the mixing angle [PITH_FULL_IMAGE:figures/full_fig_p138_130.png]
Figure 131
Figure 131. Figure 131: Decay behaviors of the mixed states ρ ′ 3S−2D , ρ ′′ 3S−2D , ρ ′ 4S−3D , and ρ ′′ 4S−3D as functions of the mixing angle θ. Panel (a) shows the total widths, panel (b) shows the dielectron widths, and panels (c)–(h) show the products of the dielectron width and branc…
Figure 132
Figure 132. Figure 132: Combined fit to the measured cross sections for the processes [PITH_FULL_IMAGE:figures/full_fig_p140_132.png]

Discussion (0). Sign in to comment.

Forward citations

Cited by 16 Pith papers

Reviewed papers in the Pith corpus that reference this work. Sorted by Pith novelty score.

  1. Measurement of Born Cross Section for $e^+e^-\to K_S^0\bar{\Xi}^+\Sigma^-+\rm{c.c.}$ at $\sqrt{s} = 3.51-4.95$ GeV

    hep-ex 2026-07 accept novelty 6.0 of 10

    First Born cross-section measurement for e+e−→K_S^0 \barΞ^+ Σ^- + c.c. at 3.51–4.95 GeV shows a smooth continuum with no charmonium-like resonance signals and a K_S^0-to-K^- ratio consistent with isospin conservation.

  2. The supernumerary $K(1690)$ signal from COMPASS as a strange hybrid state

    hep-ph 2026-07 conditional novelty 6.0 of 10

    Among three pseudoscalar strange mesons seen at 1–2 GeV, the K(1690) is the one the quark model cannot accommodate, and its computed decay width as a 0⁻ strange hybrid matches experiment.

  3. Possible hidden-bottom molecular pentaquarks from $P$-wave $\Lambda_bB^{(*)}/\Sigma_b^{(*)}B^{(*)}$ interactions

    hep-ph 2026-07 conditional novelty 6.0 of 10

    P-wave Lambda_b B(*)/Sigma_b(*) B(*) one-boson-exchange dynamics predicts a spectrum of positive-parity hidden-bottom molecular pentaquark candidates, including Sigma_b B* and Sigma_b* B* bound states and resonances.

  4. Predictions for the scalar partner of the LHC tetraquark $X(6600)$

    hep-ph 2026-05 accept novelty 6.0 of 10

    The paper predicts a scalar cc-ccbar tetraquark state (X(6400)) and identifies it as the partner to the recently observed tensor state X(6600).

  5. Vector charmonium(-like) states in the energy range of 4.1-4.6 GeV

    hep-ph 2026-06 unverdicted novelty 5.0 of 10

    A coupled-channel framework is developed and fitted to BESIII data on vector charmonium-like states in the 4.1-4.6 GeV range, concluding that coupled-channel effects with dynamically generated poles explain the line shapes.

  6. Proposed mixing between $2P$ and $1F$ wave charmonia

    hep-ph 2026-04 unverdicted novelty 5.0 of 10

    Unquenched coupled-channel calculations yield sizable 2P–1F mixing angles of 7.5° and 15.4° for the χ_c2 charmonia, with predicted two-photon and two-gluon widths as experimental tests.

  7. Proposed mixing between $2P$ and $1F$ wave charmonia

    hep-ph 2026-04 unverdicted novelty 5.0 of 10

    Unquenched calculation finds sizable 2P-1F mixing in charmonium with angles 7.5° and 15.4°, yielding predictions for two-photon and two-gluon decay widths.

  8. Unquenched Radially Excited $P$-wave Charmonia

    hep-ph 2026-04 unverdicted novelty 5.0 of 10

    Unquenched calculations of radially excited P-wave charmonia masses via Resonance-Spectrum Expansion with generalized 3P0 decay couplings produce a mass pattern matching PDG candidates around 3.85-3.95 GeV.

  9. Five-flavor molecular pentaquarks in the $\Xi_b^{(\prime,\,*)} \bar D^{(*)}$ and $\Xi_c^{(\prime,\,*)} B^{(*)}$ systems

    hep-ph 2026-03 unverdicted novelty 5.0 of 10

    One-boson-exchange calculations predict multiple loosely bound five-flavor molecular pentaquarks in Ξb('*)D-bar(*) and Ξc('*)B(*) systems with I=0 and listed J^P quantum numbers.

  10. Decay constants of the two-pole $D_0^*(2300)$

    hep-ph 2026-07 conditional novelty 4.0 of 10

    Molecular two-pole D0*(2300) decay constants are 65 and 81 MeV—much smaller than compact c¯q estimates—and imply Cabibbo-favored b-hadron branching fractions of order 10^{-5}.

  11. $P_{c}(4312)$, $P_{c}(4440)$, and $P_{c}(4457)$ productions in $e^{+} e^{-}$ collisions

    hep-ph 2026-07 conditional novelty 4.0 of 10

    Pc(4312), Pc(4440), and Pc(4457) could be produced in e+e− collisions at tens-of-fb rates, with Pc(4457) dominating and a resolvable double peak near 4.45 GeV in the J/ψp mass spectrum.

  12. Observation of $\psi(3770)\to p\bar p$ and Measurement of Electromagnetic Form Factors of Proton at $\sqrt{s} = 3.510-4.946$ GeV

    hep-ex 2026-06 unverdicted novelty 4.0 of 10

    BESIII observes ψ(3770)→p p-bar at 6.6σ and measures |G_E/G_M| and |G_M| from e+e- → p p-bar cross sections and angular distributions at 47 energies between 3.51 and 4.95 GeV.

  13. Mass spectra and electromagnetic characteristics of the $K^{(*)}\bar D^{(*)}$ and $K^{(*)}{D}^{(*)}$ molecular tetraquarks from the coupled-channel dynamics

    hep-ph 2026-06 unverdicted novelty 4.0 of 10

    Using coupled-channel one-boson-exchange dynamics the authors predict several K(*) bar D(*) and K(*) D(*) molecular tetraquark candidates and their electromagnetic properties.

  14. Prediction of doubly-charm hadronic molecules with double strange quarks

    hep-ph 2026-06 unverdicted novelty 4.0 of 10

    One-boson-exchange model predicts D_s1 bar D_s1, D_s1 bar D_s2* and D_s2* bar D_s2* states as hidden-charm hidden-strangeness molecular tetraquarks plus analogous doubly-charm candidates.

  15. Five-flavor molecular pentaquarks in the $\Xi_b^{(\prime,\,*)} \bar D^{(*)}$ and $\Xi_c^{(\prime,\,*)} B^{(*)}$ systems

    hep-ph 2026-03 unverdicted novelty 4.0 of 10

    The study predicts several five-flavor molecular pentaquarks such as Ξ_b D̄ and Ξ_c B with I(J^P)=0(1/2^-) and related states, showing spin splittings from spin-dependent forces and channel couplings.

  16. Production of high-orbital kaon excited states in the $K^{-}p$ reaction

    hep-ph 2026-06 unverdicted novelty 3.0 of 10

    An effective Lagrangian approach calibrated with one adjustable parameter from data reproduces cross sections for K3*(1780), K2(1820), K2(1770) and K4*(2045) and predicts sizable forward-peaked production for addition...

Pith tools

Reviewed August 2, 2026 · model on record in the stance chip above.