REVIEW 3 major objections 4 minor 32 references
Representing text as abstract images enables image classifiers to also simultaneously classify text
T0 review · 3 major / 4 minor · reviewed 2026-08-14 · deepseek-v4-flash
Pith's one-line read A text-to-pixels map lets image classifiers match names at 99.09% F1
desk verdict The comparison-map encoding is a genuinely new idea, but the reported F1 is not credible as a state-of-the-art claim because the test set was used to tune thresholds and the record-level split leaks inventor identity across train and test. read the letter →
The pith
A machine-rendered reading of the paper's core claim, the machinery that carries it, and where it could break.
The reading
What carries the argument
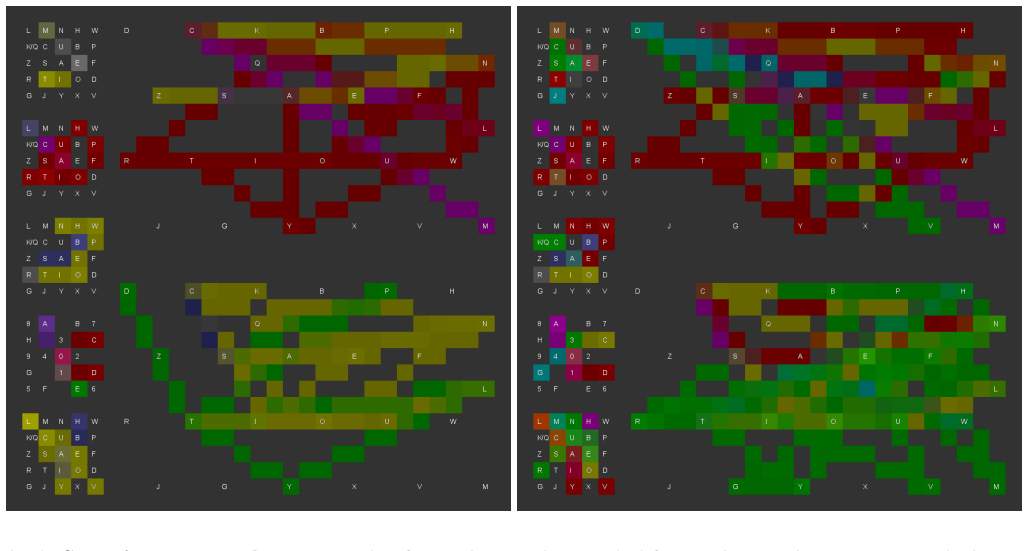
The comparison-map image carries the argument. It is built by producing a string-map for each text field — a 2D grid of letter positions with colored pixels along each letter and along lines connecting the letters of each bigram — then stacking two records' maps as the red and green channels of one RGB tensor, with the first bigram of each record sharing the blue channel. This turns string similarity into spatial overlap: matching text produces yellow, mismatching text produces separate red and green regions. Because the result is a single image, any image classification network can be used; the paper uses a minimally modified AlexNet whose input layer, first-layer kernel size and stride, and output layer are adjusted for 31-by-31-by-3 inputs and two classes.
What would settle it
Take the IS and E&S labeled data, group records by inventor ID, and split so that no inventor appears in both training and test data; then retrain and re-evaluate, tuning the probability and linkage thresholds on a separate validation split. If the F1 falls materially below 99.09%, the headline number is inflated by within-inventor leakage and test-set tuning.
Extended reading notes
Core claim
The central discovery is that a pairwise text comparison can be rendered as a single RGB image, and an off-the-shelf image classifier then performs the text comparison without any text-specific architecture. Each field of an inventor record — first name, middle name, last name, city, IPC codes, co-inventors, assignees — is drawn onto a fixed 2D character grid as colored letter shapes with connecting lines; the two records being compared are placed in the red and green channels of the same image, with the leading two-letter bigram highlighted in blue. Similar records produce large yellow overlap zones, while dissimilar records stay mostly red and green, and the convolutional network picks up these pixel-level cues. On the combined Israeli-inventor and engineer/scientist labeled data, the method reaches F1 99.09%, precision 99.41%, and recall 98.76%, and the authors report that randomizing the character order, the pixel layout, or both changes the F1 only within 98.99% to 99.09%. The discovery, if sound, is that visual pattern recognition can substitute for hand-engineered string similarity in text-pair decisions.
Load-bearing premise
The reported F1 assumes that the random record-level split keeps every inventor's records entirely in either the training set or the test set; if records from the same inventor appear in both, the score partly measures memorization of known individuals rather than generalization to unseen inventors, and the tuning choices are also made on the same test set.
Editorial extensions
If this is right
- Image classification models that already exist can be applied to text-pair classification tasks with minor hyperparameter changes, so gains in image modeling become available for NLP-style matching problems.
- The approach avoids hand-selected string-similarity features; the network learns its own discriminative cues directly from the rendered maps.
- If the central claim holds, the same comparison-map construction should transfer to other pairwise text tasks, such as academic author disambiguation and record linkage, as the paper argues.
- The small performance differences across randomized string-map layouts indicate that the method does not depend on a carefully tuned glyph arrangement.
Reading between the lines
- A natural holdout experiment the paper does not report is splitting the labeled data by inventor rather than by record; comparing F1 under that split would show how much of the 99.09% is generalization to unseen people versus recognition of individuals already seen in training.
- Because the representation is already a tensor, the same stacking trick could be extended to mixed-modal records — for instance, a product image in one channel and its textual description in another — though the paper only demonstrates text-on-text comparisons.
- The layout-robustness result suggests the method may transfer to alphabets or scripts very different from English, but the paper tests only Latin-script names and alphanumeric codes, leaving cross-script behavior open.
Signed reviews
Editorial analysis
A structured set of objections, weighed in public.
Referee Report
Summary. The paper proposes a method for converting text-based records into abstract 2D RGB 'comparison-map' images, allowing a standard image classifier (AlexNet) to perform pairwise match/non-match classification. The method is applied to inventor name disambiguation in USPTO patent data. The authors report an F1 score of 99.09% on the combined IS and E&S labeled datasets, marginally outperforming prior work by Kim et al. (F1 = 99.01%). The paper also tests several alternative string-map layouts and reports F1 scores between 98.99% and 99.09%, suggesting the representation is robust to layout choices.
Significance. If the evaluation were sound, the contribution would be significant: the text-to-image representation is a creative way to reuse mature image-classification architectures for text-based pairwise comparison tasks, enabling end-to-end feature learning without hand-crafted string similarity features. The robustness analysis across randomized string-map layouts is a useful strength, as is the explicit reporting of precision and recall components. However, the central quantitative claim—that the method outperforms the previous state of the art—is compromised by two evaluation-protocol issues: the clustering thresholds are tuned on the test set, and the train/test split is performed at the record level without grouping by inventor, allowing potential identity leakage. These issues must be resolved before the reported F1 can be considered a trustworthy estimate of generalization performance.
major comments (3)
- [V-A and V-C] This is not a minor caveat: the entire quantitative claim, including the marginal advantage over Kim et al. (99.09% vs. 99.01%), depends on parameters that were chosen by looking at the test labels. The magnitude of the resulting bias is unknown but could easily exceed the 0.08 percentage-point difference that the paper highlights.
- [V-A] The paper does not report how many inventors appear in both partitions, nor does it report the number of records per inventor. Without such information, the extent of leakage cannot be assessed. This issue is load-bearing because the primary claim is about the method's ability to disambiguate previously unseen inventor records.
- [Appendix B] This is a secondary consequence of the split issue, but it is worth reporting separately because the authors explicitly use the ceiling to contextualize their recall values.
minor comments (4)
- [Table III] The footnote for the 'Both' rows states that the IS and E&S results for prior work were combined by averaging, while the 'Ours' results appear to come from a single run on a combined dataset. This is not an apples-to-apples comparison; the paper should state explicitly whether the authors' Both result is from a model trained and evaluated on the union of the two datasets or from averaging separate runs, and should ensure consistent aggregation for all methods.
- [V-D] The paper reports that for each alternative string-map, the algorithm was run multiple times with different threshold settings and only the run with the highest F1 is shown. This is another instance of test-set selection, and although it is partly covered by the major comment on threshold selection, the presentation currently reads as if the alternative string-map comparison is a fair robustness check; it would be clearer to report the mean and variance over threshold choices or to use a fixed, pre-specified threshold selection rule.
- [IV-B] The statement that 'we do not use any of those transformations' in DIGITS is ambiguous, because the default settings of the implementation may still apply some preprocessing unless explicitly disabled. Please clarify whether all three default transformations (mean subtraction, random mirroring, random cropping) were fully disabled in the experiments.
- [Abstract and I] The phrase 'simultaneously classify text' in the abstract is likely intended to mean 'classify text using an image classifier,' but it reads as if the network classifies text and images at the same time. Please rephrase to avoid ambiguity, as the actual contribution is about applying an image classifier to text-derived images, not multimodal classification.
Circularity Check
The reported F1 is a test-set-maximized statistic: clustering thresholds are tuned on the same labelled test data used to compute the headline performance.
-
fitted input called prediction
[Section V-A, paragraph on threshold selection before Section V-B]
"Prior to processing the bulk data, we experimented with multiple different values for the pairwise comparison probability threshold ( ¯p) and linking proportion threshold ( ¯l), based on evaluating the trained neural network on the labelled test data. Different ¯p and ¯l values produce different trade-offs between precision and recall, and we use values that produce an optimal trade-off (highest F1 score)."
The paper selects the clustering thresholds p_bar and l_bar by maximizing F1 on the labelled test data, then reports F1 computed on that same test data as the algorithm's performance (e.g., 99.09% in Table III). The reported F1 is therefore the maximum of a grid search over thresholds evaluated on the test set, not an unbiased hold-out estimate. The performance 'prediction' is partly forced by construction: the threshold choice is fitted to the exact metric (F1) on the exact data used for evaluation.
full rationale
The paper's core qualitative contribution—converting text into abstract image representations so that image classifiers can perform text classification—is not itself circular: the representation is defined independently of the match/non-match labels, the network is trained on labelled comparison-maps, and robustness checks across random string-map layouts provide independent evidence that performance does not depend on the specific heuristic layout. There are no load-bearing self-citations: the cited methods (AlexNet, Kim et al., etc.) are external, and no uniqueness or ansatz is imported from the authors' prior work. However, the central quantitative claim is partially circular under the fitted-input-called-prediction pattern. The paper explicitly tunes p_bar and l_bar by maximizing F1 on the same labelled test data that is then used to report F1, so the headline numbers (F1 99.09%, precision 99.41%, recall 98.76%) are maximized over thresholds on the evaluation set. This is compounded by the record-level random split, which can place records of the same inventor in both training and test sets, allowing the CNN to memorize inventor-specific name/address/assignee/co-inventor patterns. These are evaluation-validity problems rather than derivation-identity circularity of the representation method itself, but they directly undermine the paper's main performance prediction. Score 6 reflects partial circularity in the central quantitative claim, while acknowledging that the representation idea retains independent content.
Assumptions & free parameters
free parameters (3)
- p_bar (pairwise match probability threshold) =
0.03 (for best F1 run)
- l_bar (group linking proportion threshold) =
0.05 (for best F1 run)
- n_bar (block size threshold) =
100
assumptions (4)
- domain assumption The IS and E&S labelled datasets provide accurate ground truth for inventor identity.
- domain assumption Blocking by first letters of last name retains nearly all true matches within blocks.
- domain assumption The string-map encoding preserves enough textual information for the CNN to learn match/non-match discrimination.
- domain assumption The 80/20 random split yields test records that are independent of training records.
invented entities (1)
-
Comparison-map image (string-map and record-map)
Cite this review
Pith. "Pith review of Representing text as abstract images enables image classifiers to also simultaneously classify text." pith.science (2026). https://pith.science/paper/BYNSHACT
@misc{pith2026190807846,
  author       = {Pith},
  title        = {Pith review of: Representing text as abstract images enables image classifiers to also simultaneously classify text},
  year         = {2026},
  howpublished = {\url{https://pith.science/paper/BYNSHACT}},
  note         = {Machine review of arXiv:1908.07846}
}
read the original abstract
We introduce a novel method for converting text data into abstract image representations, which allows image-based processing techniques (e.g. image classification networks) to be applied to text-based comparison problems. We apply the technique to entity disambiguation of inventor names in US patents. The method involves converting text from each pairwise comparison between two inventor name records into a 2D RGB (stacked) image representation. We then train an image classification neural network to discriminate between such pairwise comparison images, and use the trained network to label each pair of records as either matched (same inventor) or non-matched (different inventors), obtaining highly accurate results. Our new text-to-image representation method could also be used more broadly for other NLP comparison problems, such as disambiguation of academic publications, or for problems that require simultaneous classification of both text and image datasets.
Figures


Figures from the paper (2 more)

Reference graph
Works this paper leans on
-
[1]
C. Gay, W. Latham, and C. Le Bas, “Collective knowledge, prolific inventors and the value of inventions: An empirical study of French, German and British patents in the US, 1975- 1999,” Economics of Innovation and New Technology , vol. 17, no. 1-2, pp. 5–22, 2008
work page 1975
-
[2]
Does mobility increase the productivity of inven- tors?
K. Hoisl, “Does mobility increase the productivity of inven- tors?” Journal of Technology Transfer, vol. 34, no. 2, pp. 212– 225, 2009
work page 2009
-
[3]
Disambiguation and co-authorship networks of the U.S. patent inventor database (1975-2010),
G. C. Li, R. Lai, A. D’Amour, D. M. Doolin, Y . Sun, V . I. Torvik, A. Z. Yu, and F. Lee, “Disambiguation and co-authorship networks of the U.S. patent inventor database (1975-2010),” Research Policy, vol. 43, no. 6, pp. 941–955,
work page 1975
-
[4]
S. L. Ventura, R. Nugent, and E. R. H. Fuchs, “Seeing the non- stars: (Some) sources of bias in past disambiguation approaches and a new public tool leveraging labeled records,” Research Policy, vol. 44, no. 9, pp. 1672–1701, 2015. [Online]. Available: http://linkinghub.elsevier.com/retrieve/pii/S0048733314002406
work page 2015
-
[5]
Random Forest DBSCAN for USPTO Inventor Name Disambiguation
K. Kim, M. Khabsa, and C. L. Giles, “Random Forest DBSCAN for USPTO Inventor Name Disambiguation,” arXiv:1602.01792, vol. [cs.IR], 2016. [Online]. Available: http://arxiv.org/abs/1602.01792
work page Pith review arXiv 2016
-
[6]
M. Trajtenberg, G. Shiff, and R. Melamed, “The ”Names Game”: Harnessing Inventors’ Patent Data for Economic Re- search,”National Bureau of Economic Research Working Paper, vol. 12479, 2006
work page 2006
-
[7]
Singling Out Individual Inventors from Patent Data,
E. Migu ´elez and I. G ´omez-Migu´elez, “Singling Out Individual Inventors from Patent Data,” Research Institute of Applied Economics Working Paper, 2011
work page 2011
-
[8]
ImageNet Clas- sification with Deep Convolutional Neural Networks,
A. Krizhevsky, I. Sutskever, and G. E. Hinton, “ImageNet Clas- sification with Deep Convolutional Neural Networks,”Advances in Neural Information Processing Systems , vol. 25, pp. 1097– 1105, 2012
work page 2012
Show all 32 references
-
[9]
How to play the
J. Raffo and S. Lhuillery, “How to play the ”Names Game”: Patent retrieval comparing different heuristics,”Research Policy, vol. 38, no. 10, pp. 1617–1627, 2009
2009
-
[10]
How to kill inven- tors: testing the Massacrator algorithm for inventor disambigua- tion,
M. Pezzoni, F. Lissoni, and G. Tarasconi, “How to kill inven- tors: testing the Massacrator algorithm for inventor disambigua- tion,” Scientometrics, vol. 101, no. 1, pp. 477–504, 2014
2014
-
[11]
Binary codes capable of correcting deletions, insertions, and reversals,
V . I. Levenshtein, “Binary codes capable of correcting deletions, insertions, and reversals,”Soviet Physics Doklady, vol. 10, no. 8, pp. 707–710, 1966
1966
-
[12]
Advances in record-linkage methodology as applied to matching the 1985 census of Tampa, Florida,
M. a. Jaro, “Advances in record-linkage methodology as applied to matching the 1985 census of Tampa, Florida,” Journal of the American Statistical Association, vol. 84, no. 406, pp. 414–420, 1989
1985
-
[13]
String Comparator Metrics and Enhanced Decision Rules in the Fellegi-Sunter Model of Record Linkage,
W. E. Winkler, “String Comparator Metrics and Enhanced Decision Rules in the Fellegi-Sunter Model of Record Linkage,” Proceedings of the American Statistical Association Section on Survey Research Methods , 1990. [Online]. Available: http://scholar.google.com/scholar?hl=en&btn...
1990
-
[14]
Disambiguation of patent inventors and assignees using high-resolution geolo- cation data,
G. Morrison, M. Riccaboni, and F. Pammolli, “Disambiguation of patent inventors and assignees using high-resolution geolo- cation data,” Scientific Data, vol. 4, pp. 1–21, 2017
2017
-
[15]
Character-level Convolutional Networks for Text Classification,
X. Zhang, J. Zhao, and Y . LeCun, “Character-level Convolutional Networks for Text Classification,” Advances in Neural Information Processing Systems , pp. 1–9, 2015. [Online]. Available: http://arxiv.org/abs/1502.01710
2015 arXiv
-
[16]
Siamese Neural Networks for One-Shot Image Recognition,
G. Koch, R. Zemel, and R. Salakhutdinov, “Siamese Neural Networks for One-Shot Image Recognition,” Proceedings of the 32nd International Conference on Machine Learning , vol. 37, 2015
2015
-
[17]
Stereo Matching by Training a Convolutional Neural Network to Compare Image Patches,
J. Zbontar and Y . LeCun, “Stereo Matching by Training a Convolutional Neural Network to Compare Image Patches,” Journal of Machine Learning Research, vol. 17, pp. 1–32, 2016
2016
-
[18]
Learning to Compare Image Patches via Convolutional Neural Networks,
S. Zagoruyko and N. Komodakis, “Learning to Compare Image Patches via Convolutional Neural Networks,” IEEE Conference on Computer Vision and Pattern Recognition (CVPR) , 2015
2015
-
[19]
ABCNN: Attention-Based Convolutional Neural Network for Modeling Sentence Pairs,
W. Yin, H. Sch ¨utze, B. Xiang, and B. Zhou, “ABCNN: Attention-Based Convolutional Neural Network for Modeling Sentence Pairs,” Transactions of the Association for Computational Linguistics , vol. 4, pp. 259–272, 2016. [Online]. Available: http://arxiv.org/abs/1512.05193
2016 arXiv
-
[20]
Signature Verifica- tion Using a Siamese Time Delay Neural Network,
J. Bromley, J. W. Bentz, L. Bottou, I. Guyon, Y . Lecun, C. Moore, E. S ¨ackinger, and R. Shah, “Signature Verifica- tion Using a Siamese Time Delay Neural Network,” Interna- tional Journal of Pattern Recognition and Artificial Intelligence, vol. 07, no. 04, pp. 669–688, 1993
1993
-
[21]
Discriminative deep metric learning for face verification in the wild,
J. Hu, J. Lu, and Y . P. Tan, “Discriminative deep metric learning for face verification in the wild,” Proceedings of the IEEE Computer Society Conference on Computer Vision and Pattern Recognition, pp. 1875–1882, 2014
2014
-
[22]
The NBER Patent Citation Data File: Lessons, Insights and Methodological Tools,
B. H. Hall, A. B. Jaffe, and M. Trajtenberg, “The NBER Patent Citation Data File: Lessons, Insights and Methodological Tools,”National Bureau of Economic Research Working Paper , vol. 8498, 2001. [Online]. Available: http: //www.nber.org/papers/w8498.pdf?new window=1
2001
-
[23]
Engineer/scientist careers: Patents, online profiles, and misclassification bias,
C. Ge, K. Huang, and I. P. L. Png, “Engineer/scientist careers: Patents, online profiles, and misclassification bias,” Strategic Management Journal, vol. 37, pp. 232–253, 2016
2016
-
[24]
Caffe: Convolutional Architecture for Fast Feature Embedding,
Y . Jia, E. Shelhamer, J. Donahue, S. Karayev, J. Long, R. Girshick, S. Guadarrama, and T. Darrell, “Caffe: Convolutional Architecture for Fast Feature Embedding,” Proceedings of the 22nd ACM international conference on Multimedia , pp. 675–678, 2014. [Online]. Available: http...
2014 arXiv
-
[25]
A Mixture Record Linkage Approach for US Patent Inven- tor Disambiguation,
G.-C. Yang, C. Liang, Z. Jing, D.-R. Wang, and H.-C. Zhang, “A Mixture Record Linkage Approach for US Patent Inven- tor Disambiguation,” Advanced Multimedia and Ubiquitous Engineering. FutureTech 2017, MUE 2017. Lecture Notes in Electrical Engineering, vol. 448, pp. 331–338, 2...
2017
-
[27]
the number of asserted matches to other records), highest first
Order all patent-inventor name records by the number of links they have to other records (i.e. the number of asserted matches to other records), highest first
-
[28]
Assign a UID to each isolated (non-matched) patent-inventor name
-
[29]
That is, for a given record, the corresponding inventor group initially comprises just the record itself and all records it is linked (matched) to
Assign records to inventor groups. That is, for a given record, the corresponding inventor group initially comprises just the record itself and all records it is linked (matched) to. Each of these linked records (nodes) are kept in the current inventor group only if the number...
-
[30]
Repeat Step 2, because some records may have become isolated (non-matched) following Step 3
-
[31]
Combine inventor groups together if the number of links they share is greater than a specified threshold. In particular, for an inventor group with nself records (nodes), we combine it with any other group with nother nodes if the number of links to that other group ( l) satisfi...
-
[32]
For each resulting inventor group, assign an identi- cal UID to all patent-inventor name records in the group. D. Random string-map layouts Here we show the random string layouts analysed in Section V-D. Figure A1 shows the string-maps we use for runs where characters are posi...
-
[2014]
Available: http://dx.doi.org/10.1016/j.respol
[Online]. Available: http://dx.doi.org/10.1016/j.respol. 2014.01.012
2014 doi
Reviewed August 14, 2026 · model on record in the stance chip above.
Discussion (0). Continue with ORCID to comment.