InterChart: Benchmarking Visual Reasoning Across Decomposed and Distributed Chart Information
Pith reviewed 2026-05-19 00:19 UTC · model grok-4.3
The pith
Vision-language models lose accuracy when reasoning must span multiple related charts instead of single ones.
A machine-rendered reading of the paper's core claim, the machinery that carries it, and where it could break.
Core claim
InterChart shows that state-of-the-art vision-language models display consistent and steep accuracy declines as chart complexity rises from factual questions on single charts to integrative analysis on synthetically aligned sets and then to semantic inference on real-world chart pairs. The models improve when multi-entity charts are first decomposed into simpler visual units, revealing their difficulty with cross-chart integration.
What carries the argument
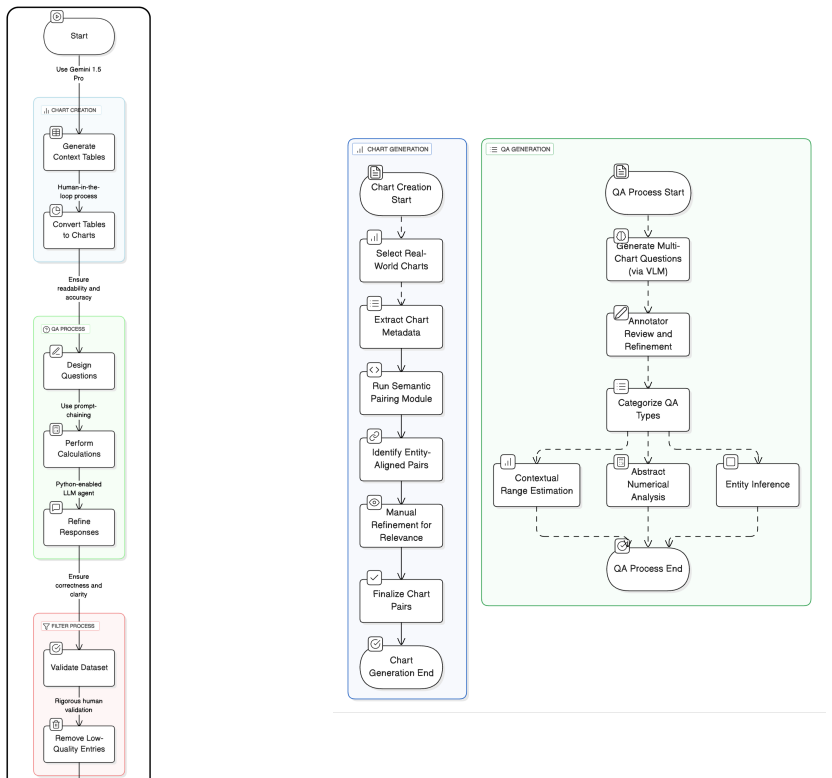
The InterChart benchmark and its three-tier structure that progresses from single-chart facts through synthetic alignments to real multi-chart semantic questions.
If this is right
- Current vision-language models remain limited for practical tasks that require combining data from several charts at once.
- Decomposing complex charts into smaller visual units offers a practical way to boost performance on existing models.
- Training or architectural changes focused on cross-chart linking will be necessary to close the observed gaps.
- Benchmarks that isolate integration failures can guide targeted improvements in multimodal systems.
Where Pith is reading between the lines
- Similar integration weaknesses may appear in other settings that present multiple images or diagrams together, such as medical reports or engineering schematics.
- Extending the benchmark to four or more charts could expose additional scaling problems not yet measured.
- Techniques that automatically decompose visuals might become a standard preprocessing step for chart-related AI tools.
Load-bearing premise
The benchmark's question types, synthetic alignments, and real-world chart pairs accurately represent real-world multi-chart reasoning demands without systematic biases in how questions are written or charts are selected.
What would settle it
A new test set of matched single-chart and multi-chart questions on which the same models show no accuracy drop with added charts, or gain nothing from decomposition, would falsify the central claim.
Figures


read the original abstract
We introduce InterChart, a diagnostic benchmark that evaluates how well vision-language models (VLMs) reason across multiple related charts, a task central to real-world applications such as scientific reporting, financial analysis, and public policy dashboards. Unlike prior benchmarks focusing on isolated, visually uniform charts, InterChart challenges models with diverse question types ranging from entity inference and trend correlation to numerical estimation and abstract multi-step reasoning grounded in 2-3 thematically or structurally related charts. We organize the benchmark into three tiers of increasing difficulty: (1) factual reasoning over individual charts, (2) integrative analysis across synthetically aligned chart sets, and (3) semantic inference over visually complex, real-world chart pairs. Our evaluation of state-of-the-art open- and closed-source VLMs reveals consistent and steep accuracy declines as chart complexity increases. We find that models perform better when we decompose multi-entity charts into simpler visual units, underscoring their struggles with cross-chart integration. By exposing these systematic limitations, InterChart provides a rigorous framework for advancing multimodal reasoning in complex, multi-visual environments.
Editorial analysis
A structured set of objections, weighed in public.
Referee Report
Summary. The paper introduces InterChart, a diagnostic benchmark for vision-language models to reason across multiple related charts in real-world applications such as scientific reporting and financial analysis. It organizes the benchmark into three tiers of increasing difficulty—factual reasoning on individual charts, integrative analysis on synthetically aligned chart sets, and semantic inference on real-world chart pairs—and evaluates state-of-the-art open- and closed-source VLMs, reporting consistent accuracy declines with rising complexity and improved performance when multi-entity charts are decomposed into simpler visual units.
Significance. If the empirical findings are robust, the benchmark fills a gap in multimodal evaluation by focusing on distributed visual information rather than isolated charts, providing a framework to diagnose and improve VLM limitations in cross-chart integration tasks that are practically relevant.
major comments (2)
- The central claim that accuracy declines reflect struggles with cross-chart integration (rather than general question difficulty) rests on the three tiers isolating integration demands, but the tier descriptions do not specify controls for confounding factors such as number of inference steps, length of numerical operations, or linguistic ambiguity across tiers; this is load-bearing for interpreting the observed declines as integration-specific failures.
- The abstract and evaluation sections report accuracy declines and decomposition benefits without providing quantitative results, error bars, dataset sizes, or exclusion criteria, leaving the strength of the central empirical claims only partially supported.
minor comments (2)
- Clarify the exact number of charts, questions, and models evaluated, along with any statistical tests used to support claims of 'consistent and steep' declines.
- Ensure figures showing model performance across tiers include clear legends, axis labels, and error indicators for readability.
Simulated Author's Rebuttal
We thank the referee for their constructive comments, which help clarify the interpretability of our tiered design and ensure the empirical results are presented with full quantitative support. We respond to each major comment below and describe the planned revisions.
read point-by-point responses
-
Referee: The central claim that accuracy declines reflect struggles with cross-chart integration (rather than general question difficulty) rests on the three tiers isolating integration demands, but the tier descriptions do not specify controls for confounding factors such as number of inference steps, length of numerical operations, or linguistic ambiguity across tiers; this is load-bearing for interpreting the observed declines as integration-specific failures.
Authors: We agree that explicit controls for these factors are necessary to isolate integration demands as the primary driver of performance drops. The current manuscript describes the progressive introduction of multi-chart reasoning but does not provide quantitative matching across tiers for inference steps, numerical operations, or linguistic features. In the revision we will add a dedicated subsection under Benchmark Construction that reports these statistics (e.g., average reasoning steps per question, counts of arithmetic operations, and automated plus manual checks for linguistic complexity) and explains how questions were balanced during curation. This addition will directly support the claim that the observed declines are integration-specific. revision: yes
-
Referee: The abstract and evaluation sections report accuracy declines and decomposition benefits without providing quantitative results, error bars, dataset sizes, or exclusion criteria, leaving the strength of the central empirical claims only partially supported.
Authors: We acknowledge the need for these details to make the empirical claims fully transparent. While the evaluation section contains accuracy numbers for the tested VLMs, the abstract is high-level and error bars, precise dataset sizes, and exclusion criteria are not explicitly stated. We will revise the abstract to include key quantitative results (accuracy drops from Tier 1 to Tier 3 and decomposition gains) and expand the evaluation section with error bars computed over multiple prompt variations, exact counts of charts and questions per tier, and a clear statement of any exclusion criteria applied during data collection. These changes will be incorporated in the next version. revision: yes
Circularity Check
Empirical benchmark evaluation with no derivation chain or self-referential reductions
full rationale
The paper presents InterChart as a diagnostic benchmark for VLM multi-chart reasoning, organized into factual, integrative, and real-world tiers, with direct empirical accuracy measurements on open- and closed-source models. No equations, fitted parameters, uniqueness theorems, or ansatzes are claimed or derived; the central observations (accuracy declines with complexity, gains from decomposition) are straightforward test outcomes on the introduced dataset. The work is self-contained against external benchmarks, with no load-bearing self-citations or reductions of predictions to inputs by construction.
Axiom & Free-Parameter Ledger
Lean theorems connected to this paper
-
IndisputableMonolith/Foundation/AbsoluteFloorClosure.leanreality_from_one_distinction unclear?
unclearRelation between the paper passage and the cited Recognition theorem.
We organize the benchmark into three tiers of increasing difficulty: (1) factual reasoning over individual charts, (2) integrative analysis across synthetically aligned chart sets, and (3) semantic inference over visually complex, real-world chart pairs.
What do these tags mean?
- matches
- The paper's claim is directly supported by a theorem in the formal canon.
- supports
- The theorem supports part of the paper's argument, but the paper may add assumptions or extra steps.
- extends
- The paper goes beyond the formal theorem; the theorem is a base layer rather than the whole result.
- uses
- The paper appears to rely on the theorem as machinery.
- contradicts
- The paper's claim conflicts with a theorem or certificate in the canon.
- unclear
- Pith found a possible connection, but the passage is too broad, indirect, or ambiguous to say the theorem truly supports the claim.
Reference graph
Works this paper leans on
-
[1]
Phi-4 technical report. Technical Report arXiv:2412.08905, Microsoft Research. V1. Zhe Chen, Jiannan Wu, Wenhai Wang, Weijie Su, Guo Chen, Sen Xing, Muyan Zhong, Qinglong Zhang, Xizhou Zhu, Lewei Lu, and 1 others
work page internal anchor Pith review Pith/arXiv arXiv
-
[2]
InPattern Recognition, pages 297–315
Chart-info 2024: A dataset for chart analysis and recognition. InPattern Recognition, pages 297–315. Springer Nature Switzerland. Kenny Davila, Rupak Lazarus, Fei Xu, Nicole Ro- dríguez Alcántara, Srirangaraj Setlur, Venu Govin- daraju, Ajoy Mondal, and CV Jawahar
work page 2024
-
[3]
InInternational Conference on Pattern Recog- nition, pages 297–315
Chart- info 2024: A dataset for chart analysis and recogni- tion. InInternational Conference on Pattern Recog- nition, pages 297–315. Springer. Zhenyun Deng, Yonghua Zhu, Qianqian Qi, Michael Witbrock, and Patricia Riddle
work page 2024
-
[4]
Explicit graph reasoning fusing knowledge and contextual infor- mation for multi-hop question answering. InPro- ceedings of the 2nd Workshop on Deep Learning on Graphs for Natural Language Processing (DLG4NLP 2022), pages 71–80, Seattle, Washington. Associa- tion for Computational Linguistics. Yucheng Han, Chi Zhang, Xin Chen, Xu Yang, Zhibin Wang, Gang Y...
work page 2022
-
[5]
Chartllama: A multimodal llm for chart understanding and generation.arXiv preprint arXiv:2311.16483. Shengding Hu, Yuge Tu, Xu Han, Chaoqun He, Ganqu Cui, Xiang Long, Zhi Zheng, Yewei Fang, Yuxiang Huang, Weilin Zhao, Xinrong Zhang, Zheng Leng Thai, Kaihuo Zhang, Chongyi Wang, Yuan Yao, Chenyang Zhao, Jie Zhou, Jie Cai, Zhongwu Zhai, and 6 others
-
[6]
MiniCPM: Unveiling the Potential of Small Language Models with Scalable Training Strategies
Minicpm: Unveiling the poten- tial of small language models with scalable training strategies.arXiv preprint arXiv:2404.06395. Bowen Jin, Chulin Xie, Jiawei Zhang, Kashob Ku- mar Roy, Yu Zhang, Zheng Li, Ruirui Tang, Suhang Wang, Yu Meng, and Jiawei Han
work page internal anchor Pith review Pith/arXiv arXiv
-
[7]
Graph chain- of-thought: Augmenting large language models by reasoning on graphs. InFindings of the Associa- tion for Computational Linguistics: ACL 2024, pages 163–184, Bangkok, Thailand. Association for Com- putational Linguistics. 9 Kushal Kafle, Brian Price, Scott Cohen, and Christo- pher Kanan
work page 2024
-
[8]
FigureQA: An Annotated Figure Dataset for Visual Reasoning
Figureqa: An annotated fig- ure dataset for visual reasoning.arXiv preprint arXiv:1710.07300. Shankar Kantharaj, Rixie Tiffany Leong, Xiang Lin, Ahmed Masry, Megh Thakkar, Enamul Hoque, and Shafiq Joty
work page internal anchor Pith review Pith/arXiv arXiv
-
[9]
Shengzhi Li and Nima Tajbakhsh
Building and better understand- ing vision-language models: insights and future di- rections.arXiv preprint arXiv:2408.12637. Shengzhi Li and Nima Tajbakhsh
-
[10]
Scigraphqa: A large-scale synthetic multi-turn question-answering dataset for scientific graphs.arXiv preprint arXiv:2310.04949. Fangyu Liu, Julian Eisenschlos, Francesco Piccinno, Syrine Krichene, Chenxi Pang, Kenton Lee, Man- dar Joshi, Wenhu Chen, Nigel Collier, and Yasemin Altun
-
[11]
Deplot: One-shot visual language rea- soning by plot-to-table translation. InFindings of the Association for Computational Linguistics: ACL 2023, pages 10381–10399, Toronto, Canada. Associ- ation for Computational Linguistics. Ahmed Masry, Do Xuan Long, Jia Qing Tan, Shafiq Joty, and Enamul Hoque
work page 2023
-
[12]
ChartQA: A Benchmark for Question Answering about Charts with Visual and Logical Reasoning
Chartqa: A benchmark for question answering about charts with visual and logical reasoning.arXiv preprint arXiv:2203.10244. Nitesh Methani, Pritha Ganguly, Mitesh M Khapra, and Pratyush Kumar
work page internal anchor Pith review Pith/arXiv arXiv
-
[13]
Gemini 1.5: Unlocking multi- modal understanding across millions of tokens of context.arXiv preprint arXiv:2403.05530. An Yang, Baosong Yang, Binyuan Hui, Bo Zheng, Bowen Yu, Chang Zhou, Chengpeng Li, Chengyuan Li, Dayiheng Liu, Fei Huang, Guanting Dong, Hao- ran Wei, Huan Lin, Jialong Tang, Jialin Wang, Jian Yang, Jianhong Tu, Jianwei Zhang, Jianxin Ma, ...
work page internal anchor Pith review Pith/arXiv arXiv
-
[14]
MultiChartQA: Benchmarking vision-language models on multi-chart problems. In Proceedings of the 2025 Conference of the Nations of the Americas Chapter of the Association for Com- putational Linguistics: Human Language Technolo- gies (V olume 1: Long Papers), pages 11341–11359, Albuquerque, New Mexico. Association for Compu- tational Linguistics. 10 Appen...
work page 2025
-
[15]
• GPT-4o-mini: Parameter size not publicly disclosed
31: ifselect_colis Numerical and not in Con- ditionsthen 32:Apply ORDER BY with ASC/DESC 33:end if 34:end while 35:Filter by Human▷Ensuring Logical Consistency and Quality 36:returnS 14 Algorithm 2Synthetic Simulation - Multi-Chart Reasoning with LLM-Generated Contexts 1: Input:LLM Model MLLM, Human Annota- torsA, Chart GeneratorG chart 2: Output:Dataset ...
work page 2023
discussion (0)
Sign in with ORCID, Apple, or X to comment. Anyone can read and Pith papers without signing in.