Recognition: unknown
Optical Variability Structure Function of Low-Luminosity AGN using ATLAS Lightcurves
Pith reviewed 2026-05-07 15:33 UTC · model grok-4.3
The pith
The slope of optical variability in low-luminosity AGN increases with black hole mass.
A machine-rendered reading of the paper's core claim, the machinery that carries it, and where it could break.
Core claim
We characterise the ensemble variability structure function of low-luminosity AGN at z < 0.1 and find that its slope depends on black hole mass, increasing from ∼0.1 at log M_BH/M_⊙ ∼6.5 to ∼0.3 at log M_BH/M_⊙ ∼8. Contrary to some earlier work, we do not find breaks in the SF, and two-epoch spectra taken 20 years apart suggest that the SF keeps rising into decadal timescales. In addition, we measure an anticorrelation of the amplitude with the luminosity and a positive correlation with the black hole mass. The variability behaviour also suggests that extinction is not the main driver of the variety in Seyfert subtypes.
What carries the argument
The ensemble structure function of the optical lightcurves, which tracks how variability amplitude grows with time separation and is compared across bins of black hole mass and luminosity after host-AGN decomposition.
Load-bearing premise
The host-AGN decomposition on recent spectra accurately isolates the variable AGN flux from the constant host galaxy contribution without introducing systematic biases.
What would settle it
A larger sample or longer baseline that shows either a clear break in the structure function at some timescale or no dependence of slope on black hole mass.
Figures



read the original abstract
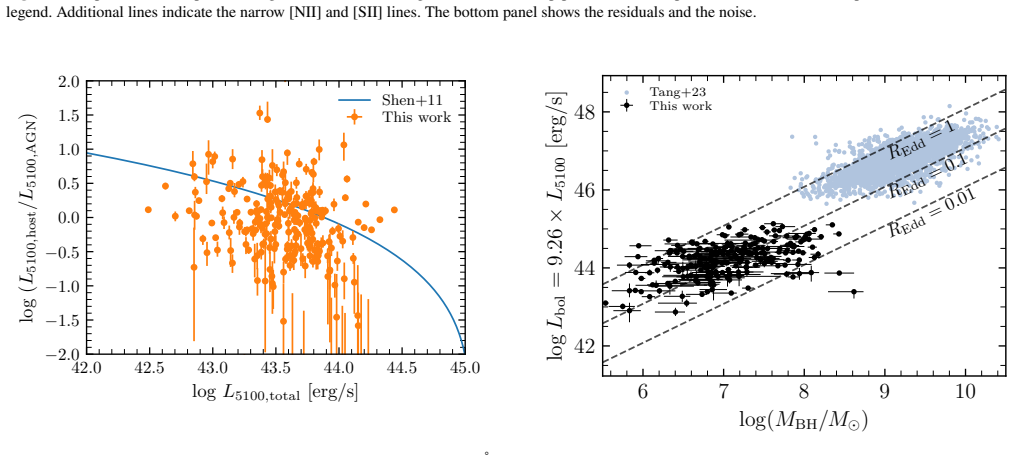
The origin of the optical flux variability in active galactic nuclei (AGN) is largely unknown. Previous studies have correlated features of the variability structure function (SF) with AGN properties, though they mostly involved high-luminosity AGN to avoid biases from host galaxy flux. In this work, we characterise optical variability in a sample of 246 low-luminosity AGN at $z < 0.1$ from the Six-degree Field Galaxy Survey (6dFGS) through the ensemble variability SF. We use lightcurves from the Asteroid Terrestrial-impact Last Alert System (ATLAS) with a cadence of $\sim$2 days over eight years, and perform host-AGN decomposition on recent spectra to obtain the host fraction. We find that the slope of the SF depends on black hole mass, increasing from $\sim 0.1$ at $\log M_{\mathrm{BH}}/M_\odot \sim 6.5$ to $\sim 0.3$ at $\log M_{\mathrm{BH}}/M_\odot \sim 8$. Contrary to some earlier work, We do not find breaks in the SF, and two-epoch spectra taken 20 years apart suggest that the SF keeps rising into decadal timescales. In addition, we measure an anticorrelation of the amplitude with the luminosity and a positive correlation with the black hole mass. The variability behaviour also suggests that extinction is not the main driver of the variety in Seyfert subtypes.
Editorial analysis
A structured set of objections, weighed in public.
Referee Report
Summary. The manuscript analyzes the ensemble structure function (SF) of optical variability in 246 low-luminosity AGN at z < 0.1 from the 6dFGS survey, utilizing ATLAS light curves with approximately 2-day cadence over 8 years. Host-AGN decomposition is performed on recent spectra to isolate the AGN contribution. Key findings include a black hole mass-dependent SF slope increasing from ~0.1 at log(M_BH/M_⊙) ~6.5 to ~0.3 at ~8, absence of breaks in the SF with evidence for continued rise on decadal timescales from two-epoch spectra, an anticorrelation of SF amplitude with luminosity, and a positive correlation with black hole mass. The variability is also interpreted as indicating that extinction is not the primary cause of differences in Seyfert subtypes.
Significance. If the reported trends are robust, this work fills an important gap by characterizing variability in the dominant low-luminosity AGN population, which has been understudied due to host contamination. The mass-dependent SF slope, lack of breaks, and extension to decadal timescales provide empirical constraints on accretion disk models and the origin of optical variability. The large sample and long baseline from ATLAS are strengths, offering better statistics than many prior studies focused on high-luminosity objects.
major comments (2)
- The host-AGN spectral decomposition (described in the methods section following sample selection): All central claims—the M_BH-dependent SF slope rising from ~0.1 to ~0.3, amplitude correlations with luminosity and M_BH, and absence of breaks—depend on accurate isolation of the variable AGN flux after subtracting the constant host contribution. The manuscript reports the decomposition procedure but provides no Monte Carlo validation on simulated spectra with known AGN/host ratios, nor cross-checks against independent photometric host fractions from imaging data. In this z < 0.1, low-luminosity regime where host light typically dominates, unquantified systematics that correlate with luminosity or M_BH would directly bias the ensemble SF measurements and derived trends.
- Results section (trends with M_BH and luminosity): The reported SF slopes and correlations lack quoted uncertainties, formal statistical tests (e.g., Spearman coefficients with p-values or bootstrap errors), and details on binning or sample sizes per M_BH bin. Without these, the quantitative claim that the slope increases from ~0.1 at log M_BH/M_⊙ ~6.5 to ~0.3 at ~8 cannot be fully assessed for robustness against sample variance or selection effects.
minor comments (3)
- Abstract: The sentence beginning 'Contrary to some earlier work, We do not find breaks' contains an erroneous capital 'W' in 'We'.
- Notation consistency: Black hole mass is written variously as log M_BH/M_⊙ and log(M_BH/M_⊙); adopt a single convention throughout, including in figure labels.
- Figure captions (variability plots): Captions should explicitly state the number of objects per bin, how errors on the ensemble SF are computed, and whether the plotted points include the host-subtracted AGN flux only.
Simulated Author's Rebuttal
We thank the referee for their constructive comments and positive assessment of the work's significance. We address each major comment below and will incorporate revisions to strengthen the manuscript.
read point-by-point responses
-
Referee: The host-AGN spectral decomposition (described in the methods section following sample selection): All central claims—the M_BH-dependent SF slope rising from ~0.1 to ~0.3, amplitude correlations with luminosity and M_BH, and absence of breaks—depend on accurate isolation of the variable AGN flux after subtracting the constant host contribution. The manuscript reports the decomposition procedure but provides no Monte Carlo validation on simulated spectra with known AGN/host ratios, nor cross-checks against independent photometric host fractions from imaging data. In this z < 0.1, low-luminosity regime where host light typically dominates, unquantified systematics that correlate with luminosity or M_BH would directly bias the ensemble SF measurements and derived trends.
Authors: We agree that additional validation of the host-AGN decomposition is important to quantify potential systematics in this low-luminosity regime. In the revised manuscript, we will include Monte Carlo simulations on synthetic spectra with known AGN/host flux ratios to assess uncertainties and check for biases correlated with luminosity or black hole mass. We will also perform cross-checks against photometric host fractions from available imaging data for a subset of objects where such data exist. revision: yes
-
Referee: Results section (trends with M_BH and luminosity): The reported SF slopes and correlations lack quoted uncertainties, formal statistical tests (e.g., Spearman coefficients with p-values or bootstrap errors), and details on binning or sample sizes per M_BH bin. Without these, the quantitative claim that the slope increases from ~0.1 at log M_BH/M_⊙ ~6.5 to ~0.3 at ~8 cannot be fully assessed for robustness against sample variance or selection effects.
Authors: We acknowledge that the statistical robustness of the reported trends can be better quantified. In the revised manuscript, we will add bootstrap-derived uncertainties on the SF slopes and amplitudes, include formal Spearman rank correlation coefficients with p-values for the trends with M_BH and luminosity, and provide explicit details on the binning procedure along with the number of objects per M_BH bin to allow assessment against sample variance. revision: yes
Circularity Check
No circularity: purely empirical measurements from data
full rationale
The paper reports direct statistical measurements of the ensemble structure function (SF) slope, amplitude, and lack of breaks from ATLAS lightcurves of 246 low-luminosity AGN, after subtracting host fractions derived from spectra. No equations, ansatzes, or derivations are present that could be self-referential or reduce claims to inputs by construction. Reported trends (SF slope increasing with M_BH, amplitude anticorrelating with luminosity) are observational results, not predictions or fitted quantities renamed as such. Self-citations, if any, are not load-bearing for any uniqueness theorem or central premise. The analysis is self-contained against external benchmarks with no circular steps.
Axiom & Free-Parameter Ledger
Reference graph
Works this paper leans on
-
[1]
C., Varoquaux G., 2011, @doi [Computing in Science Engineering] 10.1109/MCSE.2011.37 , 13, 22
The NumPy Array: A Structure for Efficient Numerical Computation. Computing in Science and Engineering , keywords =. doi:10.1109/MCSE.2011.37 , archivePrefix =. 1102.1523 , primaryClass =
-
[2]
Computing in Science & Engineering9(3), 90–95 (2007) https://doi.org/10.1109/MCSE.2007.55
Matplotlib: A 2D Graphics Environment. Computing in Science and Engineering , keywords =. doi:10.1109/MCSE.2007.55 , adsurl =
-
[3]
The 6dF Galaxy Survey: samples, observational techniques and the first data release. , keywords =. doi:10.1111/j.1365-2966.2004.08353.x , archivePrefix =. astro-ph/0403501 , primaryClass =
-
[4]
The 6dF Galaxy Survey: final redshift release (DR3) and southern large-scale structures. , keywords =. doi:10.1111/j.1365-2966.2009.15338.x , archivePrefix =. 0903.5451 , primaryClass =
-
[5]
ATLAS: A High-cadence All-sky Survey System. , keywords =. doi:10.1088/1538-3873/aabadf , archivePrefix =. 1802.00879 , primaryClass =
-
[6]
SkyMapper Southern Survey: First Data Release (DR1). , keywords =. doi:10.1017/pasa.2018.5 , archivePrefix =. 1801.07834 , primaryClass =
-
[7]
Unified models for active galactic nuclei and quasars. , keywords =. doi:10.1146/annurev.aa.31.090193.002353 , adsurl =
-
[9]
, keywords =
Complete catalogue of AGN in 6dFGS OR SIMILAR. , keywords =. doi:10.xx/xxx , archivePrefix =. astro-ph/xxx , primaryClass =
-
[10]
2007, Ap&SS, 310, 255, doi: 10.1007/s10509-007-9510-z
The Wide Field Spectrograph (WiFeS). , keywords =. doi:10.1007/s10509-007-9510-z , archivePrefix =. 0705.0287 , primaryClass =
-
[11]
2010, Ap&SS, 327, 245, doi: 10.1007/s10509-010-0335-9
The Wide Field Spectrograph (WiFeS): performance and data reduction. , keywords =. doi:10.1007/s10509-010-0335-9 , archivePrefix =. 1002.4472 , primaryClass =
-
[12]
PyWiFeS: a rapid data reduction pipeline for the Wide Field Spectrograph (WiFeS). , keywords =. doi:10.1007/s10509-013-1682-0 , archivePrefix =. 1311.2666 , primaryClass =
-
[14]
2022, Changing-look Active Galactic Nuclei, doi: 10.48550/ARXIV.2211.05132
Changing-look Active Galactic Nuclei. arXiv e-prints , keywords =. doi:10.48550/arXiv.2211.05132 , archivePrefix =. 2211.05132 , primaryClass =
-
[15]
BAT AGN Spectroscopic Survey. I. Spectral Measurements, Derived Quantities, and AGN Demographics. , keywords =. doi:10.3847/1538-4357/aa8ec9 , archivePrefix =. 1707.08123 , primaryClass =
-
[16]
BAT AGN Spectroscopic Survey. V. X-Ray Properties of the Swift/BAT 70-month AGN Catalog. , keywords =. doi:10.3847/1538-4365/aa96ad , archivePrefix =. 1709.03989 , primaryClass =
-
[17]
, year = 1976, month = dec, volume =
Variation of the spectrum of the Seyfert galaxy NGC 7603. , year = 1976, month = dec, volume =. doi:10.1086/182317 , adsurl =
-
[18]
The Man behind the Curtain: X-Rays Drive the UV through NIR Variability in the 2013 Active Galactic Nucleus Outburst in NGC 2617. , keywords =. doi:10.1088/0004-637X/788/1/48 , archivePrefix =. 1310.2241 , primaryClass =
-
[19]
The Typecasting of Active Galactic Nuclei: Mrk 590 no Longer Fits the Role. , keywords =. doi:10.1088/0004-637X/796/2/134 , archivePrefix =. 1404.4879 , primaryClass =
-
[20]
Changing-look Quasar Candidates: First Results from Follow-up Spectroscopy of Highly Optically Variable Quasars. , keywords =. doi:10.3847/1538-4357/ab05e2 , archivePrefix =. 1810.00087 , primaryClass =
-
[21]
A systematic search for changing-look quasars in SDSS. , keywords =. doi:10.1093/mnras/stv2997 , archivePrefix =. 1509.08393 , primaryClass =
-
[22]
SkyMapper colours of Seyfert galaxies and Changing-Look AGN. , keywords =. doi:10.1093/mnras/staa2794 , archivePrefix =. 2009.04688 , primaryClass =
-
[23]
The Time Domain Spectroscopic Survey: Changing-look Quasar Candidates from Multi-epoch Spectroscopy in SDSS-IV. , keywords =. doi:10.3847/1538-4357/ac743f , archivePrefix =. 2201.09123 , primaryClass =
-
[24]
The Discovery of the First Changing Look Quasar: New Insights Into the Physics and Phenomenology of Active Galactic Nucleus. , keywords =. doi:10.1088/0004-637X/800/2/144 , archivePrefix =. 1412.2136 , primaryClass =
-
[25]
Discovery of 21 New Changing-look AGNs in the Northern Sky. , keywords =. doi:10.3847/1538-4357/aaca3a , archivePrefix =. 1711.08122 , primaryClass =
-
[26]
Understanding extreme quasar optical variability with CRTS - II. Changing-state quasars. , keywords =. doi:10.1093/mnras/stz3244 , archivePrefix =. 1905.02262 , primaryClass =
-
[27]
BASS XXXIX: Swift-BAT AGN with changing-look optical spectra. , keywords =. doi:10.1093/mnras/stac3279 , archivePrefix =. 2211.04478 , primaryClass =
-
[28]
A Transient ``Changing-look'' Active Galactic Nucleus Resolved on Month Timescales from First-year Sloan Digital Sky Survey V Data. , keywords =. doi:10.3847/2041-8213/ac9a47 , archivePrefix =. 2210.07258 , primaryClass =
-
[29]
Changing-look Active Galactic Nuclei from the Dark Energy Spectroscopic Instrument. I. Sample from the Early Data. , keywords =. doi:10.3847/1538-4365/ad118a , archivePrefix =. 2307.08289 , primaryClass =
-
[30]
Changing-look Active Galactic Nuclei from the Dark Energy Spectroscopic Instrument. II. Statistical Properties from the First Data Release. arXiv e-prints , keywords =. doi:10.48550/arXiv.2408.00402 , archivePrefix =. 2408.00402 , primaryClass =
-
[31]
Confirming new changing-look AGNs discovered through optical variability using a random forest-based light-curve classifier. , keywords =. doi:10.1093/mnrasl/slac033 , archivePrefix =. 2203.15040 , primaryClass =
-
[32]
Polarization of the changing-look quasar J1011+5442. , keywords =. doi:10.1051/0004-6361/201731397 , archivePrefix =. 1707.05540 , primaryClass =
-
[33]
Mid-infrared Variability of Changing-look AGNs. , keywords =. doi:10.3847/2041-8213/aa85de , archivePrefix =. 1707.02686 , primaryClass =
-
[35]
Variability studies of Seyfert galaxies - II. Spectroscopy. , keywords =. doi:10.1093/mnras/257.4.677 , adsurl =
-
[36]
SpectRes: A Fast Spectral Resampling Tool in Python
SpectRes: A Fast Spectral Resampling Tool in Python. arXiv e-prints , keywords =. doi:10.48550/arXiv.1705.05165 , archivePrefix =. 1705.05165 , primaryClass =
-
[37]
Evidence for Large Temperature Fluctuations in Quasar Accretion Disks from Spectral Variability. , keywords =. doi:10.1088/0004-637X/783/2/105 , archivePrefix =. 1401.1211 , primaryClass =
-
[39]
2007, MNRAS, 378, 910, doi: 10.1111/j.1365-2966.2007.11817.x
On the variability of quasars: a link between the Eddington ratio and optical variability?. , keywords =. doi:10.1111/j.1365-2966.2007.12655.x , archivePrefix =. 0711.4844 , primaryClass =
-
[41]
Long-term optical variability properties of the Palomar-Green quasars. , keywords =. doi:10.1046/j.1365-8711.1999.02556.x , archivePrefix =. astro-ph/9902254 , primaryClass =
-
[42]
Observational appearance
Black holes in binary systems. Observational appearance. , year = 1973, month = jan, volume =
1973
-
[43]
Hidden Broad-Line Seyfert 2 Galaxies in the CFA and 12 M Samples. , keywords =. doi:10.1086/320926 , archivePrefix =. astro-ph/0105462 , primaryClass =
-
[44]
The Unified Model and Evolution of Active Galaxies: Implications from a Spectropolarimetric Study. , keywords =. doi:10.1086/345473 , archivePrefix =. astro-ph/0210262 , primaryClass =
-
[45]
The host galaxies of active galactic nuclei. , keywords =. doi:10.1111/j.1365-2966.2003.07154.x , archivePrefix =. astro-ph/0304239 , primaryClass =
-
[46]
Space Density of Optically Selected Type 2 Quasars. , keywords =. doi:10.1088/0004-6256/136/6/2373 , archivePrefix =. 0801.1115 , primaryClass =
-
[47]
Broad H Emission-line Variability in a Sample of 102 Local Active Galaxies. , keywords =. doi:10.3847/0004-637X/821/1/33 , archivePrefix =. 1603.00035 , primaryClass =
-
[48]
The Destruction and Recreation of the X-Ray Corona in a Changing-look Active Galactic Nucleus. , keywords =. doi:10.3847/2041-8213/ab91a1 , archivePrefix =. 2007.07275 , primaryClass =
-
[49]
A tidal disruption flare in a massive galaxy? Implications for the fuelling mechanisms of nuclear black holes. , keywords =. doi:10.1093/mnras/stv1095 , archivePrefix =. 1503.04870 , primaryClass =
-
[50]
Now you see it, now you don't: the disappearing central engine of the quasar J1011+5442. , keywords =. doi:10.1093/mnras/stv2385 , archivePrefix =. 1509.03640 , primaryClass =
-
[51]
On the Bardeen-Petterson effect in black hole accretion discs. , keywords =. doi:10.1093/mnras/stv014 , archivePrefix =. 1501.01687 , primaryClass =
-
[52]
Nozzle Shocks, Disk Tearing, and Streamers Drive Rapid Accretion in 3D GRMHD Simulations of Warped Thin Disks. , keywords =. doi:10.3847/1538-4357/ace051 , archivePrefix =. 2210.10053 , primaryClass =
-
[53]
SDSS-V: Pioneering Panoptic Spectroscopy
SDSS-V: Pioneering Panoptic Spectroscopy. arXiv e-prints , keywords =. doi:10.48550/arXiv.1711.03234 , archivePrefix =. 1711.03234 , primaryClass =
-
[54]
LSST: From Science Drivers to Reference Design and Anticipated Data Products. , keywords =. doi:10.3847/1538-4357/ab042c , archivePrefix =. 0805.2366 , primaryClass =
-
[55]
Insights from the VVDS and VIPERS surveys
The Type II AGN-host galaxy connection. Insights from the VVDS and VIPERS surveys. , keywords =. doi:10.1051/0004-6361/202141072 , archivePrefix =. 2111.08730 , primaryClass =
-
[56]
The incidence of obscuration in active galactic nuclei. , keywords =. doi:10.1093/mnras/stt2149 , archivePrefix =. 1311.1305 , primaryClass =
-
[57]
2003, MNRAS, 339, 937, doi: 10.1046/j.1365-8711.2003.06241.x G¨ otberg, Y., de Mink, S
Changing look: from Compton-thick to Compton-thin, or the rebirth of fossil active galactic nuclei. , keywords =. doi:10.1046/j.1365-8711.2003.06539.x , archivePrefix =. astro-ph/0302328 , primaryClass =
-
[58]
Transient Name Server Discovery Report , keywords =
GaiaAlerts Transient Discovery Report for 2019-06-18. Transient Name Server Discovery Report , keywords =
2019
-
[59]
The Host Galaxy and Rapidly Evolving Broad-line Region in the Changing-look Active Galactic Nucleus 1ES 1927+654. , keywords =. doi:10.3847/1538-4357/ac714a , archivePrefix =. 2208.01797 , primaryClass =
-
[60]
Tidal Disruption Events in Active Galactic Nuclei. , keywords =. doi:10.3847/1538-4357/ab2b40 , archivePrefix =. 1904.12261 , primaryClass =
-
[61]
A new class of flares from accreting supermassive black holes. Nature Astronomy , keywords =. doi:10.1038/s41550-018-0661-3 , archivePrefix =. 1901.03731 , primaryClass =
-
[62]
A Comparison of the X-Ray Emission from Tidal Disruption Events with those of Active Galactic Nuclei. , keywords =. doi:10.3847/1538-4357/aa9b7c , archivePrefix =. 1703.06141 , primaryClass =
-
[63]
2021, ARA&A, 59, 21, doi: 10.1146/annurev-astro-111720-030029
Tidal Disruption Events. , keywords =. doi:10.1146/annurev-astro-111720-030029 , archivePrefix =. 2104.14580 , primaryClass =
-
[65]
A Catalog of Quasar Properties from Sloan Digital Sky Survey Data Release 7. , keywords =. doi:10.1088/0067-0049/194/2/45 , archivePrefix =. 1006.5178 , primaryClass =
-
[66]
Spectral Properties of Quasars from Sloan Digital Sky Survey Data Release 14: The Catalog. , keywords =. doi:10.3847/1538-4365/ab99c5 , archivePrefix =. 1910.10395 , primaryClass =
-
[67]
Dissecting galaxies: spatial and spectral separation of emission excited by star formation and AGN activity. , keywords =. doi:10.1093/mnras/stw1754 , archivePrefix =. 1607.05731 , primaryClass =
-
[68]
SkyMapper Southern Survey: Second data release (DR2). , keywords =. doi:10.1017/pasa.2019.27 , archivePrefix =. 2008.10359 , primaryClass =
-
[69]
An Algorithm for the Relative Scaling of Spectra. , keywords =. doi:10.1086/133039 , adsurl =
-
[71]
X-ray spectra reveal the reawakening of the repeat changing-look AGN NGC 1566. , keywords =. doi:10.1093/mnrasl/sly224 , archivePrefix =. 1811.10289 , primaryClass =
-
[72]
Explaining changing-look AGN with state transition triggered by rapid mass accretion rate drop. , keywords =. doi:10.1093/mnras/sty2032 , archivePrefix =. 1805.07873 , primaryClass =
-
[73]
Improving the selection of changing-look AGNs through multiwavelength photometric variability. , keywords =. doi:10.1093/mnras/stad1893 , archivePrefix =. 2306.13808 , primaryClass =
-
[74]
Optical Continuum and Emission-Line Variability of Seyfert 1 Galaxies. , keywords =. doi:10.1086/305813 , archivePrefix =. astro-ph/9802104 , primaryClass =
-
[75]
Summary of the content and survey properties
Gaia Data Release 3. Summary of the content and survey properties. , keywords =. doi:10.1051/0004-6361/202243940 , archivePrefix =. 2208.00211 , primaryClass =
-
[76]
Theoretical Modeling of Starburst Galaxies. , keywords =. doi:10.1086/321545 , archivePrefix =. astro-ph/0106324 , primaryClass =
-
[77]
Semi-empirical analysis of Sloan Digital Sky Survey galaxies - III. How to distinguish AGN hosts. , keywords =. doi:10.1111/j.1365-2966.2006.10732.x , archivePrefix =. astro-ph/0606724 , primaryClass =
-
[79]
Maps of Dust Infrared Emission for Use in Estimation of Reddening and Cosmic Microwave Background Radiation Foregrounds. , keywords =. doi:10.1086/305772 , archivePrefix =. astro-ph/9710327 , primaryClass =
-
[80]
A Catalogue of H II Regions. , year = 1959, month = dec, volume =. doi:10.1086/190049 , adsurl =
-
[81]
2MASS Extended Sources in the Zone of Avoidance. , keywords =. doi:10.1086/301426 , archivePrefix =. astro-ph/0005017 , primaryClass =
-
[82]
Active Galactic Nuclei in the Sloan Digital Sky Survey. I. Sample Selection. , keywords =. doi:10.1086/428485 , archivePrefix =. astro-ph/0501059 , primaryClass =
-
[83]
COLOR-MASS-TO-LIGHT-RATIO RELATIONS FOR DISK GALAXIES
Color-Mass-to-light-ratio Relations for Disk Galaxies. , keywords =. doi:10.1088/0004-6256/148/5/77 , archivePrefix =. 1407.1839 , primaryClass =
-
[85]
Exploring Changing-look Active Galactic Nuclei with the Sloan Digital Sky Survey V: First Year Results. , keywords =. doi:10.3847/1538-4357/ad2f30 , archivePrefix =. 2401.01933 , primaryClass =
-
[86]
Unabsorbed Seyfert 2 galaxies. , keywords =. doi:10.1051/0004-6361:20021161 , archivePrefix =. astro-ph/0208496 , primaryClass =
-
[87]
BASS. XXIV. The BASS DR2 Spectroscopic Line Measurements and AGN Demographics. , keywords =. doi:10.3847/1538-4365/ac5b68 , archivePrefix =. 2203.00017 , primaryClass =
-
[88]
Determining Central Black Hole Masses in Distant Active Galaxies and Quasars. II. Improved Optical and UV Scaling Relationships. , keywords =. doi:10.1086/500572 , archivePrefix =. astro-ph/0601303 , primaryClass =
-
[89]
Galaxies Lighting Up: Discovery of Seventy New Turn-on Changing-look Quasars. arXiv e-prints , keywords =. doi:10.48550/arXiv.2408.16183 , archivePrefix =. 2408.16183 , primaryClass =
discussion (0)
Sign in with ORCID, Apple, or X to comment. Anyone can read and Pith papers without signing in.