Exploring biases in derived stellar parameters and the ionizing photon production efficiency
Pith reviewed 2026-06-29 23:47 UTC · model grok-4.3
The pith
Derived xi_ion values for z=3 galaxies vary by over 1.1 dex depending on data type and SED models used
A machine-rendered reading of the paper's core claim, the machinery that carries it, and where it could break.
Core claim
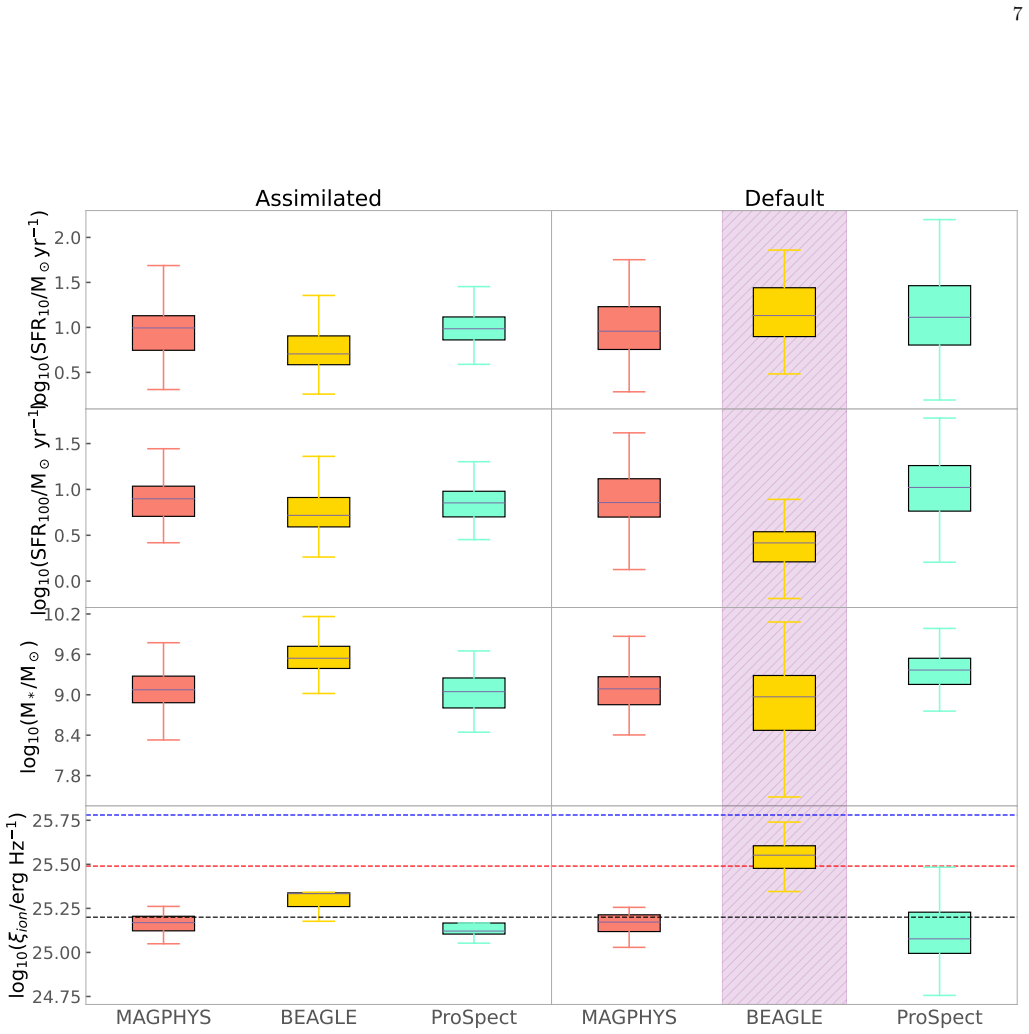
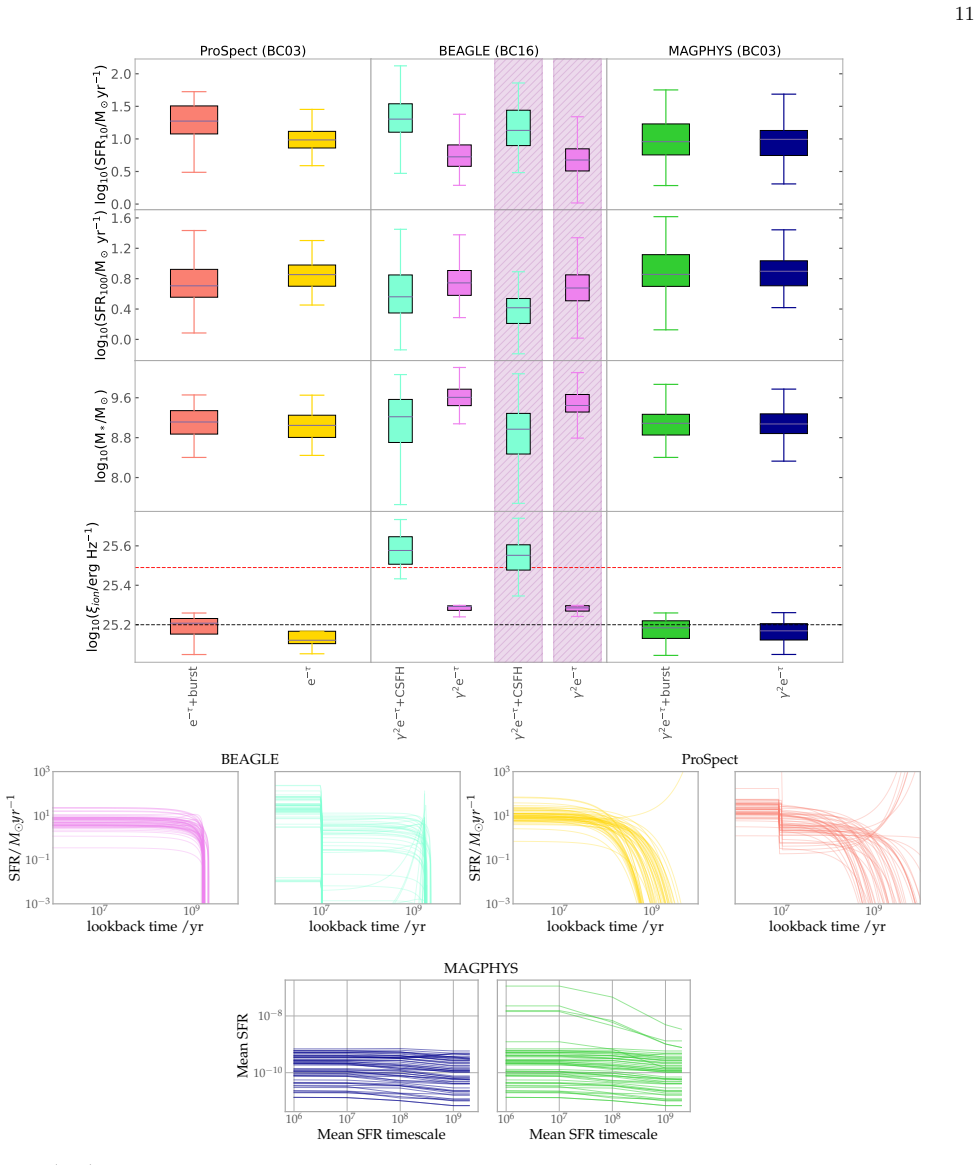
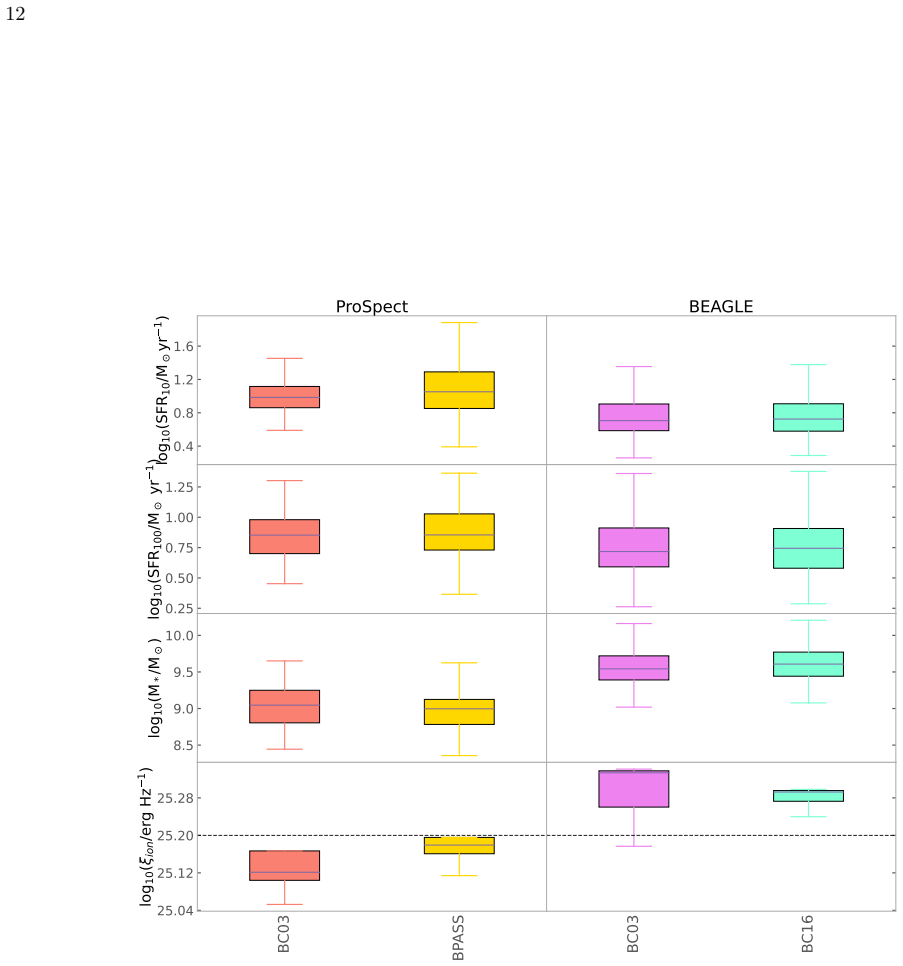
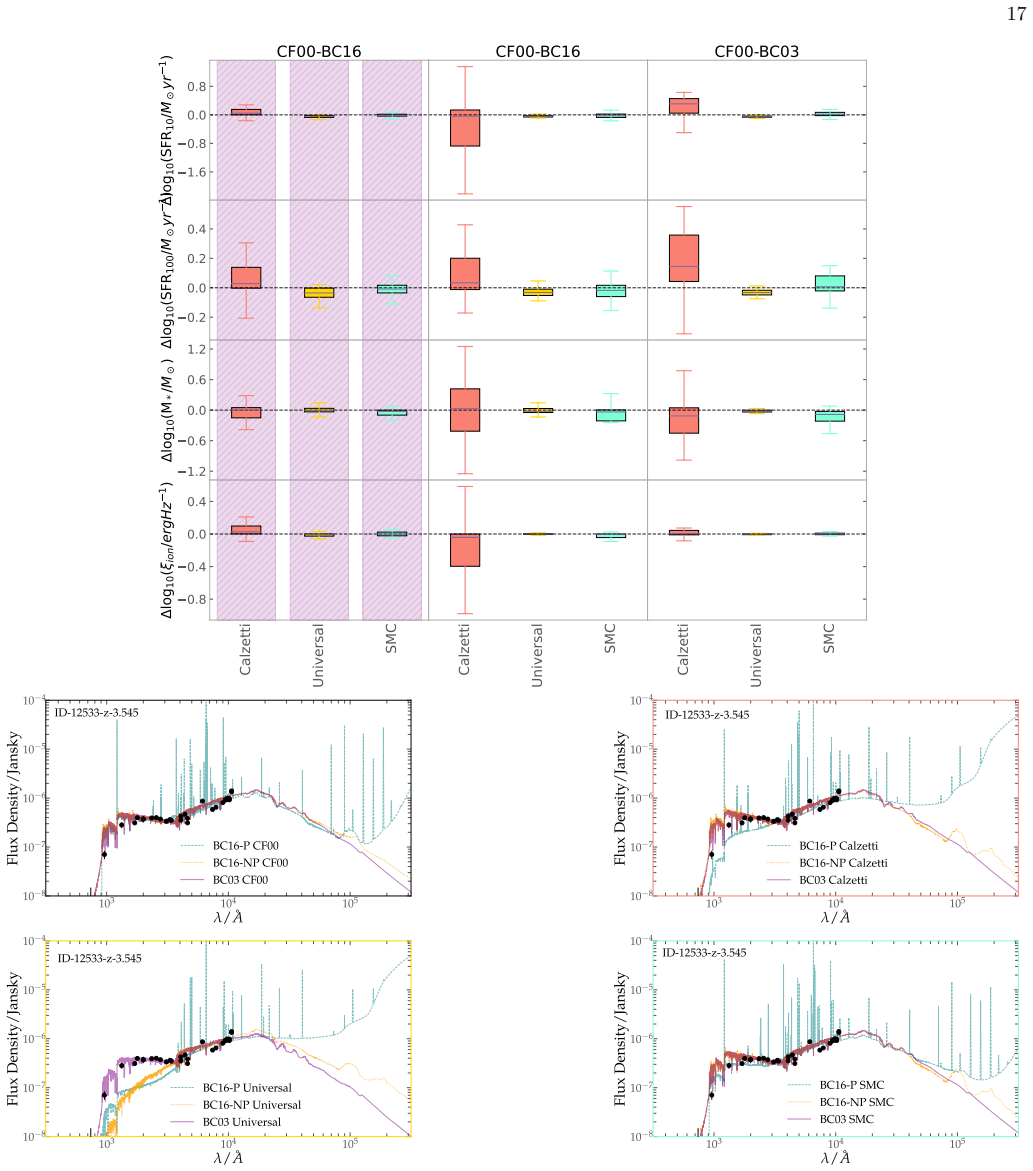
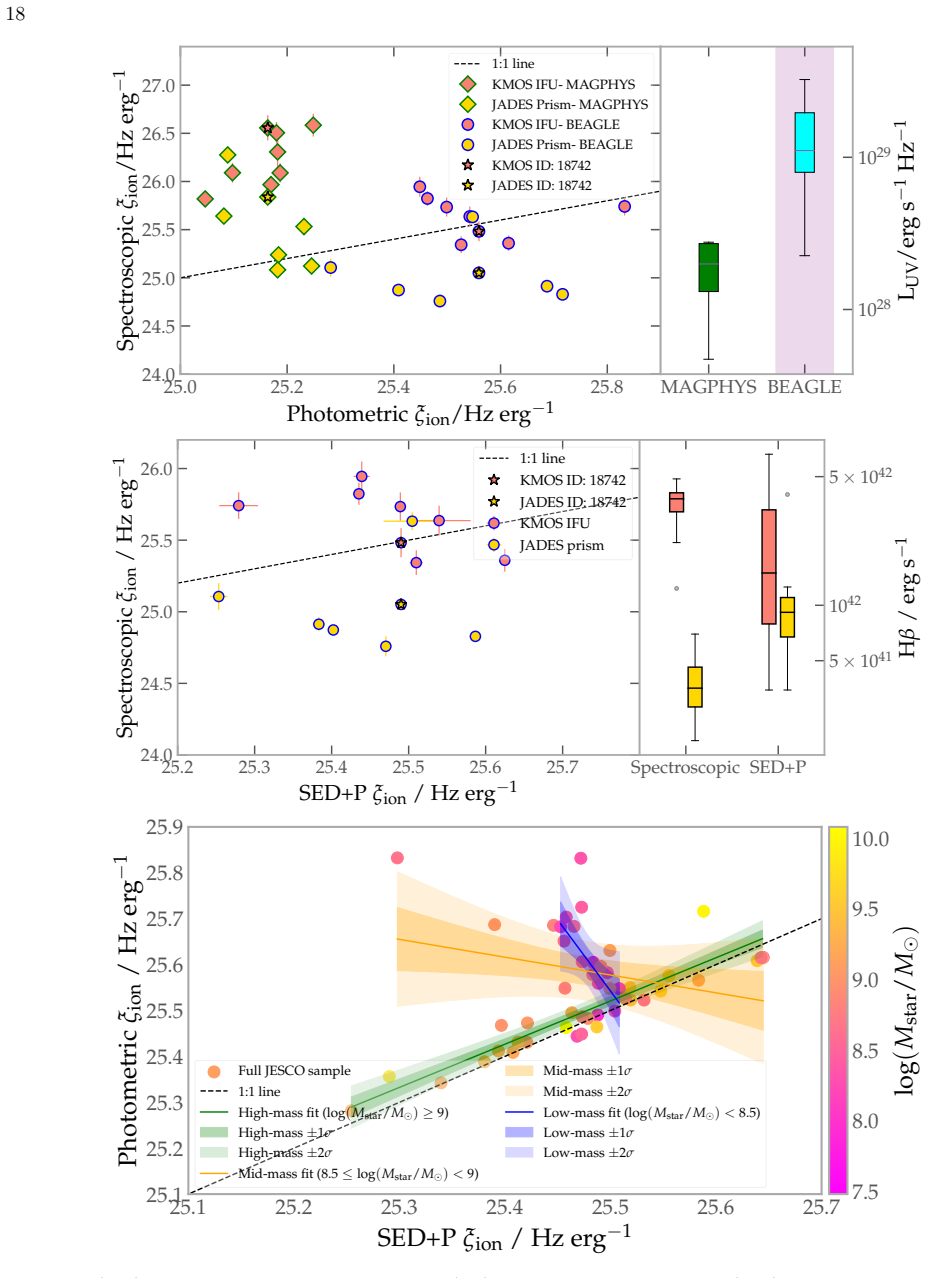
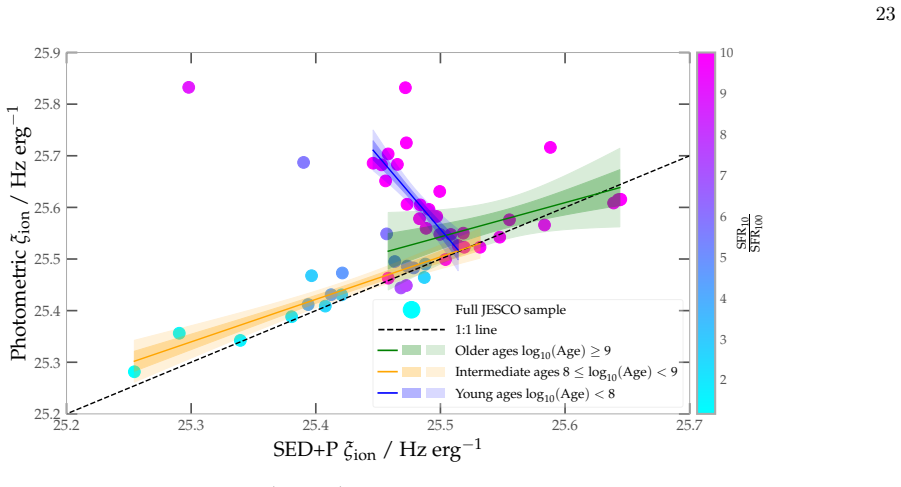
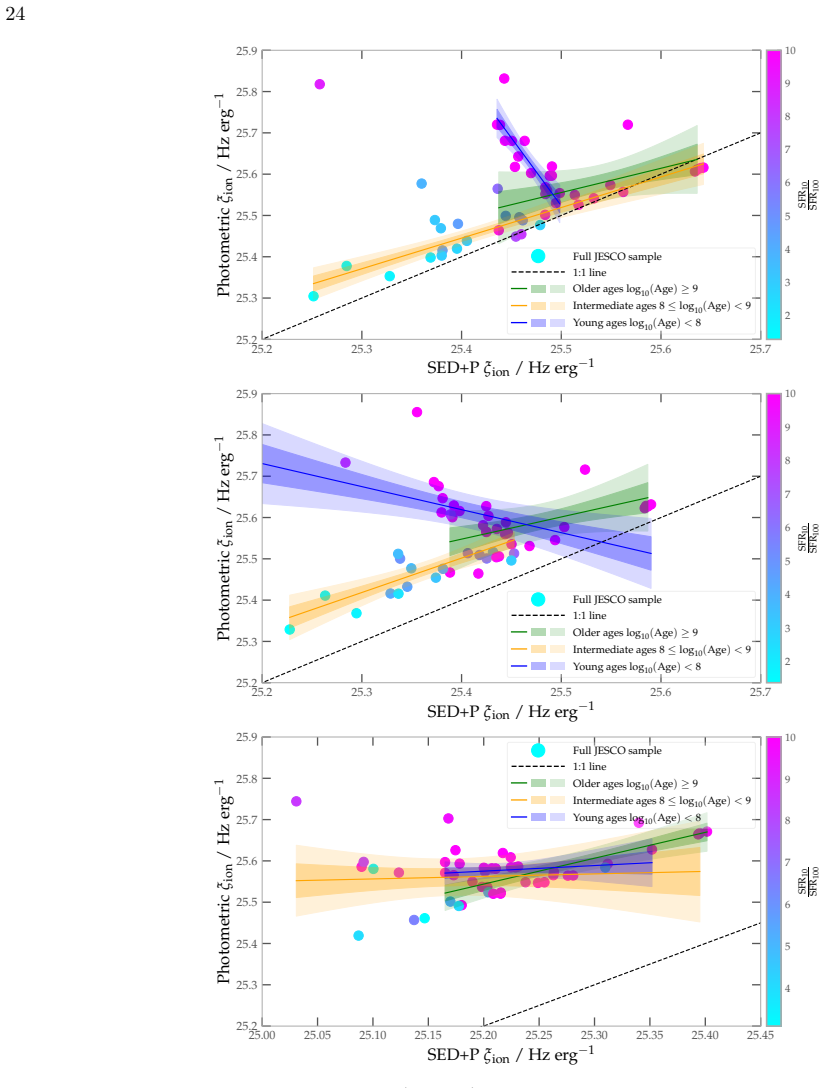
For this homogeneous z=3 population the median stellar mass can vary by over 0.6 dex and the SFR by more than 0.9 dex. Further, the xi_ion can vary by over 1.1 dex for individual sources when comparing spectroscopic and photometric derivations, or by more than 0.5 dex when fitting SEDs with different models. The model, method and data dependence of the xi_ion parameter is undeniable even for a homogeneous population.
What carries the argument
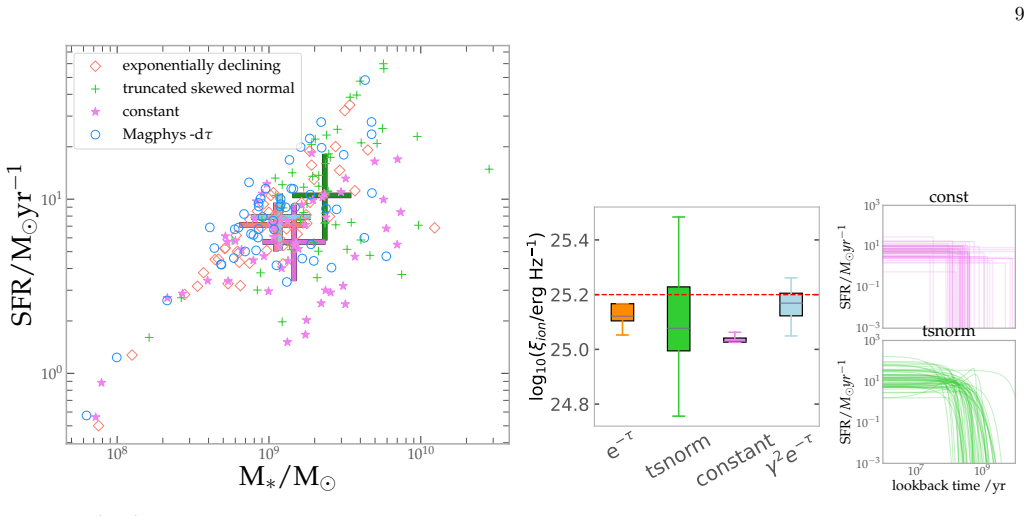
Direct comparison of three techniques that combine spectroscopic and photometric data with three different SED fitting codes, each containing multiple star formation history, stellar population synthesis, dust, and photoionization prescriptions.
If this is right
- Stellar mass estimates for the same galaxies differ by more than 0.6 dex across methods.
- Star formation rate estimates differ by more than 0.9 dex.
- xi_ion values shift by over 1.1 dex between spectroscopic and photometric derivations.
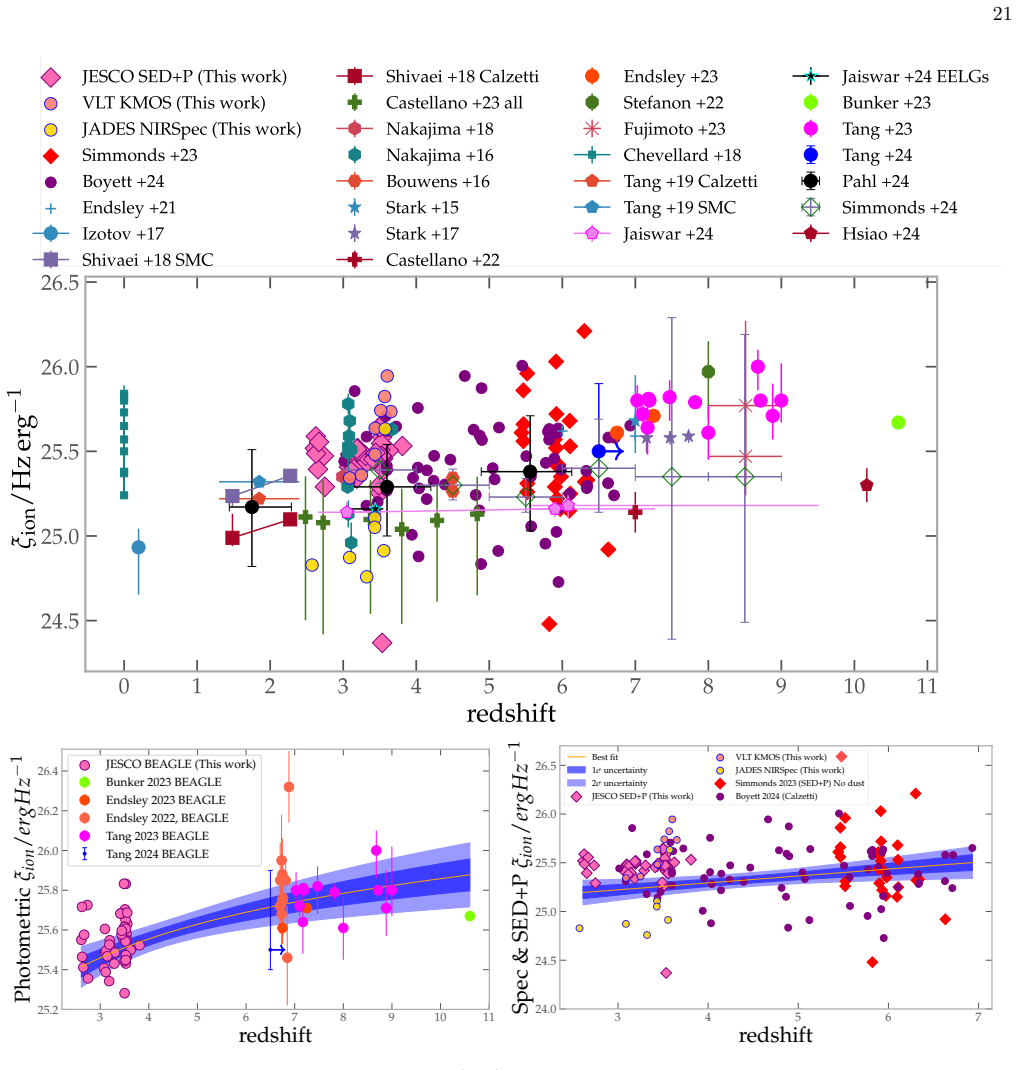
- A redshift evolution trend in xi_ion for extreme emitters appears only when a single consistent method is used across redshifts.
Where Pith is reading between the lines
- Constraints on the contribution of galaxies to reionization carry larger systematic uncertainties than usually quoted when methods are mixed.
- Future JWST analyses of EoR sources will need standardized fitting pipelines to reduce these spreads.
- Direct Lyman continuum measurements at z=3 could provide an external check on which modeling choices best recover true xi_ion.
Load-bearing premise
That z=3 galaxies serve as reliable analogs for the stellar populations and ionizing sources present during the Epoch of Reionization.
What would settle it
Apply the same three techniques and three SED codes to an independent sample of z=3 galaxies and check whether the spread in xi_ion still exceeds 0.5 dex between photometric and spectroscopic derivations.
Figures
read the original abstract
Constraining the timescale and manner in which the Epoch of Reionization (EoR) occurred is a major JWST science goal. However, any constraints on the stellar or ionizing parameters (xi ion) of galaxies in the EoR must contend with biases introduced by both the data and the models used. We explore three techniques that use spectroscopic and photometric data as well as three different spectral energy distribution (SED) fitting codes, each comprised of multiple star formation history, stellar population synthesis, dust, and photoionization prescriptions to determine their relative influence on stellar parameters and xi ion. We use z=3 EoR analog galaxies due to their reliable photometric coverage (improved physical constraints) in comparison to direct EoR sources and potential for direct Lyman Continuum escape research. For this population the median stellar mass can vary by over 0.6 dex and the SFR by more than 0.9 dex. Further, the xi ion can vary by over 1.1 dex for individual sources when comparing spectroscopic and photometric derivations, or by more than 0.5 dex when fitting SEDs with different models. As such, the choice of methodology can have significant consequences for the derived xi ion and the subsequent sources of reionization. We find that the presence of a redshift evolution for xi ion is dependent on the method adopted for its derivation, where a consistent method yields an evolutionary trend with redshift in extreme emitters while an indiscriminant selection of studies does not. The model, method and data dependence of the xi ion parameter is undeniable even for a homogeneous population.
Editorial analysis
A structured set of objections, weighed in public.
Referee Report
Summary. The paper claims that stellar masses, SFRs, and the ionizing photon production efficiency ξ_ion derived for a homogeneous sample of z=3 galaxies vary substantially (median mass >0.6 dex, SFR >0.9 dex, ξ_ion >0.5 dex between SED models and >1.1 dex between spectroscopic and photometric derivations) depending on the data type, fitting technique, and choice of SED code (including SFH, SPS, dust, and photoionization prescriptions). It further claims that the apparent redshift evolution of ξ_ion is sensitive to whether a consistent method is applied across studies or whether results are combined indiscriminately. The z=3 sample is used as EoR analogs to enable better photometric constraints.
Significance. If the reported spreads hold, the result is significant because it supplies a direct, empirical quantification of systematic uncertainties in ξ_ion on an identical galaxy population, which bears directly on JWST-era inferences about the sources of reionization. The strength of the work lies in its controlled comparison (multiple techniques and codes applied to the same objects) rather than cross-study compilation; this avoids the usual confounding of sample differences with methodological differences. The finding that redshift trends appear or disappear depending on methodological consistency is a useful cautionary result for the field.
major comments (1)
- [abstract and § on redshift evolution] The claim that 'a consistent method yields an evolutionary trend with redshift in extreme emitters while an indiscriminant selection of studies does not' (abstract) is load-bearing for the broader implication about literature comparisons. The manuscript should specify the exact selection criteria, number of studies, and redshift bins used for the 'indiscriminant' compilation so that the contrast with the consistent-method case can be reproduced.
minor comments (2)
- [abstract] The abstract states specific variation amplitudes (0.6 dex, 0.9 dex, 0.5 dex, 1.1 dex) but does not indicate whether these are medians, means, or 16–84 percentile ranges; this should be clarified in the text and figure captions that report the spreads.
- [§2] Notation for ξ_ion is used without an explicit definition or reference to the standard expression (e.g., the ratio of ionizing photons to UV luminosity); adding the defining equation in §2 would improve clarity.
Simulated Author's Rebuttal
We thank the referee for their positive assessment of the work and for the constructive suggestion regarding the redshift-evolution claim. We address the point below and will incorporate the requested details in the revised manuscript.
read point-by-point responses
-
Referee: [abstract and § on redshift evolution] The claim that 'a consistent method yields an evolutionary trend with redshift in extreme emitters while an indiscriminant selection of studies does not' (abstract) is load-bearing for the broader implication about literature comparisons. The manuscript should specify the exact selection criteria, number of studies, and redshift bins used for the 'indiscriminant' compilation so that the contrast with the consistent-method case can be reproduced.
Authors: We agree that reproducibility requires explicit documentation of the literature compilation. In the revised manuscript we will add a dedicated paragraph (and, if space permits, a supplementary table) that lists: (i) the precise selection criteria applied to the literature sample (e.g., only studies reporting ξ_ion for extreme emitters at z>2 with published uncertainties), (ii) the total number of studies included, and (iii) the redshift bins adopted for the indiscriminant compilation. This will allow direct comparison with the consistent-method trend derived from our homogeneous z=3 sample and the additional literature points we already treat uniformly. revision: yes
Circularity Check
No significant circularity: empirical spreads reported directly from method comparisons
full rationale
The paper applies multiple SED fitting techniques and codes to one fixed z=3 sample and directly measures the resulting spreads in stellar mass (0.6 dex), SFR (0.9 dex), and xi_ion (>0.5 dex between models, >1.1 dex spec vs photo). No equations, predictions, or uniqueness theorems are invoked that reduce by construction to fitted inputs or self-citations. The z=3 analog choice is presented only as a practical data-quality decision, not as a derived premise. All load-bearing claims rest on the internal empirical comparison itself, which is self-contained and externally falsifiable.
Axiom & Free-Parameter Ledger
axioms (1)
- domain assumption z=3 galaxies are appropriate analogs for Epoch of Reionization sources due to reliable photometric coverage providing improved physical constraints
Reference graph
Works this paper leans on
-
[1]
Akins, H. B., Casey, C. M., Allen, N., et al. 2023, The Astrophysical Journal. https://arxiv.org/abs/2304.12347
-
[2]
Bagley, M. B., Finkelstein, S. L., Koekemoer, A. M., et al. 2022, The Astrophysical Journal Letters,, doi: 10.3847/2041-8213/acbb08 27
-
[3]
J., da Cunha, E., Shivaei, I., & Calzetti, D
Battisti, A. J., da Cunha, E., Shivaei, I., & Calzetti, D. 2020, The Astrophysical Journal, 888, 108, doi: 10.3847/1538-4357/ab5fdd
-
[4]
J., da Cunha, E., Grasha, K., et al
Battisti, A. J., da Cunha, E., Grasha, K., et al. 2019, The Astrophysical Journal, 882, 61, doi: 10.3847/1538-4357/ab345d
-
[5]
Battisti, A. J., Bagley, M. B., Baronchelli, I., et al. 2022, Monthly Notices of the Royal Astronomical Society, 513, 4431, doi: 10.1093/mnras/stac1052
-
[6]
Begley, R., McLure, R. J., Cullen, F., et al. 2024, MNRAS. https://arxiv.org/abs/2410.10988
-
[7]
Begley, R., McLure, R. J., Cullen, F., et al. 2026, MNRAS, 545, staf1995, doi: 10.1093/mnras/staf1995
- [8]
- [9]
-
[10]
Bosman, S. E. I., Davies, F. B., Becker, G. D., et al. 2022, Monthly Notices of the Royal Astronomical Society, 514, 55, doi: 10.1093/mnras/stac1046
-
[11]
J., Smit, R., Labbe, I., et al
Bouwens, R. J., Smit, R., Labbe, I., et al. 2015, ApJ, doi: 10.3847/0004-637X/831/2/176
-
[12]
Boyett, K., Bunker, A. J., Curtis-Lake, E., et al. 2024, MNRAS. https://arxiv.org/abs/2401.16934
-
[13]
and Mellema, Garrelt and Mao, Yi and Iliev, Ilian T
Bressan, A., Marigo, P., Girardi, L., et al. 2012, Monthly Notices of the Royal Astronomical Society, 427, 127, doi: 10.1111/j.1365-2966.2012.21948.x
-
[14]
2011, ARA&A, 49, 373, doi: 10.1146/annurev-astro-081710-102608
Bromm, V., & Yoshida, N. 2011, ARA&A, doi: 10.1146/annurev-astro-081710-102608
-
[15]
Bruzual, G., & Charlot, S. 2003, MNRAS, doi: 10.1046/j.1365-8711.2003.06897.x
-
[16]
Bunker, A. J., Cameron, A. J., Curtis-Lake, E., et al. 2023a, A&A, doi: 10.1051/0004-6361/202347094
-
[17]
Bunker, A. J., Saxena, A., Cameron, A. J., et al. 2023b, A&A, doi: 10.1051/0004-6361/202346159
- [18]
-
[19]
Star Formation Rate Indicators
Calzetti, D. 2012, Secular Evolution of Galaxies. https://arxiv.org/abs/1208.2997
work page internal anchor Pith review Pith/arXiv arXiv 2012
-
[20]
The Dust Content and Opacity of Actively Star-Forming Galaxies
Calzetti, D., Armus, L., Bohlin, R. C., et al. 2000, The Astrophysical Journal, 533, 682, doi: 10.1086/308692
work page internal anchor Pith review doi:10.1086/308692 2000
-
[21]
Calzetti, D., Kinney, A. L., & Storchi-Bergmann, T. 1994, The Astrophysical Journal, 429, 582, doi: 10.1086/174346
-
[22]
J., Katz, H., Witten, C., et al
Cameron, A. J., Katz, H., Witten, C., et al. 2023, MNRAS. https://arxiv.org/abs/2311.02051
-
[23]
Carnall, A. C., Leja, J., Johnson, B. D., et al. 2019, The Astrophysical Journal, 873, 44, doi: 10.3847/1538-4357/ab04a2
-
[24]
Carnall, A. C., McLure, R. J., Dunlop, J. S., & Dav´ e, R. 2017, MNRAS, doi: 10.1093/mnras/sty2169
work page internal anchor Pith review doi:10.1093/mnras/sty2169 2017
-
[25]
2022, Astronomy & Astrophysics, 662, A115, doi: 10.1051/0004-6361/202243348
Castellano, M., Pentericci, L., Cupani, G., et al. 2022, Astronomy & Astrophysics, 662, A115, doi: 10.1051/0004-6361/202243348
-
[26]
2023, A&A, doi: 10.1051/0004-6361/202346069
Castellano, M., Belfiori, D., Pentericci, L., et al. 2023, A&A, doi: 10.1051/0004-6361/202346069
-
[27]
2003, PASP, 115, 763, doi: 10.1086/376392
Chabrier, G. 2003, Publications of the Astronomical Society of the Pacific, 115, 763, doi: 10.1086/376392
work page internal anchor Pith review doi:10.1086/376392 2003
-
[28]
Charlot, S., & Fall, S. M. 2000, The Astrophysical Journal, 539, 718, doi: 10.1086/309250
work page internal anchor Pith review doi:10.1086/309250 2000
-
[29]
2024, ApJ, doi: 10.3847/1538-4357/ad4033
Terao, Y. 2024, ApJ, doi: 10.3847/1538-4357/ad4033
-
[30]
2016, MNRAS, doi: 10.1093/mnras/stw1756
Chevallard, J., & Charlot, S. 2016, MNRAS, doi: 10.1093/mnras/stw1756
-
[31]
2013, Monthly Notices of the Royal Astronomical Society, 432, 2061, doi: 10.1093/mnras/stt523
Chevallard, J., Charlot, S., Wandelt, B., & Wild, V. 2013, Monthly Notices of the Royal Astronomical Society, 432, 2061, doi: 10.1093/mnras/stt523
-
[32]
2017, MNRAS, doi: 10.1093/mnras/sty1461 —
Chevallard, J., Charlot, S., Senchyna, P., et al. 2017, MNRAS, doi: 10.1093/mnras/sty1461 —. 2018, Monthly Notices of the Royal Astronomical Society, 479, 3264, doi: 10.1093/mnras/sty1461
-
[33]
Cohn, J. H., Leja, J., Tran, K.-V. H., et al. 2018, The Astrophysical Journal, 869, 141, doi: 10.3847/1538-4357/aaed3d
-
[34]
Condon, J. J. 1992, Annual Review of Astronomy and Astrophysics, 30, 575, doi: 10.1146/annurev.aa.30.090192.003043
-
[35]
Modeling the Panchromatic Spectral Energy Distributions of Galaxies
Conroy, C. 2013, Annual Review of Astronomy and Astrophysics, 51, 393, doi: 10.1146/annurev-astro-082812-141017
work page internal anchor Pith review doi:10.1146/annurev-astro-082812-141017 2013
-
[36]
Conroy, C., & Gunn, J. E. 2009, ApJ, doi: 10.1088/0004-637X/712/2/833
work page internal anchor Pith review doi:10.1088/0004-637x/712/2/833 2009
-
[37]
Conroy, C., Gunn, J. E., & White, M. 2008, ApJ, doi: 10.1088/0004-637X/699/1/486
work page internal anchor Pith review doi:10.1088/0004-637x/699/1/486 2008
-
[38]
H., Balu, S., Greig, B., et al
Cook, J. H., Balu, S., Greig, B., et al. 2024, Monthly Notices of the Royal Astronomical Society, 529, 2734, doi: 10.1093/mnras/stae593 da Cunha, E., Charlot, S., & Elbaz, D. 2008, MNRAS, doi: 10.1111/j.1365-2966.2008.13535.x da Cunha, E., Walter, F., Smail, I., et al. 2015, ApJ, doi: 10.1088/0004-637X/806/1/110
-
[39]
Dale, D. A., Helou, G., Magdis, G. E., et al. 2014, The Astrophysical Journal, 784, 83, doi: 10.1088/0004-637X/784/1/83
work page internal anchor Pith review doi:10.1088/0004-637x/784/1/83 2014
-
[40]
Davies, L. J. M., Bremer, M. N., Stanway, E. R., & Lehnert, M. D. 2013, Monthly Notices of the Royal Astronomical Society, 433, 2588, doi: 10.1093/mnras/stt929
-
[41]
Davies, L. J. M., Robotham, A. S. G., Driver, S. P., et al. 2015, MNRAS, doi: 10.1093/mnras/stv1241
-
[42]
Davies, L. J. M., Driver, S. P., Robotham, A. S. G., et al. 2016, MNRAS, doi: 10.1093/mnras/stw1342 28 de la Vega, A., Babcock, M. D., Mobasher, B., et al. 2025, arXiv e-prints
-
[43]
Dopita, M. A., & Sutherland, R. S. 1996, The Astrophysical Journal Supplement Series, 102, 161, doi: 10.1086/192255
-
[44]
Eisenstein, D. J., Johnson, B. D., Robertson, B., et al. 2023b, ApJS. https://arxiv.org/abs/2310.12340
-
[45]
Eldridge, J. J., Izzard, R. G., & Tout, C. A. 2008, Monthly Notices of the Royal Astronomical Society, 384, 1109, doi: 10.1111/j.1365-2966.2007.12738.x
-
[46]
Eldridge, J. J., Stanway, E. R., Xiao, L., et al. 2017, PASA, doi: 10.1017/pasa.2017.51
work page internal anchor Pith review doi:10.1017/pasa.2017.51 2017
-
[47]
2020, The Astrophysical Journal, 895, 116, doi: 10.3847/1538-4357/ab8f97
Emami, N., Siana, B., Alavi, A., et al. 2020, The Astrophysical Journal, 895, 116, doi: 10.3847/1538-4357/ab8f97
-
[48]
Endsley, R., & Stark, D. P. 2021, MNRAS, doi: 10.1093/mnras/stac524
-
[49]
Endsley, R., Stark, D. P., Whitler, L., et al. 2023, Monthly Notices of the Royal Astronomical Society, 524, 2312, doi: 10.1093/mnras/stad1919
-
[50]
Revista Mexicana de Astronomía y Astrofísica , keywords =
Ferland, G. J., Chatzikos, M., Guzm´ an, F., et al. 2017, RMxAA. https://arxiv.org/abs/1705.10877
-
[51]
Forrest, B., Tran, K.-V. H., Broussard, A., et al. 2018, The Astrophysical Journal, 863, 131, doi: 10.3847/1538-4357/aad232
-
[52]
2020, The Astrophysical Journal Letters, 890, L1, doi: 10.3847/2041-8213/ab5b9f
Forrest, B., Annunziatella, M., Wilson, G., et al. 2020, The Astrophysical Journal Letters, 890, L1, doi: 10.3847/2041-8213/ab5b9f
-
[53]
2023, The Astrophysical Journal Letters, 949, L25, doi: 10.3847/2041-8213/acd2d9
Fujimoto, S., Arrabal Haro, P., Dickinson, M., et al. 2023, The Astrophysical Journal Letters, 949, L25, doi: 10.3847/2041-8213/acd2d9
-
[54]
2022, Monthly Notices of the Royal Astronomical Society, 519, 980, doi: 10.1093/mnras/stac3548
Gupta, A., Tran, K.-V., Mendel, T., et al. 2022, Monthly Notices of the Royal Astronomical Society, 519, 980, doi: 10.1093/mnras/stac3548
-
[55]
Gupta, A., Trott, C. M., Jaiswar, R., et al. 2024, ApJ. https://arxiv.org/abs/2403.13285
-
[56]
2016, Monthly Notices of the Royal Astronomical Society, 462, 1757, doi: 10.1093/mnras/stw1716
Gutkin, J., Charlot, S., & Bruzual, G. 2016, Monthly Notices of the Royal Astronomical Society, 462, 1757, doi: 10.1093/mnras/stw1716
-
[57]
Hainline, K. N., Johnson, B. D., Robertson, B., et al. 2023, ApJ. https://arxiv.org/abs/2306.02468
-
[58]
Hildebrand, R. H. 1983, QJRAS, 24, 267
1983
-
[59]
Y.-Y., ´Alvarez-M´ arquez, J., Coe, D., et al
Hsiao, T. Y.-Y., ´Alvarez-M´ arquez, J., Coe, D., et al. 2024, ApJ. https://arxiv.org/abs/2404.16200
-
[60]
K., Shimizu, I., Iwata, I., & Tanaka, M
Inoue, A. K., Shimizu, I., Iwata, I., & Tanaka, M. 2014, Monthly Notices of the Royal Astronomical Society, 442, 1805, doi: 10.1093/mnras/stu936
-
[61]
2017, Monthly Notices of the Royal Astronomical Society, 467, 4118, doi: 10.1093/mnras/stx347
Schaerer, D. 2017, Monthly Notices of the Royal Astronomical Society, 467, 4118, doi: 10.1093/mnras/stx347
-
[62]
I., Worseck, G., Schaerer, D., et al
Izotov, Y. I., Worseck, G., Schaerer, D., et al. 2018, Monthly Notices of the Royal Astronomical Society, 478, 4851, doi: 10.1093/mnras/sty1378
-
[63]
Jaiswar, R., Gupta, A., da Cunha, E., et al. 2024, PASA. https://arxiv.org/abs/2405.04870
-
[64]
2020, The Astrophysical Journal, 888, 109, doi: 10.3847/1538-4357/ab5fdc
Ji, Z., Giavalisco, M., Vanzella, E., et al. 2020, The Astrophysical Journal, 888, 109, doi: 10.3847/1538-4357/ab5fdc
-
[65]
D., Leja, J., Conroy, C., & Speagle, J
Johnson, B. D., Leja, J., Conroy, C., & Speagle, J. S. 2021, The Astrophysical Journal Supplement Series, 254, 22, doi: 10.3847/1538-4365/abef67
work page internal anchor Pith review doi:10.3847/1538-4365/abef67 2021
-
[66]
Kennicutt, R. C., & Evans, N. J. 2012, ARA&A, 50, 531, doi: 10.1146/annurev-astro-081811-125610
work page internal anchor Pith review doi:10.1146/annurev-astro-081811-125610 2012
-
[67]
Kerutt, J., Oesch, P. A., Wisotzki, L., et al. 2024, Astronomy & Astrophysics, 684, A42, doi: 10.1051/0004-6361/202346656
-
[68]
Kulkarni, G., Worseck, G., & Hennawi, J. F. 2018, MNRAS, doi: 10.1093/mnras/stz1493 Le Borgne, J.-F., Bruzual, G., Pell´ o, R., et al. 2003, Astronomy & Astrophysics, 402, 433, doi: 10.1051/0004-6361:20030243
-
[69]
Leitherer, C., & Heckman, T. M. 1995, The Astrophysical Journal Supplement Series, 96, 9, doi: 10.1086/192112
-
[70]
Speagle, J. S. 2019, The Astrophysical Journal, 876, 3, doi: 10.3847/1538-4357/ab133c
work page internal anchor Pith review doi:10.3847/1538-4357/ab133c 2019
-
[71]
2025, A&A, 698, A302, doi: 10.1051/0004-6361/202453251
Llerena, M., Pentericci, L., Napolitano, L., et al. 2025, A&A, 698, A302, doi: 10.1051/0004-6361/202453251
-
[72]
1995, The Astrophysical Journal, 441, 18, doi: 10.1086/175332
Madau, P. 1995, The Astrophysical Journal, 441, 18, doi: 10.1086/175332
-
[73]
Maiolino, R., Risaliti, G., Signorini, M., et al. 2024, MNRAS. https://arxiv.org/abs/2405.00504
-
[74]
Marigo, P., Bressan, A., Nanni, A., Girardi, L., & Pumo, M. L. 2013, Monthly Notices of the Royal Astronomical Society, 434, 488, doi: 10.1093/mnras/stt1034
-
[75]
2016, MNRAS, doi: 10.1093/mnras/stw2973
Matthee, J., Sobral, D., Best, P., et al. 2016, MNRAS, doi: 10.1093/mnras/stw2973
-
[76]
Murphy, E. J., Condon, J. J., Schinnerer, E., et al. 2011, The Astrophysical Journal, 737, 67, doi: 10.1088/0004-637X/737/2/67
-
[77]
Nakajima, K., Ellis, R. S., Iwata, I., et al. 2016, The Astrophysical Journal, 831, L9, doi: 10.3847/2041-8205/831/1/L9
-
[78]
2018, Astronomy & Astrophysics, 612, A94, doi: 10.1051/0004-6361/201731935 29
Nakajima, K., Schaerer, D., Le F` evre, O., et al. 2018, Astronomy & Astrophysics, 612, A94, doi: 10.1051/0004-6361/201731935 29
-
[79]
Oesch, P. A., Brammer, G., Naidu, R. P., et al. 2023, MNRAS. https://arxiv.org/abs/2304.02026
-
[80]
Oke, J. B., & Gunn, J. E. 1983, The Astrophysical Journal, 266, 713, doi: 10.1086/160817
discussion (0)
Sign in with ORCID, Apple, or X to comment. Anyone can read and Pith papers without signing in.