REVIEW 2 major objections 8 minor 52 references
New stellar activity probe beats standard proxies by factor of two
Reviewed by Pith at T0; open to challenge. T0 means a machine referee read the full paper against a public rubric. the ladder, T0–T4 →
T0 review · glm-5.2
2026-07-08 09:18 UTC pith:VODX23PJ
load-bearing objection SRA velocity shift may partly track residual Doppler rather than pure activity, but the paper's own injection tests bound the problem honestly. the 2 major comments →
Spectral Ratio Analysis: probing of a new suite of stellar activity indicators as a tool for astrophysical noise mitigation
The pith
A machine-rendered reading of the paper's core claim, the machinery that carries it, and where it could break.
Core claim
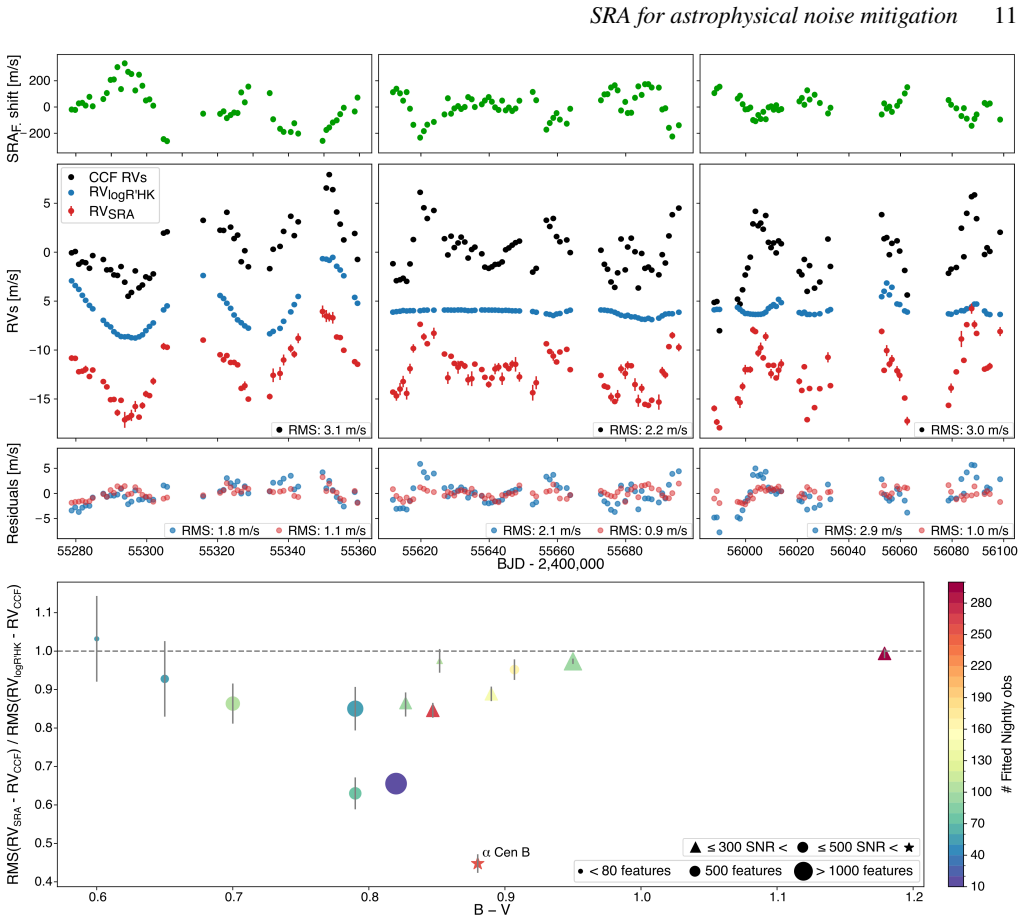
The paper's core discovery is that activity-sensitive spectral features, extracted by dividing high-activity stellar spectra by a low-activity template, yield a velocity-shift metric that predicts stellar-activity-induced radial-velocity variations more effectively than the chromospheric activity index logR'HK or cross-correlation-function shape parameters (BIS, FWHM). In a case study on alpha Cen B, residual RMS drops from 2.3 m/s with logR'HK to 1.0 m/s with SRA; across the full 14-star sample, SRA-based fits yield lower residual RMS than any classical indicator combination for the majority of stars, and random forest regression ranks the SRA Feature velocity shift as the most important RV
What carries the argument
The SRA process: (1) correct spectra for barycentric motion, secular acceleration, and known planets; (2) divide each high-activity spectrum by a low-activity seasonal template to produce ratio spectra; (3) remove instrumental ripple artefacts via a wavelength-dependent sinusoidal model; (4) identify activity-sensitive features as clusters of pixels exceeding twice the noise level in the ratio spectrum; (5) fit Gaussians to each feature to extract amplitude and velocity shift; (6) combine all features into two global metrics per observation — the weighted-average SRA Feature amplitude and weighted-average SRA Feature velocity shift. These two metrics serve as the activity indicators tested.
Load-bearing premise
The SRA Feature velocity shift is assumed to primarily reflect activity-induced line-shape distortions rather than artefacts from residual Doppler misalignment between the active and template spectra. The authors test ±5 m/s misalignments and inspect for characteristic S-shaped residuals, but the separation between genuine activity signals and misalignment artefacts becomes degenerate when uncorrected planetary signals or barycentric errors persist at the m/s level. This is a
What would settle it
Inject a known planetary signal at 1-2 m/s amplitude into a well-sampled star, then attempt recovery after subtracting the SRA-based activity model. If the velocity shift metric is partly tracking residual Doppler shifts rather than genuine line-shape changes, the recovered planet parameters will be biased or the SRA residuals will show the injected signal partially absorbed — as the authors themselves observed at 5-10 m/s injection levels.
Editorial analysis
A structured set of objections, weighed in public.
Referee Report
Summary. This paper presents a proof-of-concept demonstration of Spectral Ratio Analysis (SRA) applied to 14 G- and K-type stars observed with HARPS. The method divides high-activity spectra by a low-activity template to isolate activity-sensitive photospheric features, from which two global metrics are derived: the SRA Feature amplitude and the SRA Feature velocity shift. These metrics are compared against classical activity proxies (logR'HK, CCF BIS, CCF FWHM) in their ability to track stellar-activity-induced RV variations, using linear regression, random forest regression, and planetary injection-recovery tests. The authors find that SRA indicators — particularly the SRA Feature velocity shift — outperform classical proxies by up to a factor of two in RMS residual reduction for the majority of stars, and that the SRA Feature amplitude correlates with logR'HK while the velocity shift does not on nightly timescales but shows a moderate seasonal correlation for cooler stars. The paper also identifies and corrects instrumental ripple structures in the ratio spectra and provides a publicly available atlas of SRA spectra and features on Zenodo.
Significance. The paper tackles a central problem in exoplanet RV science: the mitigation of stellar activity noise. The SRA approach is a natural extension of Thompson et al. (2017, 2020) to a larger stellar sample, and the direct extraction of velocity information from photospheric features is a genuinely interesting contribution. The authors deserve credit for making their data publicly available (Zenodo atlas), for testing multiple independent methods (linear regression, random forest, injection recovery), and for honestly acknowledging key limitations including the SNR threshold, the simplified two-metric approach, and the vulnerability to Doppler misalignment. The planetary injection-recovery tests (Section 4.4) provide a concrete and falsifiable demonstration of the method's practical utility and its breakdown regime. The identification of a consistent thin-film optical path length (NL ~ 1.5e7 Å) across all targets is a useful instrumental by-product.
major comments (2)
- Section 4.1 and Section 4.4: The central claim — that SRA indicators outperform logR'HK — is most vulnerable to the concern that the SRA Feature velocity shift may partly absorb residual Doppler shifts rather than purely activity-induced line-shape distortions. The authors' mitigation test (injecting ±5 m/s misalignments, Section 4.1, Figure 5 red error bars) checks whether a uniform offset degrades the fit, and the injection-recovery tests (Section 4.4) show that at 10 m/s the planetary signal is absorbed by SRA. These tests are valuable and the authors are commended for including them. However, the regime of greatest concern is not a uniform offset but a time-varying residual velocity that is correlated with the CCF RVs by construction (since both are derived from the same spectra). The ±5 m/s test applies a constant shift; it does not directly probe what happens when a residual Doppl!
- Section 5, final paragraphs: The authors note that using a simple median to combine feature information yields better results than the weighted average used throughout the paper (lower RMS ratios; 11/14 stars dominated by SRA Feature shift importance instead of 8/14). This is a non-trivial internal inconsistency: the headline results (Figure 5, Table E1, Table F1) are all based on the weighted-average combination, but the authors themselves state that a crude median outperforms it. This weakens the specific quantitative claims (e.g., 'factor of two' improvement) since those numbers depend on a combination method the authors acknowledge is suboptimal. The authors should either adopt the median combination for the main results or explicitly quantify how much the improvement changes, so that the headline claims are tied to the best-performing method.
minor comments (8)
- Section 2.2: The statement that CCF RVs were not used for alignment because they include activity-induced shifts is important and correct, but the subsequent statement that known planets were removed using allesfitter with activity-proxy linear correlations could be stated more precisely — it is unclear whether the activity proxies were included as nuisance parameters in the orbital fit or used to detrend the RVs before fitting.
- Section 3.1: The interpretation that weaker amplitude-logR'HK correlations in earlier-type stars reflect a decoupling of photosphere and chromosphere is plausible but speculative given that the two hottest stars have the sparsest data. The authors acknowledge this, but the phrasing 'may hint at an underlying astrophysical effect' could be tempered further.
- Table E1: Two cells are described as 'highlighted in red' but no red highlighting is visible in the table as rendered. The authors should ensure the highlighting is preserved (e.g., via bold text or an asterisk).
- Section 4.3: The random forest regression uses 90% of data for training and 10% for testing, but the figure caption does not specify whether this is a single split or cross-validated. The jackknife error bars on the importances should be clarified as to whether they reflect split-to-split variation or feature subsampling.
- Figure 5, lower panel: The y-axis label and the ratio definition should be explicitly stated in the caption (i.e., RMS(RV_SRA) / RMS(RV_logR'HK)).
- Section 2.3, Eq. (1): The ripple model includes a wavelength-dependent frequency term (lambda_n / lambda), but the physical motivation for this specific functional form versus the thin-film model of Eq. (2) is not fully explained. Since both give similar results, it would help to state which was adopted for the final analysis and why.
- The Abstract states 'by up to a factor of two' — this is supported by Table E1 for individual stars (e.g., alpha Cen B: 3.1 to 1.4 m/s), but the sample-wide improvement is more modest for most stars. 'Up to a factor of two for the best-case targets' would be more precise.
- Section 4.1, Table 1: The coefficients are normalised between -1 and 1, but it would help to also report the raw coefficient values or at least the typical scale of the SRA Feature amplitude and shift metrics, so readers can assess the physical magnitude of the fitted relationship.
Simulated Author's Rebuttal
We thank the referee for a careful and constructive report. The two major comments are addressed below. On the first, we agree that the existing ±5 m/s constant-offset test does not fully probe the regime of time-varying residual Doppler shifts correlated with the CCF RVs, and we will add a dedicated test for this scenario. On the second, we agree that the internal inconsistency between the weighted-average and median combination methods needs to be resolved in the manuscript, and we will adopt the better-performing median as the primary method for the headline results.
read point-by-point responses
-
Referee: Section 4.1 and Section 4.4: The central claim — that SRA indicators outperform logR'HK — is most vulnerable to the concern that the SRA Feature velocity shift may partly absorb residual Doppler shifts rather than purely activity-induced line-shape distortions. The ±5 m/s test applies a constant shift; it does not directly probe what happens when a time-varying residual velocity correlated with the CCF RVs is present.
Authors: The referee is correct that our existing ±5 m/s test, which applies a constant offset, does not directly probe the most dangerous regime: a time-varying residual Doppler shift that is correlated with the CCF RVs by construction. We agree this is the most important vulnerability of the SRA Feature velocity shift, and we will address it explicitly in the revised manuscript. Specifically, we will add a new test in which we inject a time-varying sinusoidal velocity signal (at the same periods as the stellar rotation and at arbitrary periods) into the spectra before constructing the ratio spectra, with amplitudes comparable to the observed CCF RV scatter (2–5 m/s). This directly simulates the scenario the referee describes: a residual Doppler shift that is correlated with the measured CCF RVs. We will measure how much the SRA Feature velocity shift absorbs this injected signal and quantify the resulting artificial improvement in the RV_SRA fit. We expect partial absorption — the injection-recovery tests in Section 4.4 already show that at 10 m/s the planetary signal is substantially absorbed by SRA — but the key question is whether the absorption is sufficient to fully explain the factor-of-two improvement over logR'HK. Based on the fact that (i) the SRA features show distinct morphologies inconsistent with pure Doppler misalignment (no S-shaped residuals), (ii) different lines of similar depth and width show very different feature amplitudes, and (iii) the SRA Feature amplitude (which is insensitive to Doppler shifts) also contributes to the improvement, we expect the residual improvement after accounting for Doppler absorption to remain significant. However, we will present the quantitative results honestly and will revise the headline claims if the test shows that Doppler revision: partial
-
Referee: Section 5, final paragraphs: The authors note that using a simple median to combine feature information yields better results than the weighted average used throughout the paper (lower RMS ratios; 11/14 stars dominated by SRA Feature shift importance instead of 8/14). This is a non-trivial internal inconsistency: the headline results are all based on the weighted-average combination, but the authors themselves state that a crude median outperforms it. The authors should either adopt the median combination for the main results or explicitly quantify how much the improvement changes.
Authors: The referee is correct that this is a non-trivial internal inconsistency that weakens the specific quantitative claims. We will adopt the median combination as the primary method for the main results in the revised manuscript. This means that Figure 5 (lower panel), Table E1, and Table F1 will be regenerated using the median combination. We will also report the weighted-average results for comparison, either in an appendix or as a secondary panel, so that readers can see the difference. The headline claim of 'up to a factor of two' improvement will be tied to the best-performing method (median). Based on our preliminary results, the median combination yields lower RMS ratios for all 14 stars and increases the number of stars where the SRA Feature shift dominates the random forest importance from 8/14 to 11/14, so the headline claims are if anything strengthened. We will also expand the discussion in Section 5 to note that the weighted average appears to be degraded by issues in the Gaussian fitting (where stronger features with higher weights may have diminished velocity shifts due to physical differences in how stellar activity impacts different lines), and that the median is more robust to these effects. We agree with the referee that tying the headline claims to the best-performing method is essential. revision: yes
Circularity Check
No significant circularity: SRA indicators are derived from spectra independently of the CCF RVs they are regressed against; self-citations are methodological, not load-bearing for the central claim.
full rationale
The paper's central claim is that SRA-derived indicators (Feature amplitude and Feature velocity shift) better track CCF RV variability than classical proxies (logR'HK, BIS, FWHM). Walking the derivation chain: (1) SRA indicators are extracted from ratio spectra built by dividing high-activity by low-activity template spectra (Section 2.2). The CCF RVs being modelled are the DRS pipeline outputs from the same spectra, but the SRA metrics are not defined in terms of the CCF RVs — they are Gaussian-fit amplitudes and centroid shifts of activity-sensitive features in the ratio spectra. (2) The linear regression (Eq. 3) fits CCF RVs as a function of SRA indicators (or logR'HK), so the SRA indicators are inputs and the CCF RVs are the target — not the reverse. (3) The authors explicitly avoid using DRS CCF RVs for wavelength alignment (Section 2.2: 'we did not use the RVs derived from the DRS cross-correlation functions... as they include apparent shifts due to activity-induced line-shape changes'), instead correcting only for barycentric motion, secular acceleration, and known planets. This is a deliberate methodological choice to prevent circularity. (4) The ±5 m/s misalignment injection test (Section 4.1, Figure 5) and the planetary injection recovery tests (Section 4.4, Figure 7) provide independent checks that the SRA-RV correlation is not an artefact of shared Doppler information. The 10 m/s injection case does show SRA absorbing the planetary signal (producing S-shaped residuals), which the authors acknowledge as a limitation — but this is a correctness/limitation concern, not circularity. (5) Self-citations to Thompson et al. (2017, 2020) establish the SRA methodology and its solar validation, but the present paper's central comparative claim (SRA vs. logR'HK across 14 stars) does not reduce to those citations by construction. The random forest analysis (Section 4.3) uses the same indicators as inputs to predict CCF RVs, which is standard regression — not circular. The shared-spectra concern (SRA and CCF RVs from the same observations) is a legitimate methodological caveat that the authors address, but it does not constitute circularity in the sense of the prediction being equivalent to the input by definition. The derivation is self-contained against external benchmarks.
Axiom & Free-Parameter Ledger
free parameters (9)
- SNR threshold (nightly) =
150
- SNR threshold (seasonal) =
500
- logR'HK upper limit =
-4.80
- Delta_act lower limit =
0.05
- Gaussian filter sigma (ripple removal) =
15 pixels
- Feature FWHM cutoff =
2.5 km/s
- Velocity shift cutoff =
4.5 km/s
- Ripple model NL (thin-film) =
1.5e7 Angstrom
- Linear regression coefficients (alpha, beta) =
varies per star/season
axioms (4)
- domain assumption Stellar activity-induced RV variations are primarily driven by changes in photospheric absorption line profiles (facular suppression of convective blueshift, spot/facula contrast).
- domain assumption Dividing a high-activity spectrum by a low-activity template isolates activity-driven spectral changes.
- domain assumption The identified activity-sensitive features are astrophysical in origin and not dominated by instrumental systematics after ripple correction.
- ad hoc to paper A weighted average of Gaussian-fit amplitudes and shifts across all features captures meaningful global activity information.
read the original abstract
Stellar activity is the main barrier to detecting and/or confirming low-mass/long-period (and Earth-analogue) planets using radial-velocity (RV) measurements. Searching for reliable indicators that better trace magnetic activity may be key for both distinguishing more clearly between stellar and planetary signals, and for probing the underlying physics occurring on the stellar surface. In this work we have compared observations taken for magnetically active and inactive stellar phases over multiple time scales to study the spectral imprint due to varying stellar activity. This serves as a proof-of-concept demonstration of a technique (named Spectral Ratio Analysis, SRA) that can be used to isolate activity-driven changes directly in the stellar photospheric absorption lines where RVs are measured. Using 14 relatively quiet and well sampled G- and K-type stars that show stellar activity cycles, we identified hundreds of activity-sensitive spectral features. Reducing this variability information into two global metrics -- amplitude and velocity shift -- uncovers potential evidence of a decoupling of the photospheric and chromospheric responses to stellar activity in earlier-type stars. Additionally, potential signatures of the variations in the magnitude of the suppression of the convective blueshift throughout the activity cycle were observed via SRA. Finally, we show that these SRA indicators better capture RV variability than classical activity proxies, such as the chromospheric logR'HK index and other cross-correlation function-based parameters such as BIS and FWHM, by up to a factor of two. The direct link between photospheric line behaviour and stellar-induced RV variability offers a promising path for improving astrophysical noise mitigation.
Figures




Reference graph
Works this paper leans on
-
[1]
Chromaticity of stellar activity in radial velocities: Anti-correlated families of lines on the M dwarf EV Lac with SPIRou and SOPHIE. , keywords =. doi:10.1051/0004-6361/202554963 , archivePrefix =. 2509.17911 , primaryClass =
-
[2]
The EXPRES Stellar Signals Project II. State of the Field in Disentangling Photospheric Velocities
The EXPRES Stellar Signals Project II. State of the Field in Disentangling Photospheric Velocities. , keywords =. doi:10.3847/1538-3881/ac5176 , archivePrefix =. 2201.10639 , primaryClass =
work page internal anchor Pith review Pith/arXiv arXiv doi:10.3847/1538-3881/ac5176
-
[3]
Astronomy & Astrophysics , volume=
The generalised Lomb-Scargle periodogram-a new formalism for the floating-mean and Keplerian periodograms , author=. Astronomy & Astrophysics , volume=. 2009 , publisher=
work page 2009
-
[4]
New Methods for Finding Activity-sensitive Spectral Lines: Combined Visual Identification and an Automated Pipeline Find a Set of 40 Activity Indicators. , keywords =. doi:10.3847/1538-3881/aadd94 , archivePrefix =. 1808.09009 , primaryClass =
work page internal anchor Pith review Pith/arXiv arXiv doi:10.3847/1538-3881/aadd94
-
[5]
The spectral impact of magnetic activity on disc-integrated HARPS-N solar observations: exploring new activity indicators. , keywords =. doi:10.1093/mnras/staa1010 , archivePrefix =. 2004.09830 , primaryClass =
work page internal anchor Pith review Pith/arXiv arXiv doi:10.1093/mnras/staa1010 2004
-
[6]
The Changing Face of $\alpha$ Centauri B: Probing plage and stellar activity in K-dwarfs
The changing face of Centauri B: probing plage and stellar activity in K dwarfs. , keywords =. doi:10.1093/mnrasl/slx018 , archivePrefix =. 1702.01647 , primaryClass =
work page internal anchor Pith review Pith/arXiv arXiv doi:10.1093/mnrasl/slx018
-
[7]
ESPRESSO high-resolution transmission spectroscopy of WASP-76 b. , keywords =. doi:10.1051/0004-6361/202039511 , archivePrefix =. 2011.12197 , primaryClass =
-
[8]
Spectroscopic Parameters and atmosphEric ChemIstriEs of Stars (SPECIES). I. Code description and dwarf stars catalogue. , keywords =. doi:10.1051/0004-6361/201731533 , archivePrefix =. 1801.09698 , primaryClass =
work page internal anchor Pith review Pith/arXiv arXiv doi:10.1051/0004-6361/201731533
-
[9]
The PLATO mission. Experimental Astronomy , keywords =. doi:10.1007/s10686-025-09985-9 , archivePrefix =. 2406.05447 , primaryClass =
work page internal anchor Pith review Pith/arXiv arXiv doi:10.1007/s10686-025-09985-9
-
[10]
A Gaussian process framework for modelling stellar activity signals in radial velocity data
A Gaussian process framework for modelling stellar activity signals in radial velocity data. , keywords =. doi:10.1093/mnras/stv1428 , archivePrefix =. 1506.07304 , primaryClass =
work page internal anchor Pith review Pith/arXiv arXiv doi:10.1093/mnras/stv1428
-
[11]
Patterns of Variation for the Sun and Sun-like Stars. , keywords =. doi:10.3847/1538-4357/aaaae3 , adsurl =
-
[12]
Analysis of the public HARPS/ESO spectroscopic archive. Ca II H&K time series for the HARPS radial velocity database. , keywords =. doi:10.1051/0004-6361/202348263 , archivePrefix =. 2311.12438 , primaryClass =
work page internal anchor Pith review Pith/arXiv arXiv doi:10.1051/0004-6361/202348263
-
[13]
ESPRESSO@VLT -- On-sky performance and first results
ESPRESSO at VLT. On-sky performance and first results. , keywords =. doi:10.1051/0004-6361/202038306 , archivePrefix =. 2010.00316 , primaryClass =
work page internal anchor Pith review Pith/arXiv arXiv doi:10.1051/0004-6361/202038306 2010
-
[14]
Identifying Activity-sensitive Spectral Lines: A Bayesian Variable Selection Approach. , keywords =. doi:10.3847/1538-3881/ab441c , adsurl =
-
[15]
HARPS-N Solar Radial-Velocity Variations Are Dominated By Large, Bright Magnetic Regions
HARPS-N Solar RVs Are Dominated by Large, Bright Magnetic Regions. , keywords =. doi:10.3847/1538-4357/ab064a , archivePrefix =. 1902.04184 , primaryClass =
work page internal anchor Pith review Pith/arXiv arXiv doi:10.3847/1538-4357/ab064a 1902
-
[16]
Activity time series of old stars from late F to early K. IV. Limits of the correction of radial velocities using chromospheric emission. , keywords =. doi:10.1051/0004-6361/201935348 , archivePrefix =. 1911.05319 , primaryClass =
work page internal anchor Pith review Pith/arXiv arXiv doi:10.1051/0004-6361/201935348 1911
-
[17]
Unexpectedly strong effect of supergranulation on the detectability of Earth twins orbiting Sun-like stars with radial velocities. , keywords =. doi:10.1051/0004-6361/201935099 , archivePrefix =. 1904.09089 , primaryClass =
work page internal anchor Pith review Pith/arXiv arXiv doi:10.1051/0004-6361/201935099 1904
-
[18]
Activity time series of old stars from late F to early K. III. Diagnosis from photometry. , keywords =. doi:10.1051/0004-6361/201935651 , archivePrefix =. 1909.06566 , primaryClass =
work page internal anchor Pith review Pith/arXiv arXiv doi:10.1051/0004-6361/201935651 1909
-
[19]
Confrontation between modelled solar integrated observables and direct observations. I. Radial velocities and convective blueshift. , keywords =. doi:10.1051/0004-6361/202449146 , archivePrefix =. 2405.10680 , primaryClass =
work page internal anchor Pith review Pith/arXiv arXiv doi:10.1051/0004-6361/202449146
-
[20]
Using the Sun to estimate Earth-like planets detection capabilities . II. Impact of plages. Astronomy & Astrophysics , archivePrefix = "arXiv", eprint =. doi:10.1051/0004-6361/200913551 , adsurl =
-
[21]
The Messenger , year = 2003, month = dec, volume =
Setting New Standards with HARPS. The Messenger , year = 2003, month = dec, volume =
work page 2003
-
[22]
The HARPS search for southern extra-solar planets. XXXI. Magnetic activity cycles in solar-type stars: statistics and impact on precise radial velocities. ArXiv e-prints , archivePrefix = "arXiv", eprint =
-
[23]
The magnetically quiet solar surface dominates HARPS-N solar RVs during low activity
The magnetically quiet solar surface dominates HARPS-N solar RVs during low activity. , keywords =. doi:10.1093/mnras/stad3723 , archivePrefix =. 2311.16076 , primaryClass =
work page internal anchor Pith review Pith/arXiv arXiv doi:10.1093/mnras/stad3723
-
[24]
Investigating stellar activity through eight years of Sun-as-a-star observations
Investigating stellar activity through eight years of Sun-as-a-star observations. , keywords =. doi:10.1093/mnras/stae1313 , archivePrefix =. 2405.12065 , primaryClass =
work page internal anchor Pith review Pith/arXiv arXiv doi:10.1093/mnras/stae1313
-
[25]
Revisiting ϵ Eridani with NEID: Identifying New Activity-sensitive Lines in a Young K Dwarf Star. , keywords =. doi:10.3847/1538-3881/ad0b0b , archivePrefix =. 2311.10677 , primaryClass =
work page internal anchor Pith review Pith/arXiv arXiv doi:10.3847/1538-3881/ad0b0b
-
[26]
Optimizing exoplanet transit searches around low-mass stars with inclination constraints
Optimizing exoplanet transit searches around low-mass stars with inclination constraints. , keywords =. doi:10.1051/0004-6361/201117809 , archivePrefix =. 1110.5840 , primaryClass =
work page internal anchor Pith review Pith/arXiv arXiv doi:10.1051/0004-6361/201117809
-
[27]
The Sun as a planet-host star: Proxies from SDO images for HARPS radial-velocity variations
The Sun as a planet-host star: proxies from SDO images for HARPS radial-velocity variations. , keywords =. doi:10.1093/mnras/stw187 , archivePrefix =. 1601.05651 , primaryClass =
work page internal anchor Pith review Pith/arXiv arXiv doi:10.1093/mnras/stw187
-
[28]
On the Feasibility of Intense Radial Velocity Surveys for Earth-twin Discoveries
On the Feasibility of Intense Radial Velocity Surveys for Earth-Twin Discoveries. , keywords =. doi:10.1093/mnras/sty1464 , archivePrefix =. 1806.00518 , primaryClass =
work page internal anchor Pith review Pith/arXiv arXiv doi:10.1093/mnras/sty1464
-
[29]
Blind search for activity-sensitive lines in the near-infrared using HARPS and NIRPS observations of Proxima and Gl 581. , keywords =. doi:10.1051/0004-6361/202555013 , archivePrefix =. 2507.21262 , primaryClass =
-
[30]
Measuring precise radial velocities on individual spectral lines. I. Validation of the method and application to mitigate stellar activity. , keywords =. doi:10.1051/0004-6361/201833795 , archivePrefix =. 1809.01548 , primaryClass =
work page internal anchor Pith review Pith/arXiv arXiv doi:10.1051/0004-6361/201833795
-
[31]
Radial-velocity fitting challenge. II. First results of the analysis of the data set. , keywords =. doi:10.1051/0004-6361/201628671 , archivePrefix =. 1609.03674 , primaryClass =
work page internal anchor Pith review Pith/arXiv arXiv doi:10.1051/0004-6361/201628671
-
[32]
Stellar surface information from the Ca II H&K lines - I. Intensity profiles of the solar activity components. , keywords =. doi:10.1093/mnras/stad3292 , archivePrefix =. 2310.15926 , primaryClass =
work page internal anchor Pith review Pith/arXiv arXiv doi:10.1093/mnras/stad3292
-
[33]
YARARA: Significant improvement of RV precision through post-processing of spectral time-series
YARARA: Significant improvement in RV precision through post-processing of spectral time series. , keywords =. doi:10.1051/0004-6361/202140986 , archivePrefix =. 2106.07301 , primaryClass =
work page internal anchor Pith review Pith/arXiv arXiv doi:10.1051/0004-6361/202140986
-
[34]
Extreme Precision Radial Velocity Working Group Final Report
Extreme Precision Radial Velocity Working Group Final Report. arXiv e-prints , keywords =. doi:10.48550/arXiv.2107.14291 , archivePrefix =. 2107.14291 , primaryClass =
work page internal anchor Pith review Pith/arXiv arXiv doi:10.48550/arxiv.2107.14291
-
[35]
Long-term stellar activity variations and their effect on radial-velocity measurements
Long-term stellar activity variations and their effect on radial-velocity measurements. , keywords =. doi:10.1093/mnras/stab1183 , archivePrefix =. 2105.01915 , primaryClass =
work page internal anchor Pith review Pith/arXiv arXiv doi:10.1093/mnras/stab1183
-
[36]
Separating planetary reflex Doppler shifts from stellar variability in the wavelength domain
Separating planetary reflex Doppler shifts from stellar variability in the wavelength domain. , keywords =. doi:10.1093/mnras/stab1323 , archivePrefix =. 2011.00018 , primaryClass =
work page internal anchor Pith review Pith/arXiv arXiv doi:10.1093/mnras/stab1323 2011
-
[37]
Three years of Sun-as-a-star radial-velocity observations on the approach to solar minimum
Three years of Sun-as-a-star radial-velocity observations on the approach to solar minimum. , keywords =. doi:10.1093/mnras/stz1215 , archivePrefix =. 1904.12186 , primaryClass =
work page internal anchor Pith review Pith/arXiv arXiv doi:10.1093/mnras/stz1215 1904
-
[38]
Precise Doppler Monitoring of Barnard's Star
Precise Doppler Monitoring of Barnard's Star. , keywords =. doi:10.1088/0004-637X/764/2/131 , archivePrefix =. 1208.2273 , primaryClass =
work page internal anchor Pith review Pith/arXiv arXiv doi:10.1088/0004-637x/764/2/131
-
[39]
Random Forests. Machine Learning , keywords =. doi:10.1023/A:1010933404324 , adsurl =
-
[40]
Three-dimensional simulations of near-surface convection in main-sequence stars. IV. Effect of small-scale magnetic flux concentrations on centre-to-limb variation and spectral lines. , keywords =. doi:10.1051/0004-6361/201525874 , archivePrefix =. 1505.04744 , primaryClass =
work page internal anchor Pith review Pith/arXiv arXiv doi:10.1051/0004-6361/201525874
-
[41]
Three-dimensional simulations of near-surface convection in main-sequence stars. III. The structure of small-scale magnetic flux concentrations. , keywords =. doi:10.1051/0004-6361/201525788 , archivePrefix =. 1505.04739 , primaryClass =
work page internal anchor Pith review Pith/arXiv arXiv doi:10.1051/0004-6361/201525788
-
[42]
Plato Mission Conference 2021 , year = 2021, month = oct, eid =
HARPS3 and opportunities for RV follow-up of PLATO targets. Plato Mission Conference 2021 , year = 2021, month = oct, eid =. doi:10.5281/zenodo.5565004 , adsurl =
-
[43]
Stellar signal components seen in HARPS and HARPS-N solar radial velocities
Stellar signal components seen in HARPS and HARPS-N solar radial velocities. , keywords =. doi:10.1051/0004-6361/202244663 , archivePrefix =. 2211.04251 , primaryClass =
work page internal anchor Pith review Pith/arXiv arXiv doi:10.1051/0004-6361/202244663
- [44]
-
[45]
The effects of granulation and supergranulation on Earth-mass planet detectability in the habitable zone around F6-K4 stars. , keywords =. doi:10.1051/0004-6361/202038376 , archivePrefix =. 2008.11952 , primaryClass =
work page internal anchor Pith review Pith/arXiv arXiv doi:10.1051/0004-6361/202038376 2008
-
[46]
Gaussian Process regression for astronomical time-series
Gaussian Process Regression for Astronomical Time Series. , keywords =. doi:10.1146/annurev-astro-052920-103508 , archivePrefix =. 2209.08940 , primaryClass =
work page internal anchor Pith review Pith/arXiv arXiv doi:10.1146/annurev-astro-052920-103508
-
[47]
Principles of optics : electromagnetic theory of propagation, interference and diffraction of light
-
[48]
No planet for HD 166435. , keywords =. doi:10.1051/0004-6361:20011308 , archivePrefix =. astro-ph/0109491 , primaryClass =
work page internal anchor Pith review Pith/arXiv arXiv doi:10.1051/0004-6361:20011308
-
[49]
Embarking on a trek across the exo-Neptunian landscape with the TOI-421 system
ATREIDES: I. Embarking on a trek across the exo-Neptunian landscape with the TOI-421 system. , keywords =. doi:10.1051/0004-6361/202554856 , archivePrefix =. 2509.15746 , primaryClass =
-
[50]
Unsigned magnetic flux proxy from solar optical intensity spectra
Unsigned magnetic flux proxy from solar optical intensity spectra. , keywords =. doi:10.1093/mnras/stad1343 , archivePrefix =. 2305.03522 , primaryClass =
work page internal anchor Pith review Pith/arXiv arXiv doi:10.1093/mnras/stad1343
-
[51]
Costes, Jean, C. and Watson, Christopher, A. and de Mooij, Ernst and Hobbs, Katlyn L. and Yaptangco, Dana Clarice, S. and Unruh, Yvonne, C. and Bedell, Megan and Meunier, Nad
-
[52]
Sensitivity of spectral lines to granulation: The Sun
Sensitivity of Spectral Lines to Granulation: The Sun. , keywords =. doi:10.3847/1538-4357/ae6102 , archivePrefix =. 2509.09824 , primaryClass =
work page internal anchor Pith review Pith/arXiv arXiv doi:10.3847/1538-4357/ae6102
discussion (0)
Sign in with ORCID, Apple, or X to comment. Anyone can read and Pith papers without signing in.