REVIEW 4 major objections 5 minor 36 references
A small Transformer encoder can be mapped onto a low-cost FPGA to score single time-series points for anomalies in tens of microseconds, about ten times faster than the same model on a CPU.
Reviewed by Pith at T0; open to challenge. T0 means a machine referee read the full paper against a public rubric. the ladder, T0–T4 →
T0 review · deepseek-v4-flash
2026-08-01 05:20 UTC pith:TAJOWRID
load-bearing objection Useful HLS reference for small transformers on PYNQ-Z2, but the headline 10x speedup compares synthesis numbers to measured software, and the accuracy claim contradicts the paper's own table. the 4 major comments →
Optimizing Transformer Neural Network for Real-Time Outlier Detection on FPGAs
The pith
A machine-rendered reading of the paper's core claim, the machinery that carries it, and where it could break.
Core claim
The paper's central claim is that a minimally tuned Transformer encoder—with positional encoding and layer normalization disabled—can be implemented on a low-cost PYNQ-Z2 FPGA with enough parallelism that point-anomaly inference latency drops to 37.14 μs (vanilla) and 29.86 μs (linear attention), versus roughly 353–365 μs on CPU, a speedup of about 10x. It further claims that these transformer models match or beat a handcrafted-feature linear-regression baseline on labeled anomaly-detection datasets (KPI, NAB) and on FI2010 limit-order data with injected point anomalies, and that the FPGA provides deterministic latency unlike CPU and GPU, whose single-sample inference times vary substantiall
What carries the argument
The enabling mechanism is high-level synthesis (HLS) loop optimization: all matrix multiplications use a pipelined middle loop ('loop j') with complete array partitioning, activation loops are fully unrolled, data is kept in float32 (double would not fit on the board), and softmax is made numerically stable by subtracting the row maximum. The linear-attention variant replaces softmax with a kernel feature map so that attention becomes O(N) instead of O(N^2), computing the key–value product once and reusing it across queries; this is why it reaches lower latency, though at higher resource cost.
Load-bearing premise
The load-bearing premise is that the cycle counts reported by Vitis HLS synthesis translate directly into real end-to-end inference latency on the PYNQ-Z2 board, with no significant overhead from data I/O, clocks, or memory contention.
What would settle it
Run the released HLS design on a physical PYNQ-Z2 and measure wall-clock latency for one sample, including transfer to and from the board, under sustained memory traffic; if latency materially exceeds 29.86/37.14 μs or is no longer constant, the claimed deterministic 10x speedup collapses. A second check is a post-place-and-route timing report: 99% LUT utilization for the linear transformer may make the target clock unachievable.
If this is right
- Transformer-based anomaly detection can move to edge devices with fixed worst-case latency, which matters for streaming financial data cleaning.
- The resource/latency trade-off is quantified: the vanilla model runs in 37.14 μs on 90% LUTs; the linear-attention model runs in 29.86 μs but uses 99% LUTs and 43% FFs.
- Untuned Transformer encoders are a viable baseline that outperforms handcrafted-feature linear regression on point anomalies.
- CPU/GPU single-sample inference has high variance (standard deviations of 110–323 μs), while the FPGA implementation has deterministic timing, shifting the practical comparison toward latency guarantees.
- The HLS optimizations form a reusable reference implementation for mapping small transformer workloads onto FPGAs.
Where Pith is reading between the lines
- Editorial: The latencies come from Vitis HLS synthesis reports, not from measurements on the physical board; once data I/O, clock-domain crossing, and memory contention are included, the realized speedup may shrink, so board-level measurement is the next test.
- Editorial: Because positional encoding was removed after it destabilized training, the paper leaves open whether order information matters for point anomalies in short windows; adding it back with longer windows is a direct testable extension.
- Editorial: Since no publicly labeled financial-market anomaly dataset exists, the FI2010 result depends on injected synthetic outliers; performance on naturally occurring market anomalies remains an open question.
- Editorial: The linear-attention variant's latency gain over the vanilla model is modest (29.86 vs. 37.14 μs) while resource use jumps to 99% LUTs, so on a larger FPGA the vanilla transformer may offer more headroom for longer sequences.
Editorial analysis
A structured set of objections, weighed in public.
Referee Report
Summary. The paper describes an HLS-based FPGA implementation of two small Transformer encoders (vanilla and linear attention) for supervised point-anomaly detection on financial time series. It evaluates accuracy on NAB, KPI, and FI2010 (with synthetic outliers) against a linear regression baseline, and compares FPGA inference latency from Vitis HLS synthesis reports to CPU/GPU measurements, reporting a ~10x speedup.
Significance. If the reported FPGA latencies are reproducible on hardware, the paper offers a useful, openly available reference design for low-latency Transformer inference on a low-cost FPGA, with a clear tutorial on HLS loop pipelining, array partitioning, and numerical stabilization. The analysis of resource/latency trade-offs is informative. However, the central speedup claim rests entirely on synthesis estimates rather than board measurements, and the accuracy comparison contains a factual overstatement contradicted by the paper's own Table 2. The contribution is therefore conditional on additional verification.
major comments (4)
- [§5.4 / Table 3] The 10x speedup and the deterministic-latency claim are based on Vitis HLS synthesis latencies (3714 and 2986 cycles) from §4.2.1–4.2.2, not on measurements from a physical PYNQ-Z2 board. Remark 4.10 concedes that simulation 'might not capture all aspects of hardware behavior, such as timing delays.' At 90% and 99% LUT utilization, post-placement timing closure at the assumed clock frequency is not assured; the paper never states the target clock frequency. I/O, AXI handshakes, and memory contention are excluded. Please provide on-board end-to-end latency measurements (or at least post-placement timing results and a bitstream test).
- [§5.3.3, Table 2] The text states 'The Transformer model outperforms the other models on all datasets.' Table 2 contradicts this: on FI2010, Linear Regression achieves F1 0.24/0.27 while Transformer achieves 0.06/0.14. Moreover, the table reports only train/validation metrics, not held-out test metrics. Please correct the overclaim and report test-set metrics with a defined split.
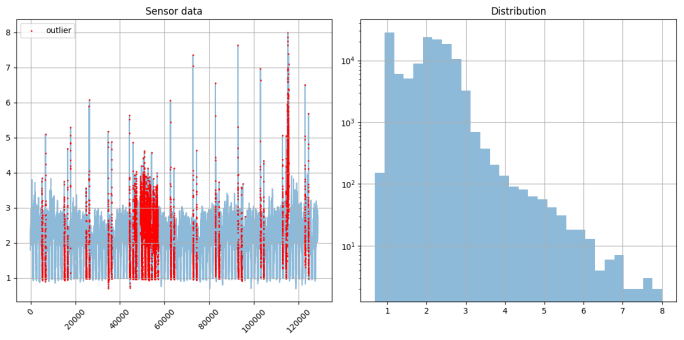
- [§5.2.3] The synthetic outlier injection procedure for FI2010 omits the contamination fraction n and the magnitude parameter ρ. Without these, the anomaly-detection task is not reproducible and the reported F1 scores cannot be compared with other studies. Please report n and ρ (or the full protocol).
- [§5.4, Table 3] The comparison is asymmetric: CPU/GPU latencies measured over 10,000 runs include data transfer and framework overhead, while FPGA numbers are pure synthesis compute latency. A fair speedup comparison requires measuring the same end-to-end inference path on all devices (or clearly stating what is included).
minor comments (5)
- [§2.2, Definition 2.2] Definition 2.2 writes x_i = x_{i−1} − x_i, which is the negative of the usual difference; please correct to x_i − x_{i−1}.
- [§3.2.1] In the dot-product attention description, α_ij = softmax(q_i · v_i) should read q_i · k_j.
- [§4.2.1] The conversion from cycles to microseconds (3714 cycles = 37.14 μs) implies a 100 MHz clock; state the target clock frequency explicitly.
- [Table 2 caption] Typo: 'The reported value are' should be 'The reported values are'.
- [§3.3] Typo: 'time-sereis' should be 'time-series'.
Circularity Check
No circular derivation; the FPGA speedup claim rests on HLS synthesis reports and empirical CPU/GPU measurements, not on a fitted parameter or self-consistency.
full rationale
The paper's central results are empirical performance claims, not derivations. Accuracy is evaluated by training transformer and linear-regression models on standard labeled benchmarks (NAB, KPI, FI2010) and reporting metrics; no quantity is fitted to the target metric and then renamed a prediction. The FPGA latencies (3714 cycles/37.14 μs for the vanilla transformer, 2986 cycles/29.86 μs for the linear transformer, §4.2.1–4.2.2) are taken from Vitis HLS synthesis reports, while CPU and GPU latencies come from 10,000-run empirical measurements (§5.4, Appendix B). Comparing synthesis cycle counts to measured end-to-end latencies may be unfair or unvalidated, and Remark 4.10 concedes that simulation 'might not capture all aspects of hardware behavior, such as timing delays.' However, unequal measurement methodology is a correctness/validation concern, not circularity: the FPGA latency is not derived from the CPU latency, nor does it presuppose the claimed 10x speedup. The transformer and linear-attention equations are standard prior results cited to [10], [11], and [18]; the paper does not redefine any quantity in terms of its own output, and no load-bearing self-citation appears (the reference list contains no works by the present authors). There is no step in which an output is equivalent to an input by construction, so no circularity is found.
Axiom & Free-Parameter Ledger
free parameters (4)
- Transformer hyperparameters (window size, heads, FFN dim, blocks) =
window=8, heads=8, FFN=16, blocks=2 (vanilla) / 1 (linear)
- Learning rate =
not reported (found via LR finder [27])
- Positive-class loss weight =
5
- Synthetic outlier injection parameters (n, ρ) =
not reported
axioms (3)
- domain assumption HLS synthesis cycle counts accurately predict physical FPGA inference latency
- domain assumption Synthetic point anomalies injected into FI2010 are representative of real anomalies
- ad hoc to paper Removing positional encoding and layer normalization still yields a 'Transformer' whose performance reflects the architecture
read the original abstract
In this work, we explore how the inference time of a Transformer Neural Network can be efficiently optimized with applications to real-time anomaly detection in financial time series. The financial time series are price series such as asset prices. Unfortunately, the data is often with errors or outliers that make the downstream data processing tasks useless, unstable or even harmful. Moreover, the amount of financial time-series data has been significantly increasing. Hence, there is a need for better data-cleaning methods in terms of accuracy and in terms of processing speed. Transformers as a neural network architecture have achieved superior performances in many tasks such as Natural Language Processing and Computer Vision. Time series modelling and especially anomaly detection tasks can benefit from the features of transformers architecture in multiple ways, including the capacity to capture long-range dependencies and interactions. Increasingly powerful hardware, such as field-programmable gate arrays (FPGAs), have seen increasing usage in recent years due to their reconfigurability and high performance. They can be efficiently utilized to speed up the computations of the Transformer architecture. We explore different Transformer architectures for time series modelling and how they can be efficiently implemented on an FPGA board (PYNQ-Z2). In particular, we examine the application of Transformers to detect anomalies in time series and we show how they can be efficiently implemented on an FPGA board to minimize latency. The code is available at https://github.com/thxi/icl_thesis
Figures







Reference graph
Works this paper leans on
-
[1]
High frequency data filtering
Thomas Neil Falkenberry CF A. High frequency data filtering. https://www.tickdata.com/whitepaper/high-frequency-data-filtering, Sep 2008
2008
-
[2]
Owen Vallis, Jordan Hochenbaum, and Twitter. Introduc- ing practical and robust anomaly detection in a time se- ries.https://blog.twitter.com/engineering/en_us/a/2015/ introducing-practical-and-robust-anomaly-detection-in-a-time-series
2015
-
[3]
Anomaly detection on big data in financial markets
Mohiuddin Ahmed, Nazim Choudhury, and Shahadat Uddin. Anomaly detection on big data in financial markets. In2017 IEEE/ACM Interna- tional Conference on Advances in Social Networks Analysis and Mining (ASONAM), pages 998–1001, 2017
2017
-
[4]
Overview of the transformer-based models for nlp tasks
Anthony Gillioz, Jacky Casas, Elena Mugellini, and Omar Abou Khaled. Overview of the transformer-based models for nlp tasks. In2020 15th Con- ference on Computer Science and Information Systems (FedCSIS), pages 179–183, 2020
2020
-
[5]
Transformers in time series: A survey
Qingsong Wen, Tian Zhou, Chaoli Zhang, Weiqi Chen, Ziqing Ma, Junchi Yan, and Liang Sun. Transformers in time series: A survey. 2022
2022
-
[6]
Custom framework for run-time trading strategies
Andreea-Ingrid Funie, Liucheng Guo, Xinyu Niu, Wayne Luk, and Mark Salmon. Custom framework for run-time trading strategies. In Stephan Wong, Antonio Carlos Beck, Koen Bertels, and Luigi Carro, editors,Ap- plied Reconfigurable Computing, pages 154–167, Cham, 2017. Springer In- ternational Publishing
2017
-
[7]
Evaluation metrics for un- supervised learning algorithms, 2019
Julio-Omar Palacio-Ni˜ no and Fernando Berzal. Evaluation metrics for un- supervised learning algorithms, 2019. 35
2019
-
[8]
Generating artificial outliers in the absence of genuine ones — a survey.ACM Transactions on Knowledge Discovery from Data (TKDD), 15:1 – 37, 2020
Georg Steinbuss and Klemens B¨ ohm. Generating artificial outliers in the absence of genuine ones — a survey.ACM Transactions on Knowledge Discovery from Data (TKDD), 15:1 – 37, 2020
2020
-
[9]
Anomaly detection in time series: A comprehensive evaluation.Proc
Sebastian Schmidl, Phillip Wenig, and Thorsten Papenbrock. Anomaly detection in time series: A comprehensive evaluation.Proc. VLDB Endow., 15:1779–1797, 2022
2022
-
[10]
Neural machine translation by jointly learning to align and translate, 2014
Dzmitry Bahdanau, Kyunghyun Cho, and Yoshua Bengio. Neural machine translation by jointly learning to align and translate, 2014
2014
-
[11]
Gomez, Lukasz Kaiser, and Illia Polosukhin
Ashish Vaswani, Noam Shazeer, Niki Parmar, Jakob Uszkoreit, Llion Jones, Aidan N. Gomez, Lukasz Kaiser, and Illia Polosukhin. Attention is all you need, 2017
2017
-
[12]
Bert: Pre-training of deep bidirectional transformers for language understanding
Jacob Devlin, Ming-Wei Chang, Kenton Lee, and Kristina Toutanova. Bert: Pre-training of deep bidirectional transformers for language understanding. ArXiv, abs/1810.04805, 2019
Pith/arXiv arXiv 2019
-
[13]
Yungi Jeong, Eu-Hui Yang, Jung Hyun Ryu, Imseong Park, and Myung joo Kang. Anomalybert: Self-supervised transformer for time series anomaly detection using data degradation scheme.ArXiv, abs/2305.04468, 2023
Pith/arXiv arXiv 2023
-
[14]
Position informa- tion in transformers: An overview.Computational Linguistics, 48:733–763, 2021
Philipp Dufter, Martin Schmitt, and Hinrich Sch¨ utze. Position informa- tion in transformers: An overview.Computational Linguistics, 48:733–763, 2021
2021
-
[15]
The transformer family version 2.0.https://lilianweng
Lilian Weng. The transformer family version 2.0.https://lilianweng. github.io/posts/2023-01-27-the-transformer-family-v2, Jan 2023
2023
-
[16]
Deep residual learning for image recognition, 2015
Kaiming He, Xiangyu Zhang, Shaoqing Ren, and Jian Sun. Deep residual learning for image recognition, 2015
2015
-
[17]
Jimmy Lei Ba, Jamie Ryan Kiros, and Geoffrey E. Hinton. Layer normal- ization, 2016
2016
-
[18]
Transformers are rnns: Fast autoregressive transformers with lin- ear attention, 2020
Angelos Katharopoulos, Apoorv Vyas, Nikolaos Pappas, and Fran¸ cois Fleuret. Transformers are rnns: Fast autoregressive transformers with lin- ear attention, 2020
2020
-
[19]
TranAD: Deep Transformer Networks for Anomaly Detection in Multivariate Time Series Data.Proceedings of VLDB, 15(6):1201–1214, 2022
Shreshth Tuli, Giuliano Casale, and Nicholas R Jennings. TranAD: Deep Transformer Networks for Anomaly Detection in Multivariate Time Series Data.Proceedings of VLDB, 15(6):1201–1214, 2022
2022
-
[20]
Are transformers effective for time series forecasting?, 2022
Ailing Zeng, Muxi Chen, Lei Zhang, and Qiang Xu. Are transformers effective for time series forecasting?, 2022
2022
-
[21]
Time series forecasting with transformer models and application to asset management.SSRN Electronic Journal, 2023
Edmond Lezmi and Jiali Xu. Time series forecasting with transformer models and application to asset management.SSRN Electronic Journal, 2023. 36
2023
-
[22]
Vitis HLS Knowledge Base - Real-Time Systems - York Wiki Service.https://wiki.york.ac.uk/display/RTS/Vitis+HLS+ Knowledge+Base, July 2020
University of York. Vitis HLS Knowledge Base - Real-Time Systems - York Wiki Service.https://wiki.york.ac.uk/display/RTS/Vitis+HLS+ Knowledge+Base, July 2020
2020
-
[23]
Vitis High-Level Synthesis User Guide.https://docs.xilinx
Xilinx Inc. Vitis High-Level Synthesis User Guide.https://docs.xilinx. com/r/en-US/ug1399-vitis-hls/Design-Principles, May 2023
2023
-
[24]
C/RTL Co-Simulation in Vitis HLS
Xilinx Inc. C/RTL Co-Simulation in Vitis HLS. https://docs.xilinx.com/r/en-US/ug1399-vitis-hls/C/ RTL-Co-Simulation-in-Vitis-HLS, July 2023
2023
-
[25]
Vitis hls: Pipelining loops.https://docs.xilinx.com/r/ en-US/ug1399-vitis-hls/Design-Principles, May 2023
Xilinx Inc. Vitis hls: Pipelining loops.https://docs.xilinx.com/r/ en-US/ug1399-vitis-hls/Design-Principles, May 2023
2023
-
[26]
Intel high level synthesis: Best practices guide.https: //www.intel.com/content/www/us/en/docs/programmable/683152/ 21-3/pipeline-loops.html
Intel. Intel high level synthesis: Best practices guide.https: //www.intel.com/content/www/us/en/docs/programmable/683152/ 21-3/pipeline-loops.html
-
[27]
Leslie N. Smith. Cyclical learning rates for training neural networks, 2015
2015
-
[28]
Diederik P. Kingma and Jimmy Ba. Adam: A method for stochastic opti- mization.CoRR, abs/1412.6980, 2014
Pith/arXiv arXiv 2014
-
[29]
Learningratefinder — pytorch lightning 2.0.7 documen- tation.https://lightning.ai/docs/pytorch/stable/api/lightning
lightning.ai. Learningratefinder — pytorch lightning 2.0.7 documen- tation.https://lightning.ai/docs/pytorch/stable/api/lightning. pytorch.callbacks.LearningRateFinder.html, Aug 2023
2023
-
[30]
On the difficulty of training recurrent neural networks, 2012
Razvan Pascanu, Tomas Mikolov, and Yoshua Bengio. On the difficulty of training recurrent neural networks, 2012
2012
-
[31]
I. J. Good. Rational decisions.Journal of the Royal Statistical Society: Series B (Methodological), 14(1):107–114, Jan 1952
1952
-
[32]
Pedregosa, G
F. Pedregosa, G. Varoquaux, A. Gramfort, V. Michel, B. Thirion, O. Grisel, M. Blondel, P. Prettenhofer, R. Weiss, V. Dubourg, J. Vanderplas, A. Pas- sos, D. Cournapeau, M. Brucher, M. Perrot, and E. Duchesnay. Scikit- learn: Machine learning in Python.Journal of Machine Learning Research, 12:2825–2830, 2011
2011
-
[33]
Unsu- pervised real-time anomaly detection for streaming data.Neurocomputing, 262:134–147, 11 2017
Subutai Ahmad, Alexander Lavin, Scott Purdy, and Zuha Agha. Unsu- pervised real-time anomaly detection for streaming data.Neurocomputing, 262:134–147, 11 2017. [Online; accessed 2023-07-19]
2017
-
[34]
Constructing large-scale real-world benchmark datasets for aiops, 2022
Zeyan Li, Nengwen Zhao, Shenglin Zhang, Yongqian Sun, Pengfei Chen, Xidao Wen, Minghua Ma, and Dan Pei. Constructing large-scale real-world benchmark datasets for aiops, 2022
2022
-
[35]
Benchmark dataset for mid-price forecasting of limit order book data with machine learning methods
Adamantios Ntakaris, Martin Magris, Juho Kanniainen, Moncef Gabbouj, and Alexandros Iosifidis. Benchmark dataset for mid-price forecasting of limit order book data with machine learning methods. 2017. 37
2017
-
[36]
Anomaly Detection in Financial Time Series by Principal Component Anal- ysis and Neural Networks.Algorithms, 15(10):385, oct 19 2022
St´ ephane Cr´ epey, Noureddine Lehdili, Nisrine Madhar, and Maud Thomas. Anomaly Detection in Financial Time Series by Principal Component Anal- ysis and Neural Networks.Algorithms, 15(10):385, oct 19 2022. [Online; accessed 2023-07-19]. 38 A Training plots The training plots are presented in Figures 19, 20, 21, 22, 23, 24. Figure 19: Training metrics fo...
2022
discussion (0)
Sign in with ORCID, Apple, or X to comment. Anyone can read and Pith papers without signing in.