Field Theory of Data: Anomaly Detection via the Functional Renormalization Group. The 2D Ising Model as a Benchmark
Pith reviewed 2026-05-25 06:41 UTC · model grok-4.3
The pith
Anomaly detection in noisy data corresponds to renormalization group flow in non-equilibrium field theories, with noise-to-signal ratio acting as temperature.
A machine-rendered reading of the paper's core claim, the machinery that carries it, and where it could break.
Core claim
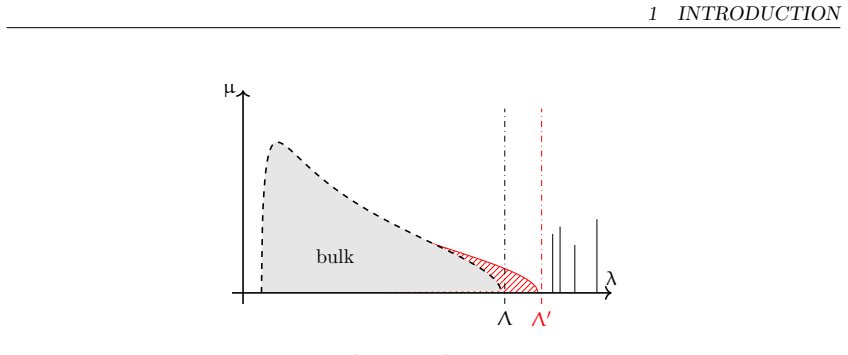
The detection of phase transitions in interacting non-equilibrium systems maps to the study of an effective equilibrium field theory near its Gaussian fixed point, identified with the universal Marchenko-Pastur distribution. The noise-to-signal ratio acts as a physical temperature, and the signal emerges as ordered domains within a thermalized background of fluctuations.
What carries the argument
Functional renormalization group flow applied to the two-dimensional Model A, which tracks how increasing the noise-to-signal ratio drives the system through the critical point.
If this is right
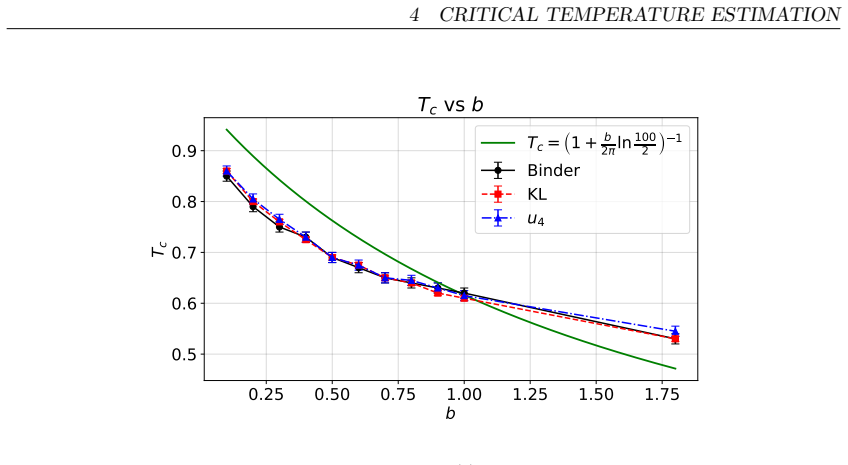
- Critical thresholds in interacting systems can be located to within 4 percent error by following the renormalization-group trajectory.
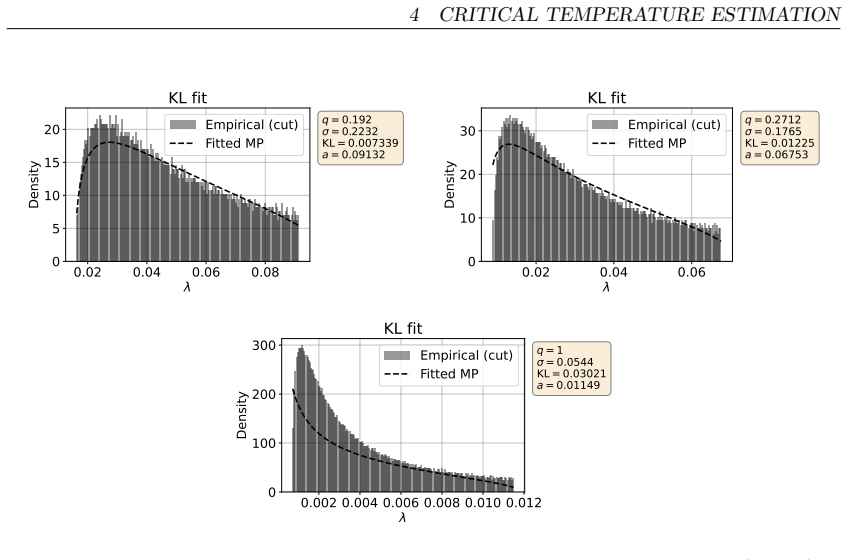
- The approach outperforms the Kullback-Leibler divergence when identifying transitions in the same benchmark data.
- A single universal strategy becomes available for extracting structure from complex datasets that sit near criticality.
Where Pith is reading between the lines
- The same mapping could be tested on datasets whose underlying dynamics are not Ising-like, to check whether the Marchenko-Pastur identification remains useful.
- If the temperature analogy holds, standard field-theory scaling relations might directly predict how anomaly-detection performance changes with data size or dimensionality.
- Random-matrix features already known to appear in high-dimensional data would then acquire a dynamical interpretation through the renormalization-group flow.
Load-bearing premise
The assumption that the noise-to-signal ratio functions exactly as a physical temperature, so that the signal forms ordered domains inside a fluctuating background.
What would settle it
A direct numerical check in which the renormalization-group trajectory for the two-dimensional Ising model fails to recover the known Onsager critical value within the stated accuracy when the noise-to-signal ratio is varied.
Figures


read the original abstract
We establish a correspondence between anomaly detection in high-noise regimes and the renormalization group flow of non-equilibrium field theories. We provide a physical grounding for this framework by proving that the detection of phase transitions in interacting non-equilibrium systems maps to the study of an effective equilibrium field theory near its Gaussian fixed point, which we identify with the universal Marchenko-Pastur distribution. Applying the Functional Renormalization Group to the two-dimensional Model A, we demonstrate that the noise-to-signal ratio acts as a physical temperature, where the signal emerges as ordered domains within a thermalized background of fluctuations. Using the exact Onsager solution as a benchmark, we show that this approach identifies critical thresholds with an error below 4%, significantly outperforming standard information-theoretic metrics such as the Kullback-Leibler divergence. Our results provide a universal strategy for resolving structures in complex datasets near criticality, bridging the gap between statistical mechanics and statistical inference.
Editorial analysis
A structured set of objections, weighed in public.
Referee Report
Summary. The paper claims to establish a correspondence between anomaly detection in high-noise regimes and the renormalization group flow of non-equilibrium field theories. It asserts a proof that detection of phase transitions in interacting non-equilibrium systems maps to the study of an effective equilibrium field theory near its Gaussian fixed point, identified with the universal Marchenko-Pastur distribution. Applying the Functional Renormalization Group to the two-dimensional Model A, the noise-to-signal ratio is shown to act as a physical temperature with the signal emerging as ordered domains in a thermalized background. Using the exact Onsager solution for the 2D Ising model as benchmark, critical thresholds are identified with error below 4%, outperforming the Kullback-Leibler divergence.
Significance. If the mapping and its derivation hold, the work offers a novel bridge between statistical mechanics tools (FRG) and statistical inference for anomaly detection near criticality, with the benchmark against an exact solution providing a concrete test. The identification of the Gaussian fixed point with Marchenko-Pastur and the temperature analogy could enable universal strategies if substantiated, but the absence of explicit steps undermines immediate assessment of novelty or correctness.
major comments (3)
- [Abstract] Abstract: the assertion of a 'proof' of the mapping from non-equilibrium phase transition detection to an effective equilibrium field theory near the Gaussian fixed point (identified with Marchenko-Pastur) is not accompanied by any derivation steps, explicit FRG equations, or reduction showing how the non-equilibrium dynamics yield this equivalence.
- [Abstract] The central claim that varying the noise-to-signal ratio in the FRG equations for 2D Model A drives the system across the phase transition exactly as temperature does in the equilibrium Ising model (matching Onsager value within <4%) requires an explicit demonstration that the FRG truncation produces this equivalence; no such steps or error analysis are provided.
- [Abstract] Abstract: the benchmark result of <4% error on critical thresholds and outperformance of KL divergence is stated without data details, fitting procedure, or comparison methodology, preventing verification that the result is not circular in the noise-to-signal parameter.
minor comments (2)
- Clarify the precise truncation scheme used in the FRG application to Model A and how the Marchenko-Pastur law emerges as the fixed-point distribution.
- Provide the explicit definition of the noise-to-signal ratio and its mapping to the temperature parameter in the effective theory.
Simulated Author's Rebuttal
We thank the referee for their review. We clarify below that the detailed proofs, derivations, and benchmark procedures are contained in the main text, with the abstract serving as a high-level summary. We address each major comment.
read point-by-point responses
-
Referee: [Abstract] Abstract: the assertion of a 'proof' of the mapping from non-equilibrium phase transition detection to an effective equilibrium field theory near the Gaussian fixed point (identified with Marchenko-Pastur) is not accompanied by any derivation steps, explicit FRG equations, or reduction showing how the non-equilibrium dynamics yield this equivalence.
Authors: The proof of the mapping is provided in Section 2, including the reduction of non-equilibrium dynamics to the effective equilibrium field theory near the Gaussian fixed point and its identification with the Marchenko-Pastur distribution. Explicit FRG equations are derived in Section 3. We will update the abstract to reference these sections. revision: partial
-
Referee: [Abstract] The central claim that varying the noise-to-signal ratio in the FRG equations for 2D Model A drives the system across the phase transition exactly as temperature does in the equilibrium Ising model (matching Onsager value within <4%) requires an explicit demonstration that the FRG truncation produces this equivalence; no such steps or error analysis are provided.
Authors: An explicit demonstration of the FRG truncation for 2D Model A and the role of the noise-to-signal ratio as temperature is given in Section 4, along with the error analysis showing agreement with the Onsager solution within <4%. revision: no
-
Referee: [Abstract] Abstract: the benchmark result of <4% error on critical thresholds and outperformance of KL divergence is stated without data details, fitting procedure, or comparison methodology, preventing verification that the result is not circular in the noise-to-signal parameter.
Authors: Section 5 details the benchmark procedure, data from the 2D Ising model, fitting of critical thresholds, and comparison to KL divergence. The analysis is not circular as the critical point is determined from the FRG flow independently, benchmarked against the exact Onsager solution. revision: no
Circularity Check
No significant circularity; derivation self-contained against external benchmark
full rationale
The paper applies the FRG to 2D Model A, identifies the noise-to-signal ratio with temperature via an effective equilibrium mapping, and benchmarks the resulting critical thresholds directly against the independent exact Onsager solution (error <4%). This external validation, together with explicit comparison to Kullback-Leibler divergence, keeps the central correspondence falsifiable and independent of any fitted parameter or self-citation chain. No equations or steps in the provided text reduce a claimed prediction to an input by construction.
Axiom & Free-Parameter Ledger
axioms (2)
- domain assumption The noise-to-signal ratio acts as a physical temperature where the signal emerges as ordered domains within a thermalized background of fluctuations.
- ad hoc to paper Detection of phase transitions in interacting non-equilibrium systems maps to an effective equilibrium field theory near its Gaussian fixed point identified with the Marchenko-Pastur distribution.
Reference graph
Works this paper leans on
-
[1]
S Bradde and W Bialek. “PCA meets RG.”Journal of statistical physics167 (2017), 462–475.doi:10. 1007/s10955-017-1770-6
work page 2017
-
[2]
Generalized scale behavior and renormalization group for data analysis
V Lahoche, D Ousmane Samary, and M Tamaazousti. “Generalized scale behavior and renormalization group for data analysis.”Journal of Statistical Mechanics: Theory and Experiment2022.3 (Mar. 2022), 033101.doi:10.1088/1742-5468/ac52a6
-
[3]
V Lahoche, D Ousmane Samary, and M Tamaazousti. “Field Theoretical Approach for Signal Detection in Nearly Continuous Positive Spectra I: Matricial Data.”Entropy23.9 (2021).doi:10.3390/e23091132
-
[4]
V Lahoche, M Ouerfelli, D Ousmane Samary, and M Tamaazousti. “Field Theoretical Approach for Signal Detection in Nearly Continuous Positive Spectra II: Tensorial Data.”Entropy23.7 (2021).doi:10.3390/ e23070795
work page 2021
-
[5]
Signal Detection in Nearly Continuous Spectra and Z2-Symmetry Breaking
V Lahoche, D Ousmane Samary, and M Tamaazousti. “Signal Detection in Nearly Continuous Spectra and Z2-Symmetry Breaking.”Symmetry14.3 (2022), 486.doi:10.3390/sym14030486. arXiv:2011.05447
-
[6]
Functionalrenormalizationgroupapproachforsignal detection
VLahoche,DOusmaneSamary,andMTamaazousti.“Functionalrenormalizationgroupapproachforsignal detection.”SciPost Phys. Core7 (2024), 077.doi:10.21468/SciPostPhysCore.7.4.077. arXiv:2201.04250
-
[7]
Functional renormalization group for signal detection and stochastic ergodicity breaking
H Erbin, R Finotello, BW Kpera, V Lahoche, and D Ousmane Samary. “Functional renormalization group for signal detection and stochastic ergodicity breaking.”J. Stat. Mech.2024.8 (2024), 083203.doi:10.1088/ 1742-5468/ad5c5c
work page 2024
-
[8]
R Finotello, V Lahoche, and D Ousmane Samary. “Functional renormalisation for signal detection: dimen- sional analysis and dimensional phase transition for nearly continuous spectra effective field theory.”Journal of Statistical Mechanics: Theory and Experiment2026.4 (2026), 043403.doi:10.1088/1742-5468/ae5a21. arXiv:2507.01064
work page internal anchor Pith review Pith/arXiv arXiv doi:10.1088/1742-5468/ae5a21 2026
-
[9]
Cambridge University Press, 2017.doi:10.1017/9781107278974
R Livi and P Politi.Nonequilibrium statistical physics: a modern perspective. Cambridge University Press, 2017.doi:10.1017/9781107278974
-
[10]
Spectral analysis of finite-time correlation matrices near equilibrium phase transitions
Vinayak, T Prosen, B Buča, and TH Seligman. “Spectral analysis of finite-time correlation matrices near equilibrium phase transitions.”Europhysics Letters108.2 (Oct. 2014), 20006.doi:10.1209/0295- 5075/ 108/20006
-
[11]
Denoising of diffusion MRI using random matrix theory
J Veraart, DS Novikov, D Christiaens, B Ades-aron, J Sijbers, and E Fieremans. “Denoising of diffusion MRI using random matrix theory.”NeuroImage142 (2016), 394–406.doi:10.1016/j.neuroimage.2016.08.016
-
[12]
Cambridge University Press, 2020.doi:10.1017/9781108768900
M Potters and JP Bouchaud.A First Course in Random Matrix Theory: for Physicists, Engineers and Data Scientists. Cambridge University Press, 2020.doi:10.1017/9781108768900
-
[13]
Noise Dressing of Financial Correlation Matrices
L Laloux, P Cizeau, JP Bouchaud, and M Potters. “Noise Dressing of Financial Correlation Matrices.” Phys. Rev. Lett.83 (7 1999), 1467–1470.doi:10.1103/PhysRevLett.83.1467
-
[14]
Randommatrixtheoryandfinancialcorrelations
LLaloux,PCizeau,MPotters,andJPBouchaud.“Randommatrixtheoryandfinancialcorrelations.”Inter- national Journal of Theoretical and Applied Finance03.03(2000),391–397.doi:10.1142/s0219024900000255
-
[15]
Cleaning large correlation matrices: Tools from Random Matrix Theory
J Bun, JP Bouchaud, and M Potters. “Cleaning large correlation matrices: Tools from Random Matrix Theory.”Physics Reports666 (2017). Cleaning large correlation matrices: tools from random matrix theory, 1–109.doi:10.1016/j.physrep.2016.10.005
-
[16]
Random matrix theory analysis of cross correlations in financial markets
A Utsugi, K Ino, and M Oshikawa. “Random matrix theory analysis of cross correlations in financial markets.”Phys. Rev. E70 (2 Aug. 2004), 026110.doi:10.1103/PhysRevE.70.026110. 18 B RECOVERING THE ISING MODEL
-
[17]
Random matrix approach to cross correlations in financial data
V Plerou, P Gopikrishnan, B Rosenow, LAN Amaral, T Guhr, and HE Stanley. “Random matrix approach to cross correlations in financial data.”Phys. Rev. E65 (6 June 2002), 066126.doi:10.1103/PhysRevE.65. 066126
-
[18]
A new method to estimate the noise in financial correlation matrices
T Guhr and B Kälber. “A new method to estimate the noise in financial correlation matrices.”Journal of Physics A: Mathematical and General36.12 (Mar. 2003), 3009.doi:10.1088/0305-4470/36/12/310
-
[19]
Signal and noise in correlation matrix
Z Burda, A Görlich, A Jarosz, and J Jurkiewicz. “Signal and noise in correlation matrix.”Physica A: Statistical Mechanics and its Applications343 (2004), 295–310.doi:10.1016/j.physa.2004.05.048
-
[20]
Universal correlations and power-law tails in financial covariance matrices
G Akemann, J Fischmann, and P Vivo. “Universal correlations and power-law tails in financial covariance matrices.”Physica A: Statistical Mechanics and its Applications389.13 (2010), 2566–2579.doi:10.1016/ j.physa.2010.02.026
work page 2010
-
[21]
EF Keller. “Active matter, then and now.”History and Philosophy of the Life Sciences38.3 (2016), 11. doi:10.1007/s40656-016-0112-3
-
[22]
Oxford Univer- sity Press (2018).https://doi.org/10.1093/oso/9780198814788.001.0001
J Zinn-Justin.Quantum Field Theory and Critical Phenomena. Oxford University Press, 2002.doi:10. 1093/acprof:oso/9780198509233.001.0001
-
[23]
Cambridge University Press, 2004.doi:10.1017/CBO9780511606571
M Le Bellac, F Mortessagne, and GG Batrouni.Equilibrium and Non-Equilibrium Statistical Thermody- namics. Cambridge University Press, 2004.doi:10.1017/CBO9780511606571
-
[24]
Theory of dynamic critical phenomena
PC Hohenberg and BI Halperin. “Theory of dynamic critical phenomena.”Rev. Mod. Phys.49 (3 July 1977), 435–479.doi:10.1103/RevModPhys.49.435
-
[25]
Theory of phase-ordering kinetics
A Bray. “Theory of phase-ordering kinetics.”Advances in Physics43.3 (1994), 357–459.doi:10 . 1080 / 00018739400101505
work page 1994
-
[26]
R Finotello, V Lahoche, P Radpay, and D Ousmane Samary.Functional Renormalization for Signal De- tection: A review on theory, methods and applications. 2026
work page 2026
-
[27]
An Introduction to the Nonperturbative Renormalization Group
B Delamotte. “An Introduction to the Nonperturbative Renormalization Group.” In:Renormalization Group and Effective Field Theory Approaches to Many-Body Systems. Ed. by A Schwenk and J Polonyi. Berlin, Heidelberg: Springer Berlin Heidelberg, 2012, 49–132.doi:10.1007/978-3-642-27320-9_2
-
[28]
Oxford University Press, 2019.doi:10.1093/oso/ 9780198787754.001.0001
J Zinn-Justin.From random walks to random matrices. Oxford University Press, 2019.doi:10.1093/oso/ 9780198787754.001.0001
-
[29]
Information Theory and Statistical Mechanics
ET Jaynes. “Information Theory and Statistical Mechanics.”Phys. Rev.106 (4 1957), 620–630.doi:10. 1103/PhysRev.106.620
work page 1957
-
[30]
Non-perturbative renormalization flow in quantum field theory and statistical physics
J Berges, N Tetradis, and C Wetterich. “Non-perturbative renormalization flow in quantum field theory and statistical physics.”Physics Reports363.4 (2002). Renormalization group theory in the new millennium. IV, 223–386.doi:10.1016/s0370-1573(01)00098-9
-
[31]
Optimisation of the exact renormalisation group
DF Litim. “Optimisation of the exact renormalisation group.”Physics Letters B486.1 (2000), 92–99. doi:10.1016/s0370-2693(00)00748-6
-
[32]
V Lahoche and D Ousmane Samary. “Nonperturbative renormalization group beyond the melonic sector: The effective vertex expansion method for group fields theories.”Phys. Rev. D98 (12 2018), 126010. doi:10.1103/PhysRevD.98.126010
-
[33]
Functional renormalization group for “p = 2
V Lahoche and D Ousmane Samary. “Functional renormalization group for “p = 2” like glassy matrices in the planar approximation I. Vertex expansion at equilibrium.”Nuclear Physics B1005 (2024), 116582. doi:10.1016/j.nuclphysb.2024.116582
-
[34]
Time-translation invariance symmetry break- ing hidden by finite-scale singularities
I Achitouv, V Lahoche, D Ousmane Samary, and P Radpay. “Time-translation invariance symmetry break- ing hidden by finite-scale singularities.”Physica Scripta101.11 (Mar. 2026), 115201.doi:10.1088/1402- 4896/ae4cd1
- [35]
-
[36]
I Achitouv, V Lahoche, D Ousmane Samary, and P Radpay.Constructing the low-temperature phase dia- gram for the2 +p-quantum spin glass using the nonperturbative renormalization group. 2025. arXiv:2503. 12247
work page 2025
-
[37]
Critical Binder cumulant of two-dimensional Ising models
W Selke. “Critical Binder cumulant of two-dimensional Ising models.”The European Physical Journal B-Condensed Matter and Complex Systems51.2 (2006), 223–228.doi:10.1140/epjb/e2006-00209-7
-
[38]
R Mulet and DA Stariolo. “Langevin dynamics of fluctuation-induced first-order phase transitions: Self- consistent Hartree approximation.”Phys. Rev. B75 (6 Feb. 2007), 064108.doi:10.1103/PhysRevB.75. 064108. 19
discussion (0)
Sign in with ORCID, Apple, or X to comment. Anyone can read and Pith papers without signing in.