The heart of NGC 5253 as seen with MUSE-NFM: nitrogen enrichment through stellar chemical feedback at parsec scales
Pith reviewed 2026-05-21 21:43 UTC · model grok-4.3
The pith
Nitrogen is enriched by a factor of two to three around the super star clusters in NGC 5253 due to feedback from Wolf-Rayet stars.
A machine-rendered reading of the paper's core claim, the machinery that carries it, and where it could break.
Core claim
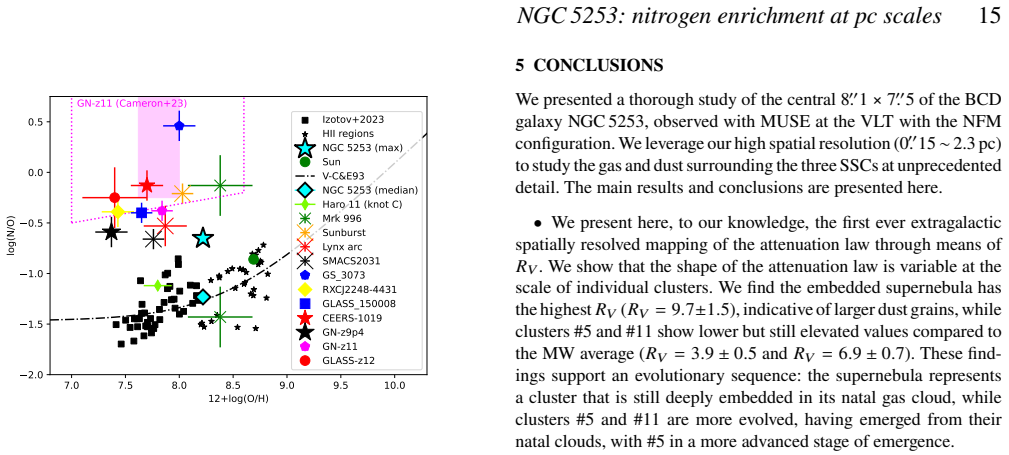
N/O shows a factor 2-3 enhancement around the SSCs, mapped here for the first time at such high spatial resolution. The total excess nitrogen mass is ∼0.3 M_⊙, which we estimate is producible by the observed WN-type Wolf-Rayet (WR) stars. Because there is no direct spatial overlap between the enrichment and WR star positions, the N-rich material appears to have been expelled from the original sites.
What carries the argument
The chemical feedback from WN-type Wolf-Rayet stars, which produce nitrogen through stellar nucleosynthesis and expel it via stellar winds into the interstellar medium surrounding the super star clusters.
If this is right
- The nitrogen enrichment observed is attributable to the stellar winds of the WN Wolf-Rayet stars present in the region.
- Abundance patterns in similar high-redshift star-forming galaxies may be understood through such local feedback processes.
- The dust extinction properties differ among the individual super star clusters as shown by varying R_V values.
- The electron temperature is relatively uniform while the electron density shows structure in the ionised gas.
Where Pith is reading between the lines
- The high spatial resolution mapping provides a benchmark for how chemical enrichment occurs in compact starburst regions that can be applied to more distant galaxies.
- Transport mechanisms must efficiently move the enriched gas away from the producing stars without significant mixing dilution.
- Similar observations in other blue compact dwarfs could test if Wolf-Rayet stars are the dominant source of nitrogen enrichment at these scales.
Load-bearing premise
The excess nitrogen mass of 0.3 solar masses is produced solely by the WN-type Wolf-Rayet stars and has been expelled to the observed locations without substantial contributions from other sources or large uncertainties in the measurements.
What would settle it
A direct count or yield calculation showing that the observed WN stars cannot produce enough nitrogen to account for the 0.3 solar mass excess, or high-resolution imaging revealing that the nitrogen enrichment peaks coincide with the positions of the Wolf-Rayet stars rather than being offset.
Figures


read the original abstract
NGC 5253 is a nearby (D=3.6 Mpc) Blue Compact Dwarf galaxy, notable for its three massive young super star clusters (SSCs) and nitrogen enrichment. Its similarity to extreme star-forming galaxies at high redshift makes it a good local analogue for studying chemical enrichment at high spatial resolution. We characterise the ionised gas and dust in the giant HII region in the proximity of the three SSCs in the centre of NGC 5253 using new Multi-Unit Spectroscopic Explorer Narrow Field Mode adaptive optics-assisted data at unprecedented spatial resolution of 0."15$\sim$2.3 pc. We derive the attenuation for the central SSCs and, for the first time, map the extinction parameter ($R_V$) in an extragalactic object. $R_V$ varies among SSCs, suggesting differences in dust physics. Electron temperature and density diagnostics yield flat temperature distributions $T_\mathrm{e,median}$([NII])$=12000 \pm 1700$ K and $T_\mathrm{e,median}$([SIII])$ = 11000 \pm 600$ K, and a structured $n_e$([SII]) of maximum $1930 \pm 40$ cm$^{-3}$. The direct method gives a flat helium abundance ($10^3y^+ = 81 \pm 4$) and uniform oxygen abundance ($12 + \log(\text{O/H}) = 8.22 \pm 0.05$). N/O shows a factor 2-3 enhancement around the SSCs, mapped here for the first time at such high spatial resolution. The total excess nitrogen mass is $\sim$0.3 $M_\odot$, which we estimate is producible by the observed WN-type Wolf-Rayet (WR) stars. Because there is no direct spatial overlap between the enrichment and WR star positions, the N-rich material appears to have been expelled from the original sites.
Editorial analysis
A structured set of objections, weighed in public.
Referee Report
Summary. The manuscript presents MUSE-NFM adaptive-optics integral-field spectroscopy of the central giant HII region in NGC 5253 at 0.15 arcsec (~2.3 pc) resolution. Using standard nebular line diagnostics the authors derive flat electron-temperature maps (T_e([N II]) median 12000 K, T_e([S III]) median 11000 K), structured electron densities up to ~1930 cm^{-3}, uniform oxygen and helium abundances, and a factor 2–3 N/O enhancement in the vicinity of the three super star clusters. They report a total excess nitrogen mass of ~0.3 M_⊙ that they attribute to the observed WN-type Wolf-Rayet stars and, given the absence of spatial coincidence, infer that the enriched gas has been expelled from the original star-formation sites. The work also provides the first extragalactic map of the extinction parameter R_V.
Significance. If the nitrogen-mass budget and its attribution to the WN population are robust, the paper supplies one of the highest-resolution observational links between massive-star feedback and chemical enrichment at parsec scales in a local starburst. The flat abundance distributions, the R_V map, and the direct spatial comparison with WR stars strengthen NGC 5253 as a benchmark for interpreting integrated spectra of high-redshift galaxies.
major comments (1)
- [Results section on nitrogen abundance and mass estimate] The headline claim that the integrated excess nitrogen mass is only ~0.3 M_⊙ and is fully accounted for by the observed WN stars rests on the conversion of the observed N/O map to a total mass. The manuscript does not supply the adopted emitting volume, line-of-sight depth, volume filling factor, or the precise WN nitrogen yields employed, nor any sensitivity tests to these choices. If the true mass is several times larger (or the yields lower), both the attribution to WN stars alone and the expulsion inference become substantially weaker.
minor comments (3)
- [Abstract] The abstract states that the excess mass “we estimate is producible” by the WN stars but does not quote the number of WN stars or the yield value adopted; adding these numbers would improve clarity.
- [Figures showing spatial distributions] In the N/O and WR-star position maps, ensure that the WR locations are over-plotted with the same spatial sampling as the abundance map so that the claimed lack of overlap can be assessed quantitatively by the reader.
- [Abundance analysis] The reported uncertainties on T_e and abundances (e.g., ±1700 K, ±0.05 dex) should be accompanied by a brief statement of how they propagate into the final excess-mass uncertainty.
Simulated Author's Rebuttal
We thank the referee for their constructive and detailed review of our manuscript. We address the single major comment below and have made revisions to improve the clarity and robustness of the nitrogen mass analysis.
read point-by-point responses
-
Referee: [Results section on nitrogen abundance and mass estimate] The headline claim that the integrated excess nitrogen mass is only ~0.3 M_⊙ and is fully accounted for by the observed WN stars rests on the conversion of the observed N/O map to a total mass. The manuscript does not supply the adopted emitting volume, line-of-sight depth, volume filling factor, or the precise WN nitrogen yields employed, nor any sensitivity tests to these choices. If the true mass is several times larger (or the yields lower), both the attribution to WN stars alone and the expulsion inference become substantially weaker.
Authors: We agree that the original manuscript did not provide sufficient documentation of the assumptions underlying the excess nitrogen mass estimate. The value of ~0.3 M_⊙ was obtained by integrating the observed N/O enhancement (above the baseline 12 + log(N/O) = 7.8) over the mapped area of the central H II region, converting to nitrogen mass using the directly measured electron density map and an assumed cylindrical geometry. In the revised manuscript we have added a new subsection (now Section 4.3) that explicitly states: (i) the adopted line-of-sight depth of 4 pc (set to the median radius of the N-enriched zone), (ii) a volume filling factor of 0.2 derived from the observed density contrast between the [S II] map and the mean density, (iii) the precise WN nitrogen yields taken from the rotating stellar models of Meynet et al. (2006) for 40–60 M_⊙ stars at Z = 0.008 (0.012–0.035 M_⊙ of N per WN star), and (iv) the number of WN stars (three) identified in the MUSE data. We have also included a sensitivity analysis varying depth by ±50 % and filling factor between 0.05–0.5; the resulting excess mass range remains 0.1–0.7 M_⊙, still consistent with the observed WN population. The spatial-offset argument for expulsion is independent of the exact mass and is retained. These additions directly address the referee’s concern. revision: yes
Circularity Check
No significant circularity; purely observational abundance mapping
full rationale
The paper derives electron temperatures, densities, and chemical abundances (including the N/O enhancement) directly from MUSE-NFM spectra using standard line-ratio diagnostics and the direct method. The excess nitrogen mass of ~0.3 M⊙ is obtained by integrating observed quantities over the mapped region with conventional assumptions for volume and filling factor; this is an empirical estimate, not a derivation that reduces to fitted parameters or self-referential equations. Attribution to WN stars relies on external literature yields and observed star counts rather than any internal loop. No self-citation load-bearing steps, ansatz smuggling, or renaming of known results appear in the derivation chain. The work is self-contained against external benchmarks.
Axiom & Free-Parameter Ledger
axioms (1)
- domain assumption Standard assumptions in nebular abundance analysis including ionization correction factors and validity of [NII] and [SIII] temperature diagnostics.
Lean theorems connected to this paper
-
IndisputableMonolith/Cost/FunctionalEquation.leanwashburn_uniqueness_aczel unclear?
unclearRelation between the paper passage and the cited Recognition theorem.
N/O shows a factor 2-3 enhancement around the SSCs... The total excess nitrogen mass is ∼0.3 M⊙, which we estimate is producible by the observed WN-type Wolf-Rayet (WR) stars.
-
IndisputableMonolith/Foundation/AbsoluteFloorClosure.leanabsolute_floor_iff_bare_distinguishability unclear?
unclearRelation between the paper passage and the cited Recognition theorem.
We use PyNeb’s getTemDen method... direct method gives a flat helium abundance... uniform oxygen abundance
What do these tags mean?
- matches
- The paper's claim is directly supported by a theorem in the formal canon.
- supports
- The theorem supports part of the paper's argument, but the paper may add assumptions or extra steps.
- extends
- The paper goes beyond the formal theorem; the theorem is a base layer rather than the whole result.
- uses
- The paper appears to rely on the theorem as machinery.
- contradicts
- The paper's claim conflicts with a theorem or certificate in the canon.
- unclear
- Pith found a possible connection, but the passage is too broad, indirect, or ambiguous to say the theorem truly supports the claim.
Reference graph
Works this paper leans on
-
[1]
" write newline "" before.all 'output.state := FUNCTION fin.entry write newline FUNCTION new.block output.state before.all = 'skip after.block 'output.state := if FUNCTION new.sentence output.state after.block = 'skip output.state before.all = 'skip after.sentence 'output.state := if if FUNCTION not #0 #1 if FUNCTION and 'skip pop #0 if FUNCTION or pop #1...
-
[2]
Alonso‐Herrero A., Takagi T., Baker A. J., Rieke G. H., Rieke M. J., Imanishi M., Scoville N. Z., 2004, @doi [ApJ] 10.1086/422448 , 612, 222
-
[3]
J., Allende Prieto C., Kiselman D., 2004, @doi [A&A] 10.1051/0004-6361:20034328 , 417, 751
Asplund M., Grevesse N., Sauval A. J., Allende Prieto C., Kiselman D., 2004, @doi [A&A] 10.1051/0004-6361:20034328 , 417, 751
-
[4]
Astropy Collaboration et al., 2013, @doi [ ] 10.1051/0004-6361/201322068 , https://ui.adsabs.harvard.edu/abs/2013A&A...558A..33A 558, A33
-
[5]
Ground-based and Airborne Instrumentation for Astronomy III , year = 2010, editor =
Bacon R., et al., 2010, in McLean I. S., Ramsay S. K., Takami H., eds, Society of Photo-Optical Instrumentation Engineers (SPIE) Conference Series Vol. 7735, Ground-based and Airborne Instrumentation for Astronomy III. p. 773508 ( @eprint arXiv 2211.16795 ), @doi 10.1117/12.856027
-
[6]
Beck S. C., Turner J. L., Ho P. T. P., Lacy J. H., Kelly D. M., 1996, @doi [ApJ] 10.1086/176757 , 457, 610
-
[7]
Bhatia A. K., Kastner S. O., 1995, @doi [A&AS] 10.1086/192121 , 96, 325
-
[8]
Brazzini M., et al., 2024, @doi [A&A] 10.1051/0004-6361/202451007
-
[9]
Brinchmann J., Kunth D., Durret F., 2008, @doi [A&A] 10.1051/0004-6361:200809783 , 485, 657
-
[10]
Bruzual G., Charlot S., 2003, @doi [MNRAS] 10.1046/j.1365-8711.2003.06897.x , 344, 1000
-
[11]
Bunker A. J., et al., 2023, @doi [A&A] 10.1051/0004-6361/202346159 , 677, A88
-
[12]
Calzetti D., Meurer G. R., Bohlin R. C., Garnett D. R., Kinney A. L., Leitherer C., Storchi-Bergmann T., 1997, @doi [AJ] 10.1086/118609 , 114, 1834
-
[13]
Calzetti D., Conselice C. J., Gallagher J. S., Kinney A. L., 1999, @doi [AJ] 10.1086/300972 , 118, 797
-
[14]
Calzetti D., et al., 2015, @doi [ApJ] 10.1088/0004-637X/811/2/75 , 811, 75
-
[15]
Cameron A. J., Katz H., Rey M. P., Saxena A., 2023, @doi [MNRAS] 10.1093/mnras/stad1579 , 523, 3516
-
[16]
Campbell A., Terlevich R., Melnick J., 1986, @doi [MNRAS] 10.1093/mnras/223.4.811 , 223, 811
-
[17]
Cappellari M., Copin Y., 2003, @doi [MNRAS] 10.1046/j.1365-8711.2003.06541.x , 342, 345
-
[18]
Cardelli J. A., Clayton G. C., Mathis J. S., 1989, @doi [ApJ] 10.1086/167900 , 345, 245
-
[19]
Castellano M., et al., 2024, @doi [ApJ] 10.3847/1538-4357/ad5f88 , 972, 143
-
[20]
Charbonnel C., Schaerer D., Prantzos N., Ram \' rez-Galeano L., Fragos T., Kuruvanthodi A., Marques-Chaves R., Gieles M., 2023, @doi [ ] 10.1051/0004-6361/202346410 , https://ui.adsabs.harvard.edu/abs/2023A&A...673L...7C 673, L7
-
[21]
Consiglio S. M., Turner J. L., Beck S., Meier D. S., Silich S., Zhao J.-H., 2017, @doi [ApJ] 10.3847/1538-4357/aa93dc , 850, 54
-
[22]
Crowther P. A., 2007, @doi [ARA&A] 10.1146/annurev.astro.45.051806.110615 , 45, 177
-
[23]
Crowther P. A., Hadfield L. J., 2006, @doi [A&A] 10.1051/0004-6361:20054298 , 449, 711
-
[24]
D'Antona F., et al., 2023, @doi [ ] 10.1051/0004-6361/202348240 , https://ui.adsabs.harvard.edu/abs/2023A&A...680L..19D 680, L19
-
[25]
Dartois E., et al., 2024, @doi [Nature Astronomy] 10.1038/s41550-023-02155-x , 8, 359
-
[26]
De Grijs R., Anders P., Zackrisson E., Östlin G., 2013, @doi [MNRAS] 10.1093/mnras/stt392 , 431, 2917
-
[27]
Dopita M. A., Sutherland R. S., 2003, Astrophysics of the diffuse universe, @doi 10.1007/978-3-662-05866-4. , https://ui.adsabs.harvard.edu/abs/2003adu..book.....D
-
[28]
Disentangling the independently controllable factors of variation by interacting with the world
Draine B. T., 2003, @doi [ARA&A] 10.1146/annurev.astro.41.011802.094840 , 41, 241
work page internal anchor Pith review Pith/arXiv arXiv doi:10.1146/annurev.astro.41.011802.094840 2003
-
[29]
Eldridge J. J., Izzard R. G., Tout C. A., 2008, @doi [MNRAS] 10.1111/j.1365-2966.2007.12738.x , 384, 1109
-
[30]
M., 1992, @doi [ApJ] 10.1086/171303 , 390, 536
Esteban C., Vilchez J. M., 1992, @doi [ApJ] 10.1086/171303 , 390, 536
-
[31]
Esteban C., Peimbert M., Torres-Peimbert S., Rodriguez M., 2002, @doi [ApJ] 10.1086/344104 , 581, 241
-
[32]
Esteban C., Bresolin F., Peimbert M., García-Rojas J., Peimbert A., Mesa-Delgado A., 2009, @doi [ApJ] 10.1088/0004-637X/700/1/654 , 700, 654
-
[33]
R., Mesa-Delgado A., 2014, @doi [MNRAS] 10.1093/mnras/stu1177 , 443, 624
Esteban C., García-Rojas J., Carigi L., Peimbert M., Bresolin F., L \'o pez-S \'a nchez A. R., Mesa-Delgado A., 2014, @doi [MNRAS] 10.1093/mnras/stu1177 , 443, 624
-
[34]
E., et al., 1999, @doi [ApJ] 10.1086/307758 , 523, 617
Falco E. E., et al., 1999, @doi [ApJ] 10.1086/307758 , 523, 617
-
[35]
M., Pérez-Montero E., Candian A., S \'a nchez S
Fernández-Mart \'i n A., Vílchez J. M., Pérez-Montero E., Candian A., S \'a nchez S. F., Mart \'i n-Gord \'o n D., Riera A., 2013, @doi [A&A] 10.1051/0004-6361/201220773 , 554, A104
-
[36]
Fischer F., Grayson M., Schuberth E., Schuh D., Bichler M., Abstreiter G., 2004, @doi [Physica E Low-Dimensional Systems and Nanostructures] 10.1016/j.physe.2003.11.227 , 22, 108
-
[37]
L., 1999, @doi [PASP] 10.1086/316293 , 111, 63
Fitzpatrick E. L., 1999, @doi [PASP] 10.1086/316293 , 111, 63
-
[38]
L., Massa D., 1988, @doi [ApJ] 10.1086/166332 , 328, 734
Fitzpatrick E. L., Massa D., 1988, @doi [ApJ] 10.1086/166332 , 328, 734
-
[39]
Froese Fischer C., Tachiev G., Irimia A., 2006, @doi [Atomic Data and Nuclear Data Tables] https://doi.org/10.1016/j.adt.2006.03.001 , 92, 607
-
[40]
Fétick R. J. L., et al., 2019, @doi [A&A] 10.1051/0004-6361/201935830 , 628, A99
-
[41]
Gaia Collaboration et al., 2023, @doi [A&A] 10.1051/0004-6361/202243940 , https://ui.adsabs.harvard.edu/abs/2023A&A...674A...1G 674, A1
-
[42]
R., 1992, @doi [AJ] 10.1086/116146 , 103, 1330
Garnett D. R., 1992, @doi [AJ] 10.1086/116146 , 103, 1330
-
[43]
Girardi L., Bressan A., Bertelli G., Chiosi C., 2000, @doi [A&AS] 10.1051/aas:2000126 , 141, 371
work page internal anchor Pith review doi:10.1051/aas:2000126 2000
-
[44]
M., Papaderos P., 2017, @doi [A&A] 10.1051/0004-6361/201628986 , 603, A63
Gomes J. M., Papaderos P., 2017, @doi [A&A] 10.1051/0004-6361/201628986 , 603, A63
-
[45]
Green G. M., Zhang X., Zhang R., 2024, The Dust Extinction Curve : Beyond R ( V ), http://arxiv.org/abs/2410.22537
-
[46]
Guseva N. G., Izotov Y. I., Stasińska G., Fricke K. J., Henkel C., Papaderos P., 2011, @doi [A&A] 10.1051/0004-6361/201016291 , 529, A149
-
[47]
Harbeck D., Gallagher J., Crnojević D., 2012, @doi [MNRAS] 10.1111/j.1365-2966.2012.20640.x , 422, 629
-
[48]
Harikane Y., et al., 2025, @doi [ApJ] 10.3847/1538-4357/ad9b2c , 980, 138
-
[49]
Harris J., Calzetti D., Gallagher Iii J. S., Smith D. A., Conselice C. J., 2004, @doi [ApJ] 10.1086/381669 , 603, 503
-
[50]
Eric Jones, Travis Oliphant, Pearu Peterson, et al
Hunter J. D., 2007, @doi [Computing in Science and Engineering] 10.1109/MCSE.2007.55 , https://ui.adsabs.harvard.edu/abs/2007CSE.....9...90H 9, 90
-
[51]
Isobe Y., et al., 2025, JADES : Average Nitrogen Enhancement in High - Redshift Broad - Line Active Galactic Nuclei , @doi 10.48550/arXiv.2502.12091 , http://arxiv.org/abs/2502.12091
-
[52]
I., Stasińska G., Meynet G., Guseva N
Izotov Y. I., Stasińska G., Meynet G., Guseva N. G., Thuan T. X., 2006, @doi [A&A] 10.1051/0004-6361:20053763 , 448, 955
-
[53]
Izotov Y. I., Thuan T. X., Guseva N. G., Liss S. E., 2018, @doi [MNRAS] 10.1093/mnras/stx2478 , 473, 1956
-
[54]
Izotov Y. I., Guseva N. G., Fricke K. J., Henkel C., Schaerer D., Thuan T. X., 2021, @doi [A&A] 10.1051/0004-6361/202039772 , 646, A138
-
[55]
I., Schaerer D., Worseck G., Berg D., Chisholm J., Ravindranath S., Thuan T
Izotov Y. I., Schaerer D., Worseck G., Berg D., Chisholm J., Ravindranath S., Thuan T. X., 2023, @doi [MNRAS] 10.1093/mnras/stad1036 , 522, 1228
-
[56]
James B. L., Tsamis Y. G., Barlow M. J., Westmoquette M. S., Walsh J. R., Cuisinier F., Exter K. M., 2009, @doi [MNRAS] 10.1111/j.1365-2966.2009.15172.x , 398, 2
-
[57]
James B. L., Tsamis Y. G., Walsh J. R., Barlow M. J., Westmoquette M. S., 2013, @doi [MNRAS] 10.1093/mnras/stt034 , 430, 2097
-
[58]
Ji X., et al., 2024, @doi [MNRAS] 10.1093/mnras/stae2375 , 535, 881
-
[59]
D., et al., 2007, @doi [AJ] 10.1086/510125 , 133, 504
Karachentsev I. D., et al., 2007, @doi [AJ] 10.1086/510125 , 133, 504
-
[60]
C., 2007, @doi [Publications of the Astronomical Society of Australia] 10.1071/AS07021 , 24, 103
Karakas A., Lattanzio J. C., 2007, @doi [Publications of the Astronomical Society of Australia] 10.1071/AS07021 , 24, 103
-
[61]
Kisielius R., Storey P. J., Ferland G. J., Keenan F. P., 2009, @doi [MNRAS] 10.1111/j.1365-2966.2009.14989.x , 397, 903
-
[62]
Knutas A., et al., 2025, FEAST : JWST uncovers the emerging timescales of young star clusters in M83 , @doi 10.48550/arXiv.2505.08874 , http://arxiv.org/abs/2505.08874
-
[63]
Kobulnicky H. A., Skillman E. D., 2008, @doi [AJ] 10.1088/0004-6256/135/2/527 , 135, 527
-
[64]
Kobulnicky H. A., Skillman E. D., Roy J.-R., Walsh J. R., Rosa M. R., 1997, @doi [ApJ] 10.1086/303742 , 477, 679
-
[65]
Kramida A., 2010, @doi [Atomic Data and Nuclear Data Tables] https://doi.org/10.1016/j.adt.2010.05.001 , 96, 586
-
[66]
J., 2006, @doi [A&AS] 10.1086/505579 , 166, 188
Labrie K., Pritchet C. J., 2006, @doi [A&AS] 10.1086/505579 , 166, 188
-
[67]
R., Esteban C., 2010, @doi [A&A] 10.1051/0004-6361/200913434 , 516, A104
L \'o pez-S \'a nchez \'A . R., Esteban C., 2010, @doi [A&A] 10.1051/0004-6361/200913434 , 516, A104
-
[68]
L \'o pez-S \'a nchez \'A . R., Mesa-Delgado A., L \'o pez-Mart \'i n L., Esteban C., 2011, @doi [MNRAS] 10.1111/j.1365-2966.2010.17847.x , 411, 2076
-
[69]
L \'o pez-S \'a nchez \'A . R., Koribalski B. S., Van Eymeren J., Esteban C., Kirby E., Jerjen H., Lonsdale N., 2012, @doi [MNRAS] 10.1111/j.1365-2966.2011.19762.x , 419, 1051
-
[70]
Lopez‐Sanchez A. R., Esteban C., Garcia‐Rojas J., Peimbert M., Rodriguez M., 2007, @doi [ApJ] 10.1086/510112 , 656, 168
-
[71]
Luridiana V., Morisset C., Shaw R. A., 2015, @doi [A&A] 10.1051/0004-6361/201323152 , 573, A42
-
[72]
Maeder A., Meynet G., 1994, , https://ui.adsabs.harvard.edu/abs/1994A&A...287..803M 287, 803
work page 1994
-
[73]
Marasco A., et al., 2023, @doi [A&A] 10.1051/0004-6361/202244895 , 670, A92
-
[74]
Marques-Chaves R., et al., 2024, @doi [A&A] 10.1051/0004-6361/202347411 , 681, A30
-
[75]
Martin W. C., Zalubas R., Musgrove A., 1990, @doi [Journal of Physical and Chemical Reference Data] 10.1063/1.555862 , 19, 821
-
[76]
Martin W. C., Kaufman V., Musgrove A., 1993, @doi [Journal of Physical and Chemical Reference Data] 10.1063/1.555928 , 22, 1179
-
[77]
Martins F., Schaerer D., Marques-Chaves R., Upadhyaya A., 2023, @doi [A&A] 10.1051/0004-6361/202346732 , 678, A159
-
[78]
Meier D. S., Turner J. L., Beck S. C., 2002, @doi [AJ] 10.1086/341752 , 124, 877
-
[79]
Meynet G., Maeder A., 2005, @doi [A&A] 10.1051/0004-6361:20047106 , 429, 581
-
[80]
E., Espada D., Sugai H., Nakanishi K., Hirota A., 2015, @doi [PASJ] 10.1093/pasj/psu138 , 67, L1
Miura R. E., Espada D., Sugai H., Nakanishi K., Hirota A., 2015, @doi [PASJ] 10.1093/pasj/psu138 , 67, L1
discussion (0)
Sign in with ORCID, Apple, or X to comment. Anyone can read and Pith papers without signing in.