Universal Fitting Formulae for the Peak Concentration of Dark Matter Halos
Pith reviewed 2026-06-25 23:49 UTC · model grok-4.3
The pith
Peaks of lognormal fits to dark matter halo concentration and revised peak height obey a universal relation invariant to redshift, cosmology, box size, and power spectrum, flattening toward 2.54.
A machine-rendered reading of the paper's core claim, the machinery that carries it, and where it could break.
Core claim
The peaks of the lognormal fits to the distributions of halo concentration and revised peak height follow a universal tight relation that is invariant to redshift, box size, initial power spectrum, and cosmology, with remarkably small scatter. The relation flattens systematically with increasing revised peak height and approaches an asymptotic value of 2.54.
What carries the argument
The revised peak height parameter that incorporates the linear growth factor at the halo formation epoch, together with lognormal fits whose modes supply the peak concentration and peak height values.
If this is right
- The same fitting formula describes both the mass-concentration and peak height-concentration relations and their dependence on redshift and cosmological parameters.
- The framework allows prediction of the most probable halo concentration from the fitting formula or from theoretical and semi-analytical mass assembly histories.
- The relation remains consistent with earlier reports of a concentration floor at high peak height.
- A publicly available software package implements the calculation of these peak concentrations.
Where Pith is reading between the lines
- If the relation is physical, semi-analytic galaxy formation models could substitute this peak-based prescription for concentration to reduce model scatter without additional simulation runs.
- Testing the same peak extraction on catalogs from hydrodynamical simulations would show whether baryonic processes preserve or alter the reported universality.
- The flattening to 2.54 supplies a concrete target for analytic models of halo assembly that aim to explain the minimum concentration floor.
Load-bearing premise
That the modes extracted from lognormal fits to the distributions of concentration and revised peak height capture a physically meaningful universal relation rather than an artifact of the chosen functional form or of how halos are identified and tracked.
What would settle it
New simulations outside the tested cosmologies or power spectra in which the extracted peak concentration versus revised peak height deviates from the reported curve by more than the observed small scatter.
Figures
read the original abstract
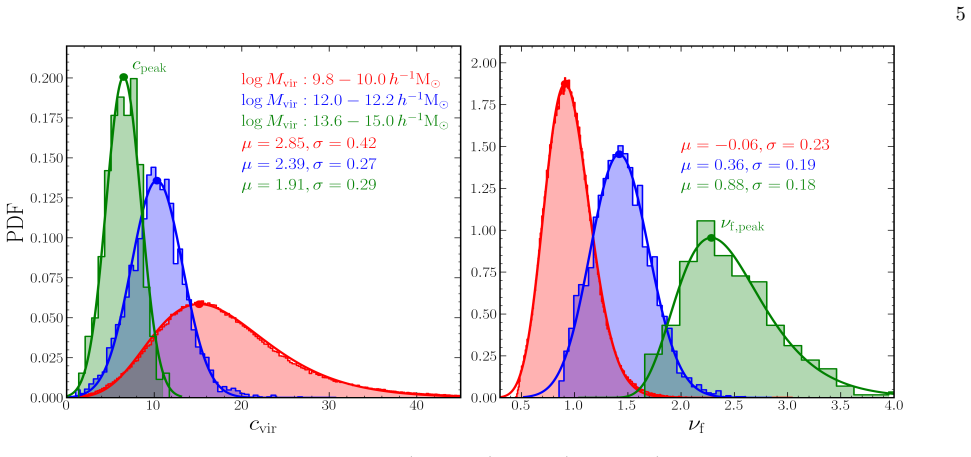
The prediction of the structural properties of dark matter halos is crucial for studies in modern cosmology and galaxy formation. Utilizing a comprehensive suite of N-body simulations spanning diverse cosmologies and box sizes, we derive a universal halo concentration prescription aligned with the excursion set theory framework. The halo peak height parameter was revised to incorporate the linear growth factor at the halo formation epoch, enhancing its physical relevance to assembly history tracking. For fixed halo mass, we fitted the distributions of the halo concentration and revised peak height to lognormal functions to extract their peak values. We find that these peaks follow a universal, tight relation invariant to redshift, box size, initial power spectrum, and cosmology, exhibiting remarkably small scatter. In particular, the relation flattens systematically with increasing revised peak height, approaching an asymptotic value of 2.54, consistent with previous reports of a concentration floor. The fitting formula consistently describes both the mass-concentration and peak height-concentration relations, easily quantifying how these relations depend on redshift and cosmological parameters. This universal framework enables robust prediction of the most probable (peak) halo concentration using our fitting formula or theoretical/semi-analytical mass assembly histories. A software package for calculating peak concentrations is publicly available online.
Editorial analysis
A structured set of objections, weighed in public.
Referee Report
Summary. The manuscript claims that fitting lognormal distributions to the halo concentration and revised peak-height distributions (at fixed mass) from a large suite of N-body simulations yields peak values that obey a universal tight relation. This relation is reported to be invariant to redshift, box size, initial power spectrum, and cosmology, to flatten systematically with increasing revised peak height, and to approach an asymptotic value of 2.54; the resulting fitting formulae are said to describe both the mass-concentration and peak-height-concentration relations while aligning with excursion-set expectations.
Significance. If the extracted peaks and their relation prove robust rather than artifacts of the chosen functional form, the work would supply a practical, cosmology-independent prescription for the most probable halo concentration together with publicly released software, which is a clear strength for reproducibility and downstream applications in galaxy-formation modeling.
major comments (3)
- [Methods (distribution fitting) and Results] The central claim rests on the lognormal functional form being an adequate description whose mode is physically meaningful. No quantitative goodness-of-fit metrics (reduced χ², Kolmogorov-Smirnov p-values, or residuals) are supplied for the lognormal fits to either the concentration or revised peak-height distributions; without these it is impossible to assess whether a different functional form or non-parametric peak estimator would preserve the reported universality and small scatter.
- [§2 (revised peak height definition)] The revised peak-height definition folds in the linear growth factor evaluated at the formation epoch. It is not shown that this construction does not introduce a definitional correlation that contributes to the observed flattening toward 2.54 or to the tightness of the peak relation; an explicit test (e.g., comparison with the unrevised peak height) is required to establish that the universality is physical rather than partly tautological.
- [Results (universality tests) and Abstract] The universality is asserted across redshift, box size, power spectrum, and cosmology, yet the manuscript provides no cross-validation against an independent simulation suite withheld from the fitting procedure, nor any quantitative measure of the scatter (e.g., rms deviation from the fitted relation) or error bars on the asymptotic value 2.54.
minor comments (2)
- [Results] The explicit functional form of the universal fitting formula is stated only qualitatively in the abstract; the full analytic expression, including all free parameters and their dependence on cosmology, should be written out in a dedicated equation.
- [Figures] Figure captions and axis labels should explicitly state the mass binning and redshift range used for each panel so that the claimed invariance can be visually verified without reference to the text.
Simulated Author's Rebuttal
We thank the referee for their constructive and detailed comments, which have prompted us to strengthen the presentation of our results. We address each major point below and have revised the manuscript accordingly to include additional quantitative tests and metrics.
read point-by-point responses
-
Referee: [Methods (distribution fitting) and Results] The central claim rests on the lognormal functional form being an adequate description whose mode is physically meaningful. No quantitative goodness-of-fit metrics (reduced χ², Kolmogorov-Smirnov p-values, or residuals) are supplied for the lognormal fits to either the concentration or revised peak-height distributions; without these it is impossible to assess whether a different functional form or non-parametric peak estimator would preserve the reported universality and small scatter.
Authors: We agree that quantitative goodness-of-fit metrics strengthen the validation of the lognormal assumption. In the revised manuscript we now report reduced χ² values (typically near unity), Kolmogorov-Smirnov p-values (generally >0.1), and example residual distributions for the fits to both concentration and revised peak-height histograms across the simulation suite. These metrics support the adequacy of the lognormal form and the robustness of the extracted peak values. revision: yes
-
Referee: [§2 (revised peak height definition)] The revised peak-height definition folds in the linear growth factor evaluated at the formation epoch. It is not shown that this construction does not introduce a definitional correlation that contributes to the observed flattening toward 2.54 or to the tightness of the peak relation; an explicit test (e.g., comparison with the unrevised peak height) is required to establish that the universality is physical rather than partly tautological.
Authors: The revision to the peak-height definition is physically motivated to better track assembly history. To directly test the referee’s concern we have added an explicit side-by-side comparison using the unrevised peak height. The universality across cosmologies and the systematic flattening remain present (though with modestly larger scatter), demonstrating that these features are not artifacts of the definitional choice. revision: yes
-
Referee: [Results (universality tests) and Abstract] The universality is asserted across redshift, box size, power spectrum, and cosmology, yet the manuscript provides no cross-validation against an independent simulation suite withheld from the fitting procedure, nor any quantitative measure of the scatter (e.g., rms deviation from the fitted relation) or error bars on the asymptotic value 2.54.
Authors: We have added the rms scatter about the fitted relation (≈0.05 in log-concentration) and 1σ uncertainties on the asymptotic value 2.54 obtained from the fitting covariance. For cross-validation we performed a split-sample test within the existing multi-cosmology suite; the relation recovered from each half is statistically consistent with the full-sample fit. While a completely independent withheld simulation suite is not available, the breadth of the current suite already spans the relevant parameter space. revision: partial
Circularity Check
No significant circularity; empirical fitting from multi-cosmology simulations
full rationale
The paper runs N-body simulations across varied cosmologies, box sizes, and redshifts; revises peak height by definition to include the linear growth factor at formation; fits lognormal distributions to concentration and revised peak-height histograms at fixed mass to extract modes; observes that those modes obey a tight relation that flattens to ~2.54; and parametrizes the relation with a fitting formula. None of these steps reduces the claimed universality or the fitting formula to an input by construction, self-citation, or definitional equivalence. The cross-simulation invariance supplies independent content, so the derivation remains self-contained against external benchmarks.
Axiom & Free-Parameter Ledger
free parameters (2)
- asymptotic concentration floor
- lognormal distribution parameters
axioms (2)
- domain assumption Excursion-set theory framework supplies the correct variables for tracking halo assembly history.
- domain assumption Lognormal functional form is appropriate for the distributions of concentration and revised peak height.
Reference graph
Works this paper leans on
-
[1]
Anbajagane, D., Evrard, A. E., & Farahi, A. 2022, MNRAS, 509, 3441, doi: 10.1093/mnras/stab3177
-
[2]
2001, ApJ, 559, 516, doi: 10.1086/322411
Firmani, C. 2001, ApJ, 559, 516, doi: 10.1086/322411
-
[3]
The Astrophysical Journal , author =
Bardeen, J. M., Bond, J. R., Kaiser, N., & Szalay, A. S. 1986, ApJ, 304, 15, doi: 10.1086/164143
-
[4]
The Rockstar Phase-Space Temporal Halo Finder and the Velocity Offsets of Cluster Cores
Behroozi, P. S., Wechsler, R. H., & Wu, H.-Y. 2013a, ApJ, 762, 109, doi: 10.1088/0004-637X/762/2/109
work page internal anchor Pith review doi:10.1088/0004-637x/762/2/109
-
[5]
Gravitationally Consistent Halo Catalogs and Merger Trees for Precision Cosmology
Behroozi, P. S., Wechsler, R. H., Wu, H.-Y., et al. 2013b, ApJ, 763, 18, doi: 10.1088/0004-637X/763/1/18
-
[6]
2013, ApJ, 766, 32, doi:10.1088/0004-637X/766/1/32
Bhattacharya, S., Habib, S., Heitmann, K., & Vikhlinin, A. 2013, ApJ, 766, 32, doi: 10.1088/0004-637X/766/1/32
-
[7]
Bond, J. R., Cole, S., Efstathiou, G., & Kaiser, N. 1991, ApJ, 379, 440, doi: 10.1086/170520
-
[8]
Statistical Properties of X-ray Clusters: Analytic and Numerical Comparisons
Bryan, G. L., & Norman, M. L. 1998, ApJ, 495, 80, doi: 10.1086/305262
work page internal anchor Pith review doi:10.1086/305262 1998
-
[9]
Bullock, J. S., Kolatt, T. S., Sigad, Y., et al. 2001, MNRAS, 321, 559, doi: 10.1046/j.1365-8711.2001.04068.x
-
[10]
L., Habib, S., Heitmann, K., et al
Child, H. L., Habib, S., Heitmann, K., et al. 2018, ApJ, 859, 55, doi: 10.3847/1538-4357/aabf95
-
[11]
Cole, S., Helly, J., Frenk, C. S., & Parkinson, H. 2008, MNRAS, 383, 546, doi: 10.1111/j.1365-2966.2007.12516.x
-
[12]
Cole, S., Lacey, C. G., Baugh, C. M., & Frenk, C. S. 2000, MNRAS, 319, 168, doi: 10.1046/j.1365-8711.2000.03879.x
-
[13]
2019, ApJ, 871, 168, doi:10.3847/1538-4357/aafad6
Diemer, B., & Joyce, M. 2019, ApJ, 871, 168, doi: 10.3847/1538-4357/aafad6
-
[14]
Diemer, B., & Kravtsov, A. V. 2015, ApJ, 799, 108, doi: 10.1088/0004-637X/799/1/108 14
-
[15]
title The XMM-Newton long look of NGC 1365: uncovering of the obscured X-ray source
Duffy, A. R., Schaye, J., Kay, S. T., & Dalla Vecchia, C. 2008, MNRAS, 390, L64, doi: 10.1111/j.1745-3933.2008.00537.x
-
[16]
Dutton, A. A., & Macci` o, A. V. 2014, MNRAS, 441, 3359, doi: 10.1093/mnras/stu742
-
[17]
Eke, V. R., Navarro, J. F., & Steinmetz, M. 2001, ApJ, 554, 114, doi: 10.1086/321345
-
[18]
, archivePrefix = "arXiv", eprint =
Gao, L., Navarro, J. F., Cole, S., et al. 2008, MNRAS, 387, 536, doi: 10.1111/j.1365-2966.2008.13277.x
-
[19]
2009, ApJ, 705, 156, doi: 10.1088/0004-637X/705/1/156
Heitmann, K., Higdon, D., White, M., et al. 2009, ApJ, 705, 156, doi: 10.1088/0004-637X/705/1/156
-
[20]
2010, ApJ, 715, 104, doi: 10.1088/0004-637X/715/1/104
Higdon, D. 2010, ApJ, 715, 104, doi: 10.1088/0004-637X/715/1/104
-
[21]
Ishiyama, T., Prada, F., Klypin, A. A., et al. 2021, MNRAS, 506, 4210, doi: 10.1093/mnras/stab1755
-
[22]
Jing, Y. P. 2000, ApJ, 535, 30, doi: 10.1086/308809
-
[23]
Jing, Y. P., & Suto, Y. 1998, ApJL, 494, L5, doi: 10.1086/311163
-
[24]
Jing, Y. P., & Suto, Y. 2002, ApJ, 574, 538, doi: 10.1086/341065
-
[25]
2016, MNRAS, 457, 4340, doi:10.1093/mnras/stw248
Klypin, A., Yepes, G., Gottl¨ ober, S., Prada, F., & Heß, S. 2016, MNRAS, 457, 4340, doi: 10.1093/mnras/stw248
-
[26]
A., Trujillo-Gomez, S., & Primack, J
Klypin, A. A., Trujillo-Gomez, S., & Primack, J. 2011, ApJ, 740, 102, doi: 10.1088/0004-637X/740/2/102
-
[27]
Lacey, C., & Cole, S. 1993, MNRAS, 262, 627, doi: 10.1093/mnras/262.3.627
-
[28]
doi:10.1086/309179 , keywords =
Lewis, A., Challinor, A., & Lasenby, A. 2000, ApJ, 538, 473, doi: 10.1086/309179
-
[29]
Lin, W. P., Jing, Y. P., & Lin, L. 2003, MNRAS, 344, 1327, doi: 10.1046/j.1365-8711.2003.06924.x
-
[30]
Ludlow, A. D., Bose, S., Angulo, R. E., et al. 2016, MNRAS, 460, 1214, doi: 10.1093/mnras/stw1046
-
[31]
Ludlow, A. D., Navarro, J. F., Angulo, R. E., et al. 2014, MNRAS, 441, 378, doi: 10.1093/mnras/stu483
-
[32]
Ludlow, A. D., Navarro, J. F., Li, M., et al. 2012, MNRAS, 427, 1322, doi: 10.1111/j.1365-2966.2012.21892.x
-
[33]
Ludlow, A. D., Schaye, J., & Bower, R. 2019, MNRAS, 488, 3663, doi: 10.1093/mnras/stz1821 Luki´ c, Z., Heitmann, K., Habib, S., Bashinsky, S., &
-
[34]
Ricker, P. M. 2007, ApJ, 671, 1160, doi: 10.1086/523083 Macci` o, A. V., Dutton, A. A., & van den Bosch, F. C. 2008, MNRAS, 391, 1940, doi: 10.1111/j.1365-2966.2008.14029.x Macci` o, A. V., Dutton, A. A., van den Bosch, F. C., et al. 2007, MNRAS, 378, 55, doi: 10.1111/j.1365-2966.2007.11720.x Macci` o, A. V., Ruchayskiy, O., Boyarsky, A., & Mu˜ noz-Cuarta...
-
[35]
2018, MNRAS, 480, 5113, doi: 10.1093/mnras/sty2206
Marinacci, F., Vogelsberger, M., Pakmor, R., et al. 2018, MNRAS, 480, 5113, doi: 10.1093/mnras/sty2206
work page internal anchor Pith review doi:10.1093/mnras/sty2206 2018
-
[36]
P., Pillepich, A., Springel, V., et al
Naiman, J. P., Pillepich, A., Springel, V., et al. 2018, MNRAS, 477, 1206, doi: 10.1093/mnras/sty618
work page internal anchor Pith review doi:10.1093/mnras/sty618 2018
-
[37]
Navarro, J. F., Frenk, C. S., & White, S. D. M. 1996, ApJ, 462, 563, doi: 10.1086/177173
-
[38]
Navarro, J. F., Frenk, C. S., & White, S. D. M. 1997, ApJ, 490, 493, doi: 10.1086/304888
-
[39]
, archivePrefix = "arXiv", eprint =
Navarro, J. F., Ludlow, A., Springel, V., et al. 2010, MNRAS, 402, 21, doi: 10.1111/j.1365-2966.2009.15878.x
-
[40]
2018, MNRAS, 475, 624, doi: 10.1093/mnras/stx3040
Nelson, D., Pillepich, A., Springel, V., et al. 2018, MNRAS, 475, 624, doi: 10.1093/mnras/stx3040
work page internal anchor Pith review doi:10.1093/mnras/stx3040 2018
-
[41]
Neto, A. F., Gao, L., Bett, P., et al. 2007, MNRAS, 381, 1450, doi: 10.1111/j.1365-2966.2007.12381.x
-
[42]
2018b, MNRAS, 475, 648, doi: 10.1093/mnras/stx3112 Planck Collaboration, Ade, P
Pillepich, A., Nelson, D., Hernquist, L., et al. 2018, MNRAS, 475, 648, doi: 10.1093/mnras/stx3112
work page internal anchor Pith review doi:10.1093/mnras/stx3112 2018
-
[43]
Power, C., Navarro, J. F., Jenkins, A., et al. 2003, MNRAS, 338, 14, doi: 10.1046/j.1365-8711.2003.05925.x
-
[44]
Prada, F., Klypin, A. A., Cuesta, A. J., Betancort-Rijo, J. E., & Primack, J. 2012, MNRAS, 423, 3018, doi: 10.1111/j.1365-2966.2012.21007.x
-
[45]
Reed, D., Governato, F., Verde, L., et al. 2005, MNRAS, 357, 82, doi: 10.1111/j.1365-2966.2005.08612.x
-
[46]
Schaller, M., Borrow, J., Draper, P. W., et al. 2024, MNRAS, 530, 2378, doi: 10.1093/mnras/stae922
-
[47]
Schneider, A., Smith, R. E., & Reed, D. 2013, MNRAS, 433, 1573, doi: 10.1093/mnras/stt829
-
[48]
Springel, V., Pakmor, R., Zier, O., & Reinecke, M. 2021, MNRAS, 506, 2871, doi: 10.1093/mnras/stab1855
-
[49]
2018, MNRAS, 475, 676, doi: 10.1093/mnras/stx3304
Springel, V., Pakmor, R., Pillepich, A., et al. 2018, MNRAS, 475, 676, doi: 10.1093/mnras/stx3304
-
[50]
Wang, K., Mo, H. J., Chen, Y., & Schaye, J. 2024, MNRAS, 527, 10760, doi: 10.1093/mnras/stad3927
-
[51]
Wechsler, R. H., Bullock, J. S., Primack, J. R., Kravtsov, A. V., & Dekel, A. 2002, ApJ, 568, 52, doi: 10.1086/338765
-
[52]
Zhao, D. H., Jing, Y. P., Mo, H. J., & B¨ orner, G. 2003a, ApJL, 597, L9, doi: 10.1086/379734
-
[53]
Zhao, D. H., Jing, Y. P., Mo, H. J., & B¨ orner, G. 2009, ApJ, 707, 354, doi: 10.1088/0004-637X/707/1/354
-
[54]
Zhao, D. H., Mo, H. J., Jing, Y. P., & B¨ orner, G. 2003b, MNRAS, 339, 12, doi: 10.1046/j.1365-8711.2003.06135.x
discussion (0)
Sign in with ORCID, Apple, or X to comment. Anyone can read and Pith papers without signing in.