Formation of Isotopically Heterogeneous Molecular Cloud Cores in Filamentary Molecular Clouds
Pith reviewed 2026-06-29 03:36 UTC · model grok-4.3
The pith
Isotopic inhomogeneities from molecular cloud filaments persist through core formation and may survive into circumstellar disks.
A machine-rendered reading of the paper's core claim, the machinery that carries it, and where it could break.
Core claim
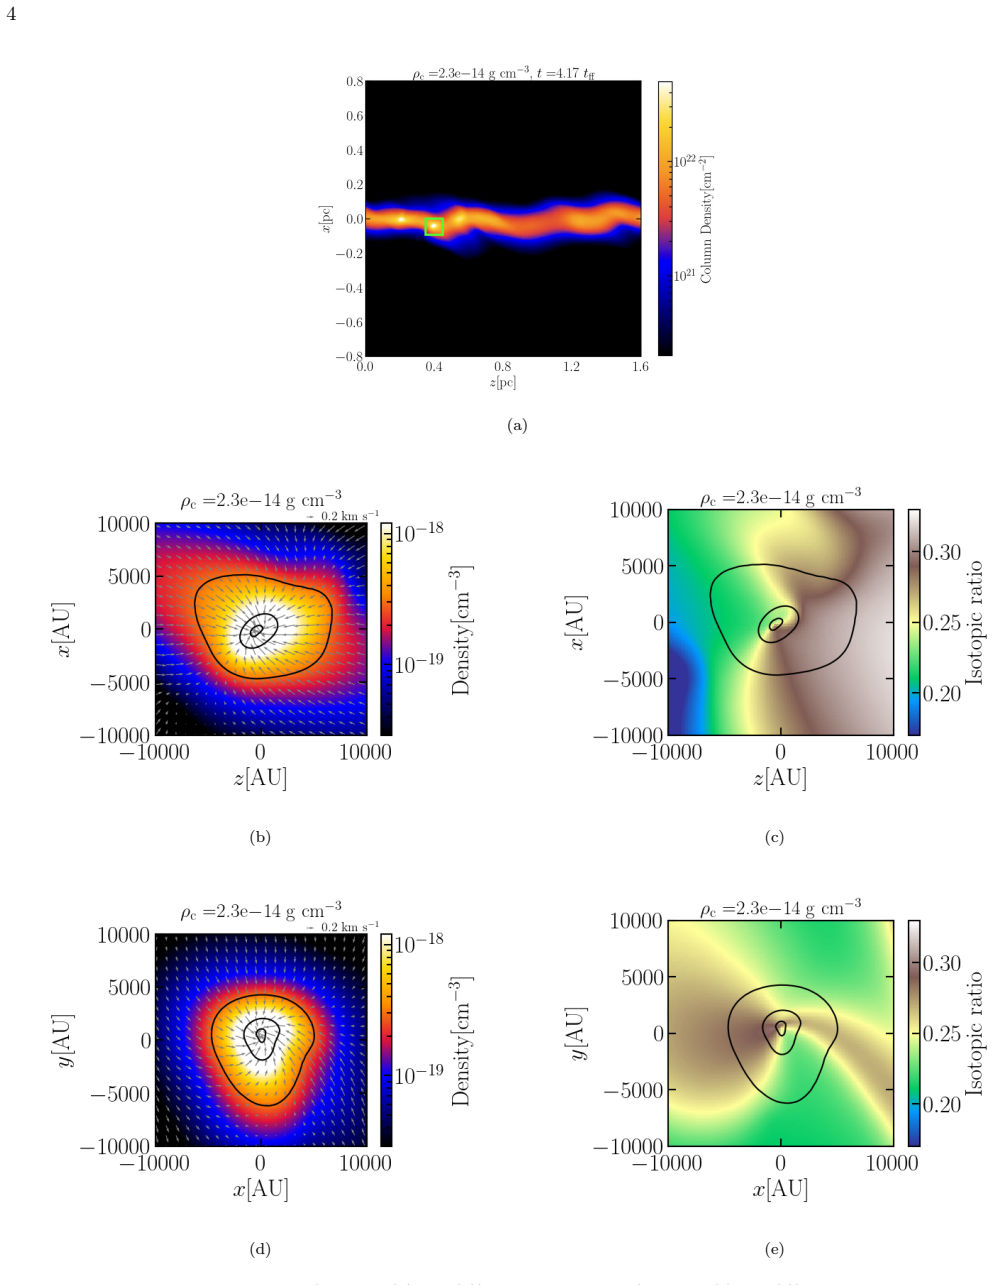
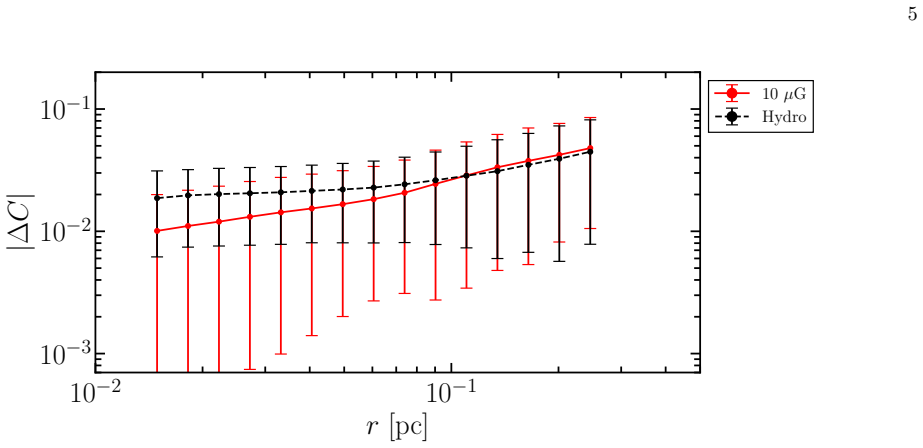
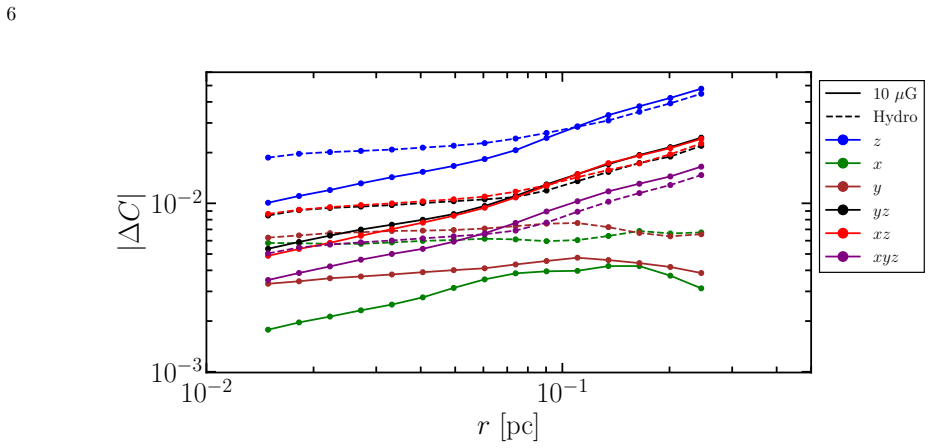
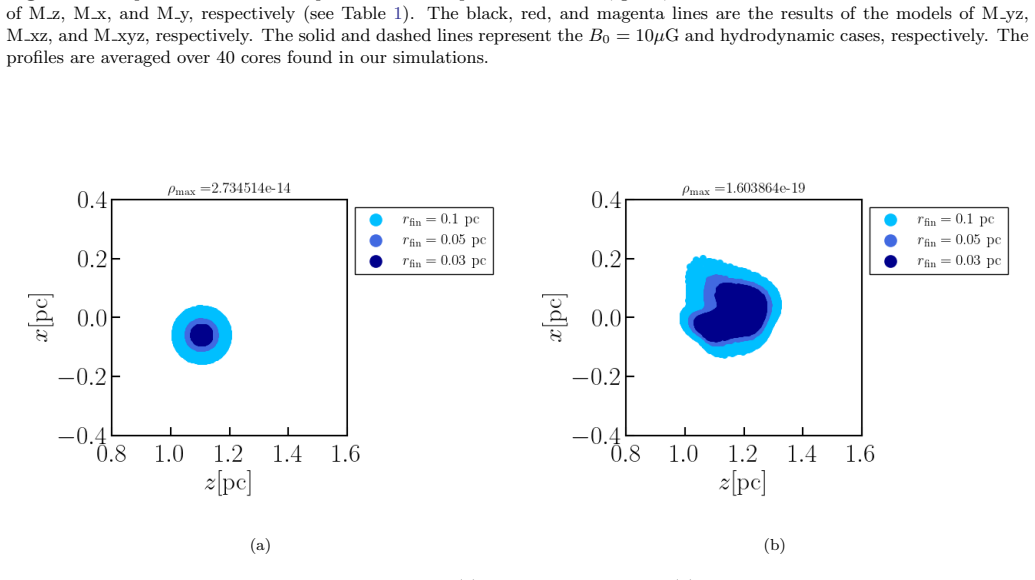
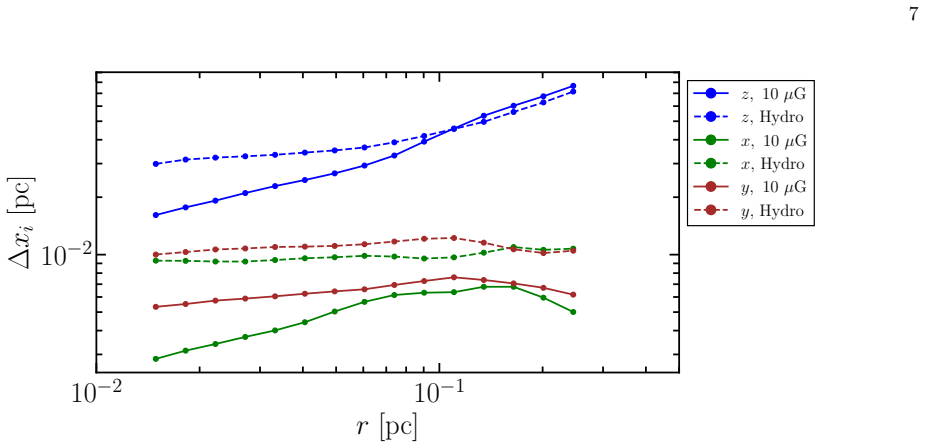
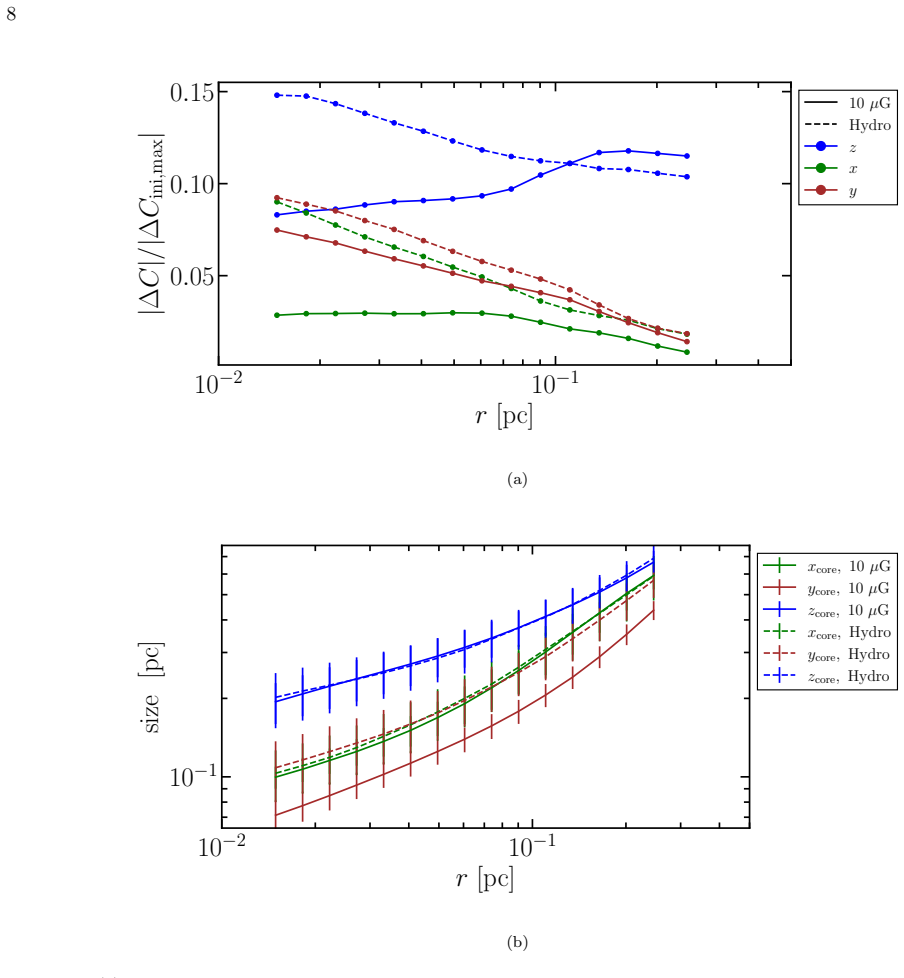
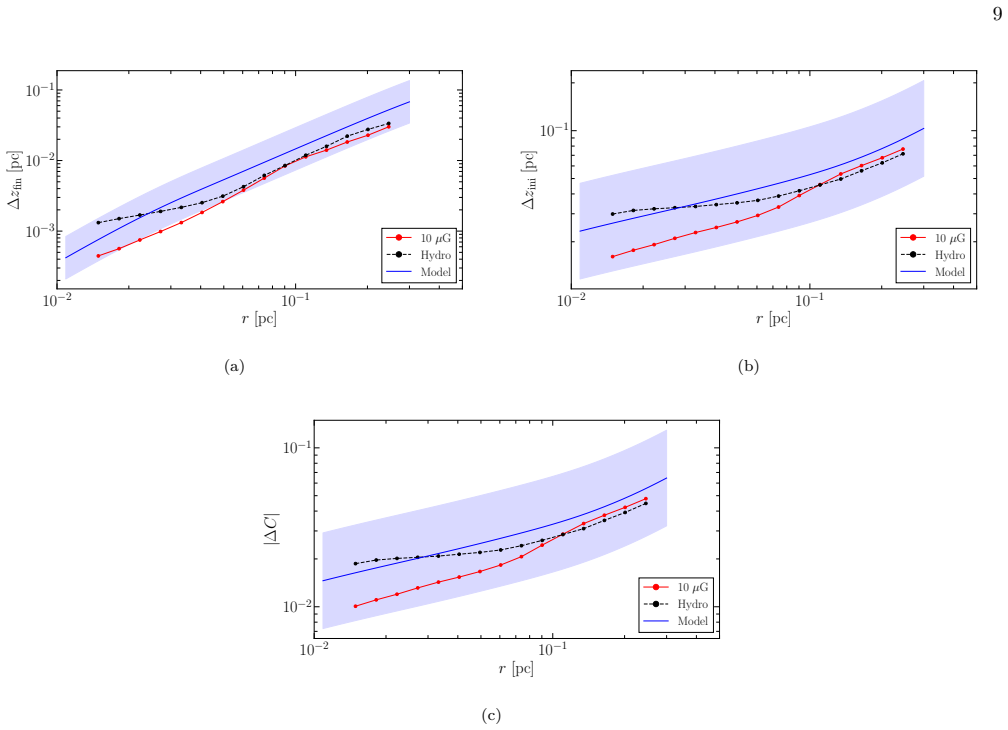
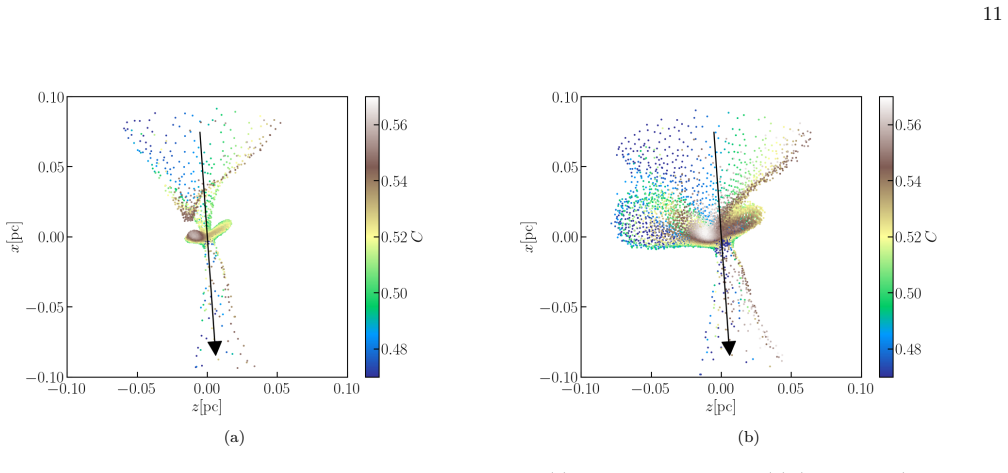
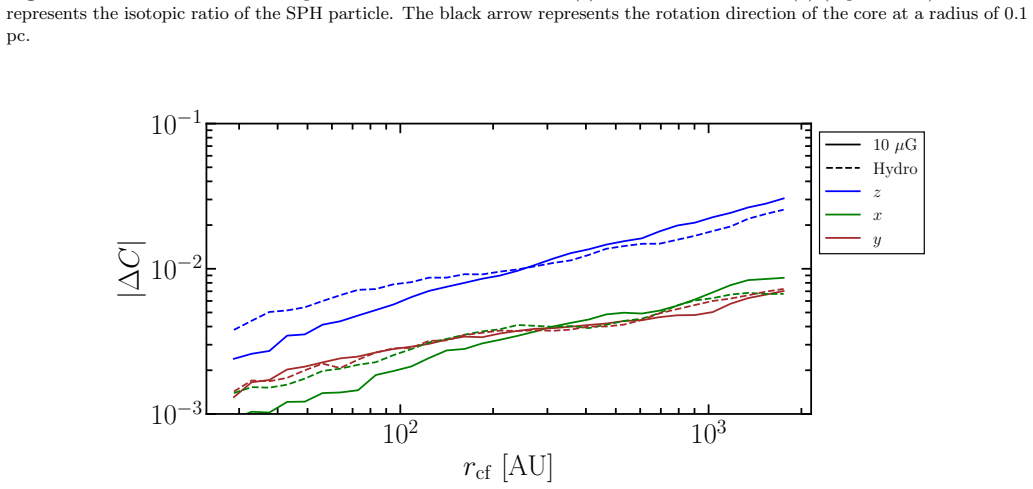
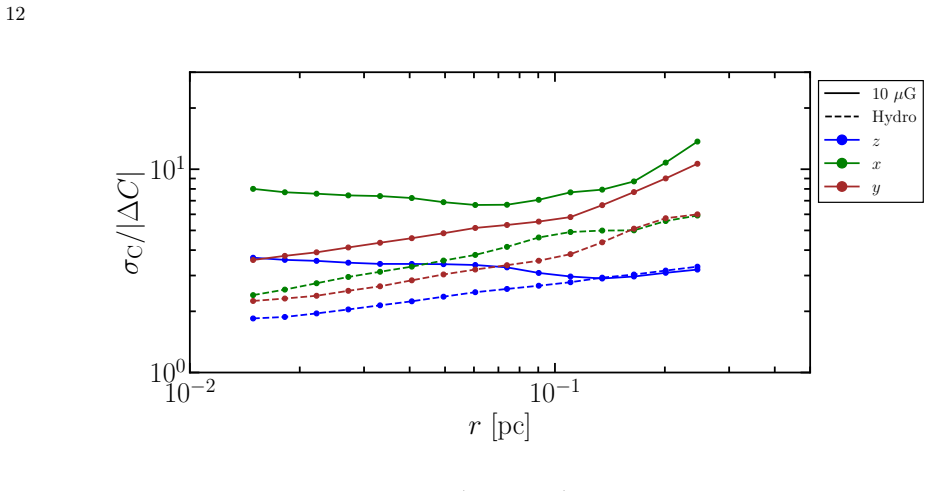
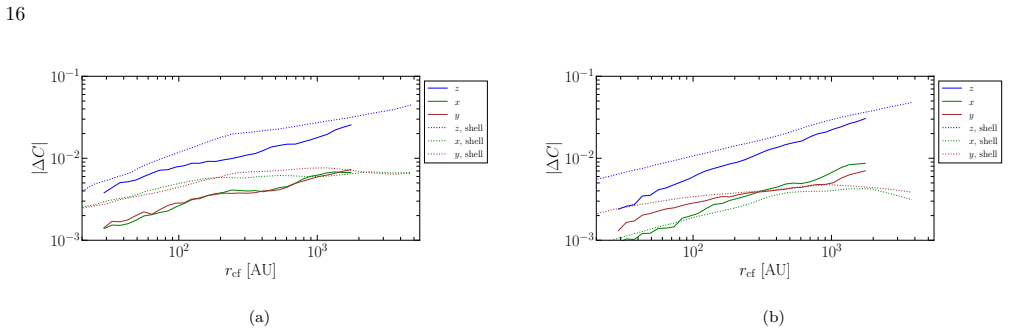
Simulations of filament fragmentation with initial isotopic ratio variations show that the effect along the filament's longitudinal axis exceeds that along the minor axis due to geometry. Inhomogeneities remain in the resulting cores at levels reduced by a factor of 100 from the initial filament scale, amounting to 1-10 percent of the maximum ratio acquirable by each core. Shell inhomogeneities arise from initial center-of-mass differences driven by the turbulent velocity field, and the model indicates that such inhomogeneity can survive even in the circumstellar disk.
What carries the argument
Smoothed particle hydrodynamics simulations of filament fragmentation with imposed initial isotopic ratio variations along the filament length and a turbulent velocity field.
If this is right
- Filament geometry causes longitudinal isotopic variations to dominate over minor-axis variations in the formed cores.
- Initial inhomogeneities are reduced by a factor of 100 yet persist at 1-10 percent of the maximum ratio the core can acquire from the filament.
- Isotopic differences in shells trace to initial center-of-mass offsets induced by the turbulent velocity field.
- Isotopic inhomogeneity inherited from the parental filament can remain present in the circumstellar disk.
Where Pith is reading between the lines
- Meteoritic isotopic anomalies in CAIs could trace directly to filament-scale structures in the parent cloud rather than being generated entirely during disk evolution.
- Observations of isotopic ratios in Class 0/I disks could reveal inherited variations whose amplitude matches the simulated residual levels.
- Different turbulent environments across molecular clouds would be expected to produce a range of isotopic heterogeneity in the resulting planetary systems.
Load-bearing premise
The simulations assume that the chosen initial isotopic ratio variations along the filament and the turbulent velocity field accurately represent real molecular clouds and that the SPH method captures physical mixing without dominant numerical artifacts.
What would settle it
High-resolution isotopic mapping of a sample of young circumstellar disks that shows either complete erasure of variations or levels far below the simulated 1-10 percent retention would falsify the survival claim.
Figures
read the original abstract
Meteorite analysis shows that the older solids of the solar system, such as the calcium-aluminum-rich inclusions (CAIs), have isotopic inhomogeneity. This indicates that the isotopic inhomogeneity could originate from parental molecular clouds. We investigate the evolution of the isotopically heterogeneous molecular cloud cores formed from filament fragmentation using the smoothed particle hydrodynamics method. We show that the effect of the variation of isotopic ratio along the minor axes of the filament is smaller than that along the longitudinal axis of the filament due to the filament geometry. Our results also suggest that isotopic inhomogeneities remain in the resulting cores, although the amounts of initial inhomogeneities are reduced by a factor of 100 from those over the initial filament length of 1 pc. This fraction corresponds to 1-10% of the maximum isotopic ratio that the core can acquire from the filament in each model. The origin of the isotopic inhomogeneity of the shells could be attributed to the initial difference in the center-of-mass of shells caused by the turbulent velocity field. Our model indicates that the isotopic inhomogeneity could survive even in the circumstellar disk.
Editorial analysis
A structured set of objections, weighed in public.
Referee Report
Summary. The paper presents SPH simulations of the fragmentation of a 1-pc filamentary molecular cloud initialized with longitudinal isotopic ratio variations and turbulence. It reports that the initial inhomogeneities are reduced by a factor of ~100 in the resulting cores while persisting at 1-10% of the maximum possible core value, attributes shell inhomogeneity to center-of-mass offsets from the turbulent velocity field, and concludes that the isotopic inhomogeneity could survive into circumstellar disks.
Significance. If the quantitative persistence levels prove robust, the work supplies a concrete hydrodynamical pathway linking observed meteoritic isotopic heterogeneity (e.g., in CAIs) to primordial molecular-cloud structure, using forward simulations that avoid circular fitting and generate falsifiable predictions for core-scale isotopic maps.
major comments (2)
- [Abstract] Abstract: the assertion that 'the isotopic inhomogeneity could survive even in the circumstellar disk' is an extrapolation; the reported SPH runs evolve only the filament-to-core fragmentation stage and contain no protostellar collapse, accretion, or disk-formation calculations that would be required to test survival through later mixing or shocks.
- [Abstract] Abstract: the specific reduction factor of ~100 and the 1-10% persistence range are presented without any accompanying resolution study, convergence test, or parameter sweep on initial amplitude, turbulent driving, or SPH artificial viscosity; these omissions leave the central quantitative claim dependent on unverified numerical fidelity.
Simulated Author's Rebuttal
We thank the referee for the constructive comments. We respond to each major comment below.
read point-by-point responses
-
Referee: [Abstract] Abstract: the assertion that 'the isotopic inhomogeneity could survive even in the circumstellar disk' is an extrapolation; the reported SPH runs evolve only the filament-to-core fragmentation stage and contain no protostellar collapse, accretion, or disk-formation calculations that would be required to test survival through later mixing or shocks.
Authors: We agree that the simulations are limited to the filament-to-core stage and do not model protostellar collapse or disk formation. The abstract uses the cautious phrasing 'could survive' to indicate a possible implication from the core-stage persistence rather than a tested result. We will revise the abstract and conclusion to explicitly note this as an extrapolation and state that dedicated simulations of later evolutionary stages are required to assess survival through mixing or shocks. revision: yes
-
Referee: [Abstract] Abstract: the specific reduction factor of ~100 and the 1-10% persistence range are presented without any accompanying resolution study, convergence test, or parameter sweep on initial amplitude, turbulent driving, or SPH artificial viscosity; these omissions leave the central quantitative claim dependent on unverified numerical fidelity.
Authors: The referee correctly notes the absence of an explicit resolution study or parameter sweep. The quoted reduction factor and persistence range are measured directly from the suite of SPH runs performed at the resolution and with the turbulent driving and viscosity settings described in the methods. We will add a dedicated paragraph in the revised manuscript discussing the adopted numerical parameters, the rationale for the chosen resolution, and the potential sensitivity to artificial viscosity, while acknowledging the lack of a full convergence test as a limitation of the present work. revision: partial
Circularity Check
No circularity; results are direct outputs of forward SPH simulations with stated initial conditions
full rationale
The paper initializes filaments with explicit isotopic ratio variations along longitudinal and minor axes plus a turbulent velocity field, then evolves them via SPH to core formation. Reported outcomes (inhomogeneity reduced by factor ~100 yet persisting at 1-10% levels, shell offsets from center-of-mass differences) are numerical results of that evolution, not quantities fitted to data and relabeled as predictions, nor self-defined via the target result. No equations reduce the final inhomogeneity to the inputs by algebraic construction. The disk-survival remark is an untested extrapolation, but that is a scope limitation rather than circularity. No self-citation chains, uniqueness theorems, or ansatzes imported from prior author work appear as load-bearing steps.
Axiom & Free-Parameter Ledger
free parameters (1)
- initial isotopic ratio variation amplitude and distribution
axioms (1)
- standard math Smoothed particle hydrodynamics accurately models compressible, self-gravitating astrophysical flows with mixing
Reference graph
Works this paper leans on
-
[1]
2021, ApJ, 916, 83, doi: 10.3847/1538-4357/ac07a1
Abe, D., Inoue, T., Inutsuka, S.-i., & Matsumoto, T. 2021, ApJ, 916, 83, doi: 10.3847/1538-4357/ac07a1
-
[2]
Abramowitz, M., & Stegun, I. A. 1965, Handbook of mathematical functions with formulas, graphs, and mathematical tables 17 Andr´ e, P., Di Francesco, J., Ward-Thompson, D., et al. 2014, in Protostars and Planets VI, ed. H. Beuther, R. S
1965
-
[3]
Klessen, C. P. Dullemond, & T. Henning, 27–51, doi: 10.2458/azu uapress 9780816531240-ch002
-
[4]
2013, A&A, 553, A119, doi: 10.1051/0004-6361/201220822
Arzoumanian, D., Andr´ e, P., Peretto, N., & K¨ onyves, V. 2013, A&A, 553, A119, doi: 10.1051/0004-6361/201220822
-
[5]
2011, A&A, 529, L6, doi: 10.1051/0004-6361/201116596
Arzoumanian, D., Andr´ e, P., Didelon, P., et al. 2011, A&A, 529, L6, doi: 10.1051/0004-6361/201116596
-
[6]
2019, A&A, 621, A42, doi: 10.1051/0004-6361/201832725
Arzoumanian, D., Andr´ e, P., K¨ onyves, V., et al. 2019, A&A, 621, A42, doi: 10.1051/0004-6361/201832725
-
[7]
2022, A&A, 660, A56, doi: 10.1051/0004-6361/202141699
Arzoumanian, D., Russeil, D., Zavagno, A., et al. 2022, A&A, 660, A56, doi: 10.1051/0004-6361/202141699
-
[8]
Dauphas, N., Cook, D. L., Sacarabany, A., et al. 2008, ApJ, 686, 560, doi: 10.1086/589959
-
[9]
2002, ApJ, 565, 640, doi: 10.1086/324597
Dauphas, N., Marty, B., & Reisberg, L. 2002, ApJ, 565, 640, doi: 10.1086/324597
-
[10]
Dauphas, N., & Schauble, Edwin, A. 2016, Annual Review of Earth and Plaentary Sciences, 44, 709, doi: 10.1146/annurev-earth-060115-012157
-
[11]
C., Lugaro, M., & Sch¨ onb¨ achler, M
Ek, M., Hunt, T. C., Lugaro, M., & Sch¨ onb¨ achler, M. 2020, Nature Astronomy, 4, 273, doi: 10.1038/s41550-019-0948-z
-
[12]
Federrath, C., Roman-Duval, J., Klessen, R. S., Schmidt, W., & Mac Low, M. M. 2010, A&A, 512, A81, doi: 10.1051/0004-6361/200912437
-
[13]
2009, ApJL, 694, L1, doi: 10.1088/0004-637X/694/1/L1
Gounelle, M., Meibom, A., Hennebelle, P., & Inutsuka, S.-i. 2009, ApJL, 694, L1, doi: 10.1088/0004-637X/694/1/L1
-
[14]
2016, A&A, 587, A97, doi: 10.1051/0004-6361/201526015
Alves, J. 2016, A&A, 587, A97, doi: 10.1051/0004-6361/201526015
-
[15]
2011, A&A, 533, A34, doi: 10.1051/0004-6361/201117039
Hacar, A., & Tafalla, M. 2011, A&A, 533, A34, doi: 10.1051/0004-6361/201117039
-
[16]
Harris, C. R., Millman, K. J., van der Walt, S. J., et al. 2020, Nature, 585, 357, doi: 10.1038/s41586-020-2649-2
-
[17]
Heitsch, F., Stone, J. M., & Hartmann, L. W. 2009, ApJ, 695, 248, doi: 10.1088/0004-637X/695/1/248
-
[18]
Hunter, J. D. 2007, Computing in Science & Engineering, 9, 90, doi: 10.1109/MCSE.2007.55
-
[19]
2008, ApJ, 687, 303, doi: 10.1086/590528 —
Inoue, T., & Inutsuka, S.-i. 2008, ApJ, 687, 303, doi: 10.1086/590528 —. 2009, ApJ, 704, 161, doi: 10.1088/0004-637X/704/1/161 —. 2012, ApJ, 759, 35, doi: 10.1088/0004-637X/759/1/35
-
[20]
2001, ApJL, 559, L149, doi: 10.1086/323786
Inutsuka, S. 2001, ApJL, 559, L149, doi: 10.1086/323786
-
[21]
Inutsuka, S., & Miyama, S. M. 1992, ApJ, 388, 392, doi: 10.1086/171162
-
[22]
2015, A&A, 580, A49, doi: 10.1051/0004-6361/201425584
Inutsuka, S.-i., Inoue, T., Iwasaki, K., & Hosokawa, T. 2015, A&A, 580, A49, doi: 10.1051/0004-6361/201425584
-
[23]
Iwasaki, K., & Inutsuka, S. 2011, MNRAS, 418, 1668, doi: 10.1111/j.1365-2966.2011.19588.x
-
[24]
2013, in Astronomical Society of the Pacific Conference Series, Vol
Iwasaki, K., & Inutsuka, S. 2013, in Astronomical Society of the Pacific Conference Series, Vol. 474, Numerical Modeling of Space Plasma Flows (ASTRONUM2012), ed. N. V. Pogorelov, E. Audit, & G. P. Zank, 239
2013
-
[25]
2019, ApJ, 873, 6, doi: 10.3847/1538-4357/ab02ff
Iwasaki, K., Tomida, K., Inoue, T., & Inutsuka, S.-i. 2019, ApJ, 873, 6, doi: 10.3847/1538-4357/ab02ff
-
[26]
2016, PASJ, 68, 54, doi: 10.1093/pasj/psw053
Iwasawa, M., Tanikawa, A., Hosono, N., et al. 2016, PASJ, 68, 54, doi: 10.1093/pasj/psw053
-
[27]
C., Chaussidon, M., & Charnoz, S
Jacquet, E., Pignatale, F. C., Chaussidon, M., & Charnoz, S. 2019, ApJ, 884, 11, doi: 10.3847/1538-4357/ab38c1
-
[28]
2005, ApJL, 630, L45, doi: 10.1086/491600
Kim, J., & Ryu, D. 2005, ApJL, 630, L45, doi: 10.1086/491600
-
[29]
Nakatsugawa, H. 2022, ApJ, 930, 76, doi: 10.3847/1538-4357/ac5a54 K¨ onyves, V., Andr´ e, P., Men’shchikov, A., et al. 2015, A&A, 584, A91, doi: 10.1051/0004-6361/201525861 K¨ ortgen, B., & Banerjee, R. 2015, MNRAS, 451, 3340, doi: 10.1093/mnras/stv1200
-
[30]
Kuffmeier, M., Calcutt, H., & Kristensen, L. E. 2019, A&A, 628, A112, doi: 10.1051/0004-6361/201935504
-
[31]
Larson, R. B. 1969, MNRAS, 145, 271, doi: 10.1093/mnras/145.3.271
-
[32]
2024, ApJ, 963, 106, doi: 10.3847/1538-4357/ad1990
Misugi, Y., Inutsuka, S., Arzoumanian, D., & Tsukamoto, Y. 2024, ApJ, 963, 106, doi: 10.3847/1538-4357/ad1990
-
[33]
2019, ApJ, 881, 11, doi: 10.3847/1538-4357/ab2382
Misugi, Y., Inutsuka, S.-i., & Arzoumanian, D. 2019, ApJ, 881, 11, doi: 10.3847/1538-4357/ab2382
-
[34]
2022, MNRAS, 514, 105, doi: 10.1093/mnras/stac1012
Pan, L., Ju, W., & Chen, J.-H. 2022, MNRAS, 514, 105, doi: 10.1093/mnras/stac1012
-
[35]
2016, ApJ, 825, 30, doi: 10.3847/0004-637X/825/1/30
Pan, L., Padoan, P., Haugbølle, T., & Nordlund, ˚A. 2016, ApJ, 825, 30, doi: 10.3847/0004-637X/825/1/30
-
[36]
Penston, M. V. 1969, MNRAS, 144, 425, doi: 10.1093/mnras/144.4.425
-
[37]
E., Segura-Cox, D., Caselli, P., et al
Pineda, J. E., Segura-Cox, D., Caselli, P., et al. 2020, Nature Astronomy, 4, 1158, doi: 10.1038/s41550-020-1150-z
-
[38]
E., Arzoumanian, D., Andre, P., et al
Pineda, J. E., Arzoumanian, D., Andre, P., et al. 2023, in Astronomical Society of the Pacific Conference Series, Vol. 534, Protostars and Planets VII, ed. S. Inutsuka, Y. Aikawa, T. Muto, K. Tomida, & M. Tamura, 233, doi: 10.48550/arXiv.2205.03935
-
[39]
2015, A&A, 584, A111, doi: 10.1051/0004-6361/201526431
Roy, A., Andr´ e, P., Arzoumanian, D., et al. 2015, A&A, 584, A111, doi: 10.1051/0004-6361/201526431
-
[40]
2024, ApJ, 963, 20, doi: 10.3847/1538-4357/ad187a
Takaishi, D., Tsukamoto, Y., Kido, M., et al. 2024, ApJ, 963, 20, doi: 10.3847/1538-4357/ad187a
-
[41]
2009, Science, 324, 374, doi: 10.1126/science.1168221
Trinquier, A., Elliot, T., Ulfbeck, D., et al. 2009, Science, 324, 374, doi: 10.1126/science.1168221
-
[42]
2016, A&A, 587, A76, doi: 10.1051/0004-6361/201527325 18 van Loo, S., Falle, S
Valdivia, V., Hennebelle, P., G´ erin, M., & Lesaffre, P. 2016, A&A, 587, A76, doi: 10.1051/0004-6361/201527325 18 van Loo, S., Falle, S. A. E. G., Hartquist, T. W., & Moore, T. J. T. 2007, A&A, 471, 213, doi: 10.1051/0004-6361:20077430
discussion (0)
Sign in with ORCID, Apple, or X to comment. Anyone can read and Pith papers without signing in.