A Gaia-linked High-purity QSO Candidate Catalog in Selected Fields with Extinction-binned Calibration and Spectrum-informed Training
Pith reviewed 2026-05-25 03:32 UTC · model grok-4.3
The pith
Spectrum-informed selector on Gaia sources reaches 0.9809 purity and 0.8869 completeness for QSO candidates, versus 0.4493 for the official Gaia probability at matched threshold.
A machine-rendered reading of the paper's core claim, the machinery that carries it, and where it could break.
Core claim
At the recommended conservative operating point calibrated to a validation-set purity of 0.98, the P3 spectrum-informed catalog selector achieves a measured test-set purity of 0.9809 and a spectroscopic-label completeness of 0.8869 within the frozen Gaia-linked benchmark, whereas the Gaia official QSO probability yields a spectroscopic-label completeness of 0.4493 under the same threshold protocol.
What carries the argument
The P3 spectrum-informed catalog selector that trains on Gaia-linked sources via a source-grouped spectrum-teacher model but applies only astrometric, photometric, and catalog features at inference, together with E(B-V)-binned threshold calibration across layered field domains.
If this is right
- The catalog supplies source identifiers, field assignments, input-coverage flags, calibrated scores, threshold flags, and validation metadata ready for fiber follow-up scheduling.
- Performance metrics are reported separately for the four-field core domain, four application or stress-test fields, and the COSMOS extreme-deep case.
- Relative to the earlier P2 teacher, P3 produces a modest mean completeness gain across seeds, most visible in higher-extinction and faint-source subsets, at a small cost in purity.
- The released empirical selection-function product allows downstream users to apply the same thresholds and coverage cuts in the covered fields.
Where Pith is reading between the lines
- If the held-out protocol continues to block leakage, the same teacher could be reused to generate catalogs in additional fields that share similar photometric coverage.
- The purity-first design implies the catalog is most useful when telescope time is limited and the cost of observing non-QSOs is high.
- In regions where the Gaia-linked parent sample is shallower than deeper photometric catalogs, the output is best treated as a prioritized target list rather than a statistically complete sample.
Load-bearing premise
Excluding downstream validation and test Gaia source IDs from teacher fitting and checkpoint selection, while using teacher probabilities only for training rows, prevents spectra from leaking into the final purity and completeness numbers.
What would settle it
An independent spectroscopic campaign on sources inside one of the application fields that counts how many catalog-selected objects are confirmed QSOs versus contaminants and how many known QSOs fall below the threshold.
Figures




read the original abstract
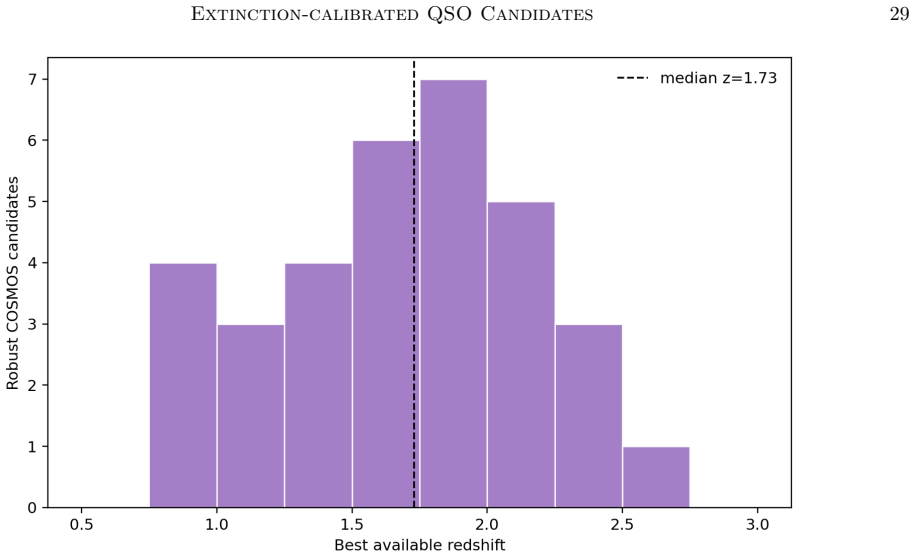
We present an extinction-calibrated, Gaia-source-level QSO candidate catalog for selected fields, designed as a high-purity input catalog for fiber-spectroscopic follow-up rather than as an all-sky QSO census. The deployed selector uses Gaia astrometry and photometry, optical/infrared catalog features, and E(B-V)-binned threshold calibration; spectra are used only during training via a source-grouped spectrum-teacher model. The sample definition is layered: a four-field core domain ladder provides the main validation baseline, four application/stress-test fields probe portability, and COSMOS is treated separately as an Extreme Deep boundary case. At the recommended conservative operating point, calibrated to a validation-set purity of 0.98, the P3 spectrum-informed catalog selector achieves a measured test-set purity of 0.9809 and a spectroscopic-label completeness of 0.8869 within the frozen Gaia-linked benchmark, whereas the Gaia official QSO probability yields a spectroscopic-label completeness of 0.4493 under the same threshold protocol. The evaluation protocol excludes downstream validation/test Gaia source IDs from teacher fitting and checkpoint selection, and uses teacher probabilities only for downstream training rows. Relative to the earlier P2 teacher, P3 yields a modest mean completeness gain across five seeds, with a small decrease in purity and a small increase in false positives; the gain is most evident in higher-extinction and faint-source diagnostics. The released product is a catalog and empirical selection-function data product with source identifiers, field-layer assignments, input-coverage flags, calibrated scores, threshold flags, validation metadata, and provenance/QC fields. In COSMOS, the Gaia-linked parent set is much shallower than COSMOS2020; the robust 39-object subset is interpreted as a purity-oriented priority list rather than a completeness measurement.
Editorial analysis
A structured set of objections, weighed in public.
Referee Report
Summary. The manuscript presents an extinction-calibrated, Gaia-source-level QSO candidate catalog for selected fields, intended as a high-purity input for fiber spectroscopy. It deploys a selector using Gaia astrometry/photometry plus optical/IR features with E(B-V)-binned thresholds; spectra enter only via a source-grouped teacher model during training. The core claim is that at the conservative operating point calibrated to 0.98 validation purity, the P3 selector reaches test-set purity 0.9809 and spectroscopic-label completeness 0.8869 (versus 0.4493 for Gaia official QSO probability) within a frozen Gaia-linked benchmark, with an explicit protocol excluding downstream validation/test IDs from teacher fitting and restricting teacher probabilities to training rows only. The work also reports modest gains over an earlier P2 teacher and releases the catalog plus selection-function data product.
Significance. If the leakage-prevention protocol is shown to be sufficient, the result supplies a practical, field-portable high-purity QSO candidate list with quantified completeness advantage over the Gaia baseline, especially in higher-extinction regimes. The layered domain design (core ladder, stress-test fields, COSMOS boundary case) and release of provenance/QC metadata strengthen reproducibility for follow-up programs.
major comments (3)
- [Abstract and §4] Abstract and §4 (Evaluation Protocol): the headline metrics (test purity 0.9809, completeness 0.8869) rest on the claim that no spectrum information from validation/test Gaia IDs reaches the final selector. The stated exclusion of those IDs from teacher fitting and checkpoint selection, plus restriction of teacher probabilities to training rows, is described, but the source-grouped nature of the spectrum-teacher is not accompanied by an explicit statement that groups are strictly contained within the train/val/test partitions or that grouping metadata was derived only after the split. This is load-bearing for the no-leakage guarantee.
- [§5] §5 (Results, Table 2 or equivalent): the reported test-set purity and completeness are given to four decimal places without accompanying counts (N_test, TP, FP) or uncertainty estimates (binomial, bootstrap, or field-to-field variance). Because the central claim is a quantitative improvement over Gaia at fixed purity, these raw numbers and error bars are required to assess whether the 0.0009 purity difference and 0.4376 completeness gain are statistically meaningful.
- [§3.2] §3.2 (Teacher Model): the source-grouping procedure for the spectrum-teacher is introduced but the manuscript does not state the grouping criterion (e.g., coordinate proximity, proper-motion clustering) or demonstrate that the grouping was performed independently of the downstream train/val/test split. This detail directly affects whether the weakest assumption identified in the stress-test note holds.
minor comments (2)
- [Abstract and §2] The abstract states “four-field core domain ladder” and “four application/stress-test fields” but does not list the field names or coordinates; a short table or explicit list in §2 would improve clarity.
- [§3] Notation for the P3 selector versus the Gaia official probability is introduced without a compact comparison table of input features; adding such a table in §3 would aid readers.
Simulated Author's Rebuttal
We thank the referee for the constructive comments. We address each major point below and will revise the manuscript accordingly to strengthen the description of the no-leakage protocol, add required counts and uncertainties, and clarify the teacher grouping details.
read point-by-point responses
-
Referee: [Abstract and §4] the source-grouped nature of the spectrum-teacher is not accompanied by an explicit statement that groups are strictly contained within the train/val/test partitions or that grouping metadata was derived only after the split. This is load-bearing for the no-leakage guarantee.
Authors: We agree an explicit statement is required. The revised text will state that source groups are strictly contained within their train/val/test partitions and that grouping metadata was derived only after the split, using only training IDs for teacher fitting. This directly supports the existing exclusion protocol without changing any results. revision: yes
-
Referee: [§5] the reported test-set purity and completeness are given to four decimal places without accompanying counts (N_test, TP, FP) or uncertainty estimates (binomial, bootstrap, or field-to-field variance).
Authors: We agree these details are needed to assess significance of the 0.0009 purity difference and completeness gain. The revision will add N_test, TP, FP counts plus binomial or bootstrap uncertainties to Table 2 and the text. revision: yes
-
Referee: [§3.2] the manuscript does not state the grouping criterion or demonstrate that the grouping was performed independently of the downstream train/val/test split.
Authors: We will revise §3.2 to state the criterion (coordinate proximity <1 arcsec plus proper-motion DBSCAN clustering) and add a demonstration that grouping was performed independently with post-split verification that no group crosses partitions, ensuring teacher training isolation. revision: yes
Circularity Check
No significant circularity; protocol explicitly isolates teacher training from test metrics
full rationale
The paper states that spectra enter only via a source-grouped teacher model whose fitting and checkpoint selection explicitly exclude all downstream validation/test Gaia source IDs, with teacher probabilities restricted to training rows only. The reported test purity (0.9809) and completeness (0.8869) are therefore measured on a frozen benchmark after this exclusion. No equations, fitted parameters renamed as predictions, or self-citation chains appear in the provided text that would reduce the central performance claim to its own inputs by construction. The evaluation protocol is presented as sufficient to keep the metrics independent, satisfying the default expectation of a self-contained result.
Axiom & Free-Parameter Ledger
free parameters (1)
- E(B-V) bin thresholds
axioms (1)
- domain assumption Gaia astrometry and photometry combined with optical/infrared features can distinguish QSOs from stars and galaxies
Lean theorems connected to this paper
-
IndisputableMonolith/Cost/FunctionalEquation.leanwashburn_uniqueness_aczel unclear?
unclearRelation between the paper passage and the cited Recognition theorem.
The deployed selector uses Gaia astrometry and photometry, optical/infrared catalog features, and E(B-V)-binned threshold calibration; spectra are used only during training via a source-grouped spectrum-teacher model.
-
IndisputableMonolith/Foundation/RealityFromDistinction.leanreality_from_one_distinction unclear?
unclearRelation between the paper passage and the cited Recognition theorem.
At the recommended conservative operating point, calibrated to a validation-set purity of 0.98, the P3 spectrum-informed catalog selector achieves a measured test-set purity of 0.9809
What do these tags mean?
- matches
- The paper's claim is directly supported by a theorem in the formal canon.
- supports
- The theorem supports part of the paper's argument, but the paper may add assumptions or extra steps.
- extends
- The paper goes beyond the formal theorem; the theorem is a base layer rather than the whole result.
- uses
- The paper appears to rely on the theorem as machinery.
- contradicts
- The paper's claim conflicts with a theorem or certificate in the canon.
- unclear
- Pith found a possible connection, but the passage is too broad, indirect, or ambiguous to say the theorem truly supports the claim.
Reference graph
Works this paper leans on
-
[1]
Bilicki, M., Peacock, J. A., Jarrett, T. H., et al. 2016, The Astrophysical Journal Supplement Series, 225, 5, doi: 10.3847/0067-0049/225/1/5
-
[2]
Bovy, J., Hennawi, J. F., Hogg, D. W., et al. 2010, Think Outside the Color Box: Probabilistic Target Selection and the SDSS-XDQSO Quasar Targeting Catalog, doi: 10.1088/0004-637X/729/2/141
-
[3]
Bovy, J., Myers, A. D., Hennawi, J. F., et al. 2011, Photometric redshifts and quasar probabilities from a single, data-driven generative model, doi: 10.1088/0004-637X/749/1/41
-
[4]
Braun, R., Bourke, T. L., Green, J. A., Keane, E., & Wagg, J., eds. 2015, Advancing Astrophysics with the Square Kilometre Array (Proceedings of Science). https://pos.sissa.it/215/
work page 2015
-
[5]
Budavari, T., & Szalay, A. S. 2007, Probabilistic Cross-Identification of Astronomical Sources, doi: 10.1086/587156
-
[7]
Byrne, X., Meyer, R. A., Farina, E. P., et al. 2024b, Quasar Island – Three newz∼6 quasars, including a lensed candidate, identified with contrastive learning, https://arxiv.org/abs/2403.17903
-
[8]
2025, Science China Physics, Mechanics & Astronomy, 68, 280403, doi: 10.1007/s11433-025-2725-3
Cai, Z., Huang, S., Liu, Y., Zhao, C., & Huang, L. 2025, Science China Physics, Mechanics & Astronomy, 68, 280403, doi: 10.1007/s11433-025-2725-3
-
[9]
2022, Research in Astronomy and Astrophysics, 22, 025019, doi: 10.1088/1674-4527/ac424e
Cao, Y., Gong, Y., Zheng, Z.-Y., & Xu, C. 2022, Research in Astronomy and Astrophysics, 22, 025019, doi: 10.1088/1674-4527/ac424e
-
[10]
2022, Target Selection and Validation of DESI Quasars, doi: 10.3847/1538-4357/acb3c2
Chaussidon, E., Yeche, C., Palanque-Delabrouille, N., et al. 2022, Target Selection and Validation of DESI Quasars, doi: 10.3847/1538-4357/acb3c2
-
[11]
2020, Towards Threshold Invariant Fair Classification, https://arxiv.org/abs/2006.10667
Chen, M., & Wu, M. 2020, Towards Threshold Invariant Fair Classification, https://arxiv.org/abs/2006.10667
-
[12]
Chou, M.-Y., Majewski, S. R., Cunha, K., et al. 2010, The Chemical Evolution of the Monoceros Ring/Galactic Anticenter Stellar Structure, doi: 10.1088/2041-8205/720/1/L5
-
[13]
The DESI Experiment Part I: Science,Targeting, and Survey Design
Collaboration, D., Aghamousa, A., Aguilar, J., et al. 2016, The DESI Experiment Part I: Science,Targeting, and Survey Design, https://arxiv.org/abs/1611.00036
work page internal anchor Pith review Pith/arXiv arXiv 2016
-
[14]
Data Release 1 of the Dark Energy Spectroscopic Instrument
Collaboration, D., Karim, M. A., Adame, A. G., et al. 2025, Data Release 1 of the Dark Energy Spectroscopic Instrument, https://arxiv.org/abs/2503.14745
work page internal anchor Pith review Pith/arXiv arXiv 2025
-
[15]
Collaboration, G., Bailer-Jones, C. A. L., Teyssier, D., et al. 2022, Gaia Data Release 3: The extragalactic content, doi: 10.1051/0004-6361/202243232
-
[16]
Collaboration, P., Ade, P. A. R., Aghanim, N., et al. 2013, Planck 2013 results. XVI. Cosmological parameters, doi: 10.1051/0004-6361/201321591
-
[17]
Collaboration, S., & Berk, D. E. V. 2001, Composite Quasar Spectra From the Sloan Digital Sky Survey, doi: 10.1086/321167
-
[18]
Collaboration, S., et al. 2022, The Eighteenth Data Release of the Sloan Digital Sky Surveys: Targeting and First Spectra from SDSS-V, https://arxiv.org/abs/2507.07093
- [19]
-
[20]
M., Hartmann, D., & Thaddeus, P
Dame, T. M., Hartmann, D., & Thaddeus, P. 2000, The Milky Way in Molecular Clouds: A New Complete CO Survey, doi: 10.1086/318388
work page internal anchor Pith review doi:10.1086/318388 2000
-
[21]
Delchambre, L., Bailer-Jones, C. A. L., Bellas-Velidis, I., et al. 2022, Gaia DR3: Apsis III – Non-stellar content and source classification, doi: 10.1051/0004-6361/202243423 DESI Collaboration, Abareshi, B., et al. 2022, The Astronomical Journal, 164, 207, doi: 10.3847/1538-3881/ac882b
-
[22]
Dey, A., Schlegel, D. J., Lang, D., et al. 2018, Overview of the DESI Legacy Imaging Surveys, doi: 10.3847/1538-3881/ab089d Dong, et al. 2018, LAMOST QSO DR2-DR3,
-
[23]
Feng, H.-M., Cao, Z.-H., Lam, M. I., et al. 2024, Research in Astronomy and Astrophysics, 24, 045004, doi: 10.1088/1674-4527/ad26b6
-
[24]
2019, The Astrophysical Journal, 883, 203, doi: 10.3847/1538-4357/ab391e
Gong, Y., Liu, X., Cao, Y., et al. 2019, The Astrophysical Journal, 883, 203, doi: 10.3847/1538-4357/ab391e
-
[25]
Guo, C., Pleiss, G., Sun, Y., & Weinberger, K. Q. 2017, On Calibration of Modern Neural Networks, https://arxiv.org/abs/1706.04599
work page internal anchor Pith review Pith/arXiv arXiv 2017
-
[26]
Hernitschek, N., Schlafly, E. F., Sesar, B., et al. 2016, The Astrophysical Journal, 817, 73, doi: 10.3847/0004-637X/817/1/73
-
[27]
Hickox, R. C., & Alexander, D. M. 2018, Obscured Active Galactic Nuclei, doi: 10.1146/annurev-astro-081817-051803
-
[28]
Distilling the Knowledge in a Neural Network
Hinton, G., Vinyals, O., & Dean, J. 2015, Distilling the Knowledge in a Neural Network, https://arxiv.org/abs/1503.02531
work page internal anchor Pith review Pith/arXiv arXiv 2015
-
[30]
Hughes, A. C. N., Bailer-Jones, C. A. L., & Jamal, S. 2022b, Quasar and galaxy classification using Gaia EDR3 and CatWise2020, doi: 10.1051/0004-6361/202244859
-
[31]
2016, in Proceedings of MeerKAT Science: On the Pathway to the SKA, 006, doi: 10.22323/1.277.0006
Jarvis, M., Taylor, R., Agudo, I., et al. 2016, in Proceedings of MeerKAT Science: On the Pathway to the SKA, 006, doi: 10.22323/1.277.0006
-
[32]
Jin, J.-J., Wu, X.-B., Fu, Y., et al. 2022, The Large Sky Area Multi-object Fiber Spectroscopic Telescope (LAMOST) Quasar Survey: Quasar Properties from Data Release Six to Nine, doi: 10.3847/1538-4365/acaf89
-
[33]
C., Bechtold, J., & Siemiginowska, A
Kelly, B. C., Bechtold, J., & Siemiginowska, A. 2009, Are the Variations in Quasar Optical Flux Driven by Thermal Fluctuations? doi: 10.1088/0004-637X/698/1/895
-
[34]
Inherent Trade-Offs in the Fair Determination of Risk Scores
Kleinberg, J., Mullainathan, S., & Raghavan, M. 2016, Inherent Trade-Offs in the Fair Determination of Risk Scores, https://arxiv.org/abs/1609.05807
work page internal anchor Pith review Pith/arXiv arXiv 2016
-
[35]
Krawczyk, C. M., Richards, G. T., Mehta, S. S., et al. 2013, Mean Spectral Energy Distributions and Bolometric Corrections for Luminous Quasars, doi: 10.1088/0067-0049/206/1/4
-
[36]
Lacy, M., Baum, S. A., Chandler, C. J., et al. 2020, Publications of the Astronomical Society of the Pacific, 132, 035001, doi: 10.1088/1538-3873/ab63eb
-
[37]
Laigle, C., McCracken, H. J., Ilbert, O., et al. 2016, The COSMOS2015 Catalog: Exploring the 1¡z¡6 Universe with half a million galaxies, doi: 10.3847/0067-0049/224/2/24
-
[38]
2014, unWISE: unblurred coadds of the WISE imaging, doi: 10.1088/0004-6256/147/5/108
Lang, D. 2014, unWISE: unblurred coadds of the WISE imaging, doi: 10.1088/0004-6256/147/5/108
-
[39]
Lindegren, L., Bastian, U., Biermann, M., et al. 2020, Gaia Early Data Release 3: Parallax bias versus magnitude, colour, and position, doi: 10.1051/0004-6361/202039653
-
[40]
Luo, A. L., Zhao, Y. H., Zhao, G., et al. 2015, The First Data Release (DR1) of the LAMOST general survey, doi: 10.1088/1674-4527/15/8/002
-
[41]
Lyu, B., Wu, X.-B., Jin, J.-J., et al. 2025, The Large Sky Area Multi-object Fiber Spectroscopic Telescope (LAMOST) Quasar Survey: Quasar Properties from Data Release 10 to 12, doi: 10.3847/1538-4365/ae2b6e
-
[42]
MacLeod, C. L., Ivezic, Z., Kochanek, C. S., et al. 2010, Modeling the Time Variability of SDSS Stripe 82 Quasars as a Damped Random Walk, doi: 10.1088/0004-637X/721/2/1014
-
[43]
2015, The Chandra COSMOS Legacy survey: optical/IR identifications, doi: 10.3847/0004-637X/817/1/34
Marchesi, S., Civano, F., Elvis, M., et al. 2015, The Chandra COSMOS Legacy survey: optical/IR identifications, doi: 10.3847/0004-637X/817/1/34
-
[44]
Marocco, F., Eisenhardt, P. R. M., Fowler, J. W., et al. 2020, The CatWISE2020 Catalog, doi: 10.3847/1538-4365/abd805
-
[45]
D., Palanque-Delabrouille, N., Prakash, A., et al
Myers, A. D., Palanque-Delabrouille, N., Prakash, A., et al. 2015, The SDSS-IV extended Baryon Oscillation Spectroscopic Survey: Quasar Target Selection, doi: 10.1088/0067-0049/221/2/27
-
[46]
Nakoneczny, S. J., Graham, M. J., Stern, D., et al. 2025, QZO: A Catalog of 5 Million Quasars from the Zwicky Transient Facility, https://arxiv.org/abs/2502.13054
-
[47]
Norris, R. P., Hopkins, A. M., Afonso, J., et al. 2011, Publications of the Astronomical Society of Australia, 28, 215, doi: 10.1071/AS11021 OpenAI. 2026, ChatGPT, https://chatgpt.com/
-
[48]
Peters, C. M., Richards, G. T., Myers, A. D., et al. 2015, Quasar Classification Using Color and Variability, doi: 10.1088/0004-637X
-
[49]
Weinberger, K. Q. 2017, On Fairness and Calibration, https://arxiv.org/abs/1709.02012
work page internal anchor Pith review Pith/arXiv arXiv 2017
-
[50]
Polsterer, K. L., Zinn, P. C., & Gieseke, F. 2013, Monthly Notices of the Royal Astronomical Society, 428, 226, doi: 10.1093/mnras/sts017
-
[51]
Learning Transferable Visual Models From Natural Language Supervision
Radford, A., Kim, J. W., Hallacy, C., et al. 2021, Learning Transferable Visual Models From Natural Language Supervision, https://arxiv.org/abs/2103.00020
work page internal anchor Pith review Pith/arXiv arXiv 2021
-
[52]
Rajanala, S., Bates, S., Hastie, T., & Tibshirani, R. 2022, Confidence Intervals for the Generalisation Error of Random Forests, https://arxiv.org/abs/2201.11210
-
[53]
Raschka, S. 2018, Model Evaluation, Model Selection, and Algorithm Selection in Machine Learning, https://arxiv.org/abs/1811.12808
-
[54]
Richards, G. T., Fan, X., Schneider, D. P., et al. 2000, Colors of 2625 Quasars at 0¡z¡5 Measured in the Sloan Digital Sky Survey Photometric System, doi: 10.1086/320392
-
[55]
Richards, G. T., Fan, X., Newberg, H. J., et al. 2002, Spectroscopic Target Selection in the Sloan Digital Sky Survey: The Quasar Sample, doi: 10.1086/340187
-
[56]
Richards, G. T., Nichol, R. C., Gray, A. G., et al. 2004, Efficient Photometric Selection of Quasars from the Sloan Digital Sky Survey: 100,000 z¡3 Quasars from Data Release One, doi: 10.1086/425356
-
[57]
Rix, J. P. D. M.-D. H.-W. 2007, Unraveling the origin of the Monoceros Stellar Ring, https://arxiv.org/abs/astro-ph/0703601
work page internal anchor Pith review Pith/arXiv arXiv 2007
- [58]
-
[59]
Ross, N. P., Myers, A. D., Sheldon, E. S., et al. 2011, The SDSS-III Baryon Oscillation Spectroscopic Survey: Quasar Target Selection for Data Release Nine, doi: 10.1088/0067-0049/199/1/3 46Cao et al
-
[60]
Schlafly, E. F., & Finkbeiner, D. P. 2010, Measuring Reddening with SDSS Stellar Spectra and Recalibrating SFD, doi: 10.1088/0004-637X/737/2/103
work page internal anchor Pith review doi:10.1088/0004-637x/737/2/103 2010
-
[61]
Schlafly, E. F., Meisner, A. M., & Green, G. M. 2019, The unWISE Catalog: Two Billion Infrared Sources from Five Years of WISE Imaging, doi: 10.3847/1538-4365/aafbea
-
[62]
Maps of Dust IR Emission for Use in Estimation of Reddening and CMBR Foregrounds
Schlegel, D. J., Finkbeiner, D. P., & Davis, M. 1997, Maps of Dust IR Emission for Use in Estimation of Reddening and CMBR Foregrounds, doi: 10.1086/305772 Schneider, et al. 2010, THE SLOAN DIGITAL SKY SURVEY QUASAR CATALOG. V. SEVENTH DATA RELEASE, https://doi.org/10.1088/0004-6256/139/6/2360
work page internal anchor Pith review doi:10.1086/305772 1997
-
[63]
2006, The Cosmic Evolution Survey (COSMOS) – Overview, doi: 10.1086/516585
Scoville, N., Aussel, H., Brusa, M., et al. 2006, The Cosmic Evolution Survey (COSMOS) – Overview, doi: 10.1086/516585
-
[64]
Secrest, N., Dudik, R., Dorland, B., et al. 2015, Identification of 1.4 Million AGNs in the Mid-Infrared using WISE Data, doi: 10.1088/0067-0049/221/1/12
-
[65]
Shimwell, T. W., Hardcastle, M. J., Tasse, C., et al. 2022, Astronomy & Astrophysics, 659, A1, doi: 10.1051/0004-6361/202142484
-
[66]
Smolcic, V., Novak, M., Bondi, M., et al. 2017, The VLA-COSMOS 3 GHz Large Project: Continuum data and source catalog release, doi: 10.1051/0004-6361/201628704
-
[67]
Storey-Fisher, K., Hogg, D. W., Rix, H.-W., et al. 2023, Quaia, the Gaia-unWISE Quasar Catalog: An All-Sky Spectroscopic Quasar Sample, doi: 10.3847/1538-4357/ad1328
-
[68]
2025, Monthly Notices of the Royal Astronomical Society, 538, 395, doi: 10.1093/mnras/staf304
Sui, J., Zou, H., Yang, X., et al. 2025, Monthly Notices of the Royal Astronomical Society, 538, 395, doi: 10.1093/mnras/staf304
-
[69]
Weaver, J. R., Kauffmann, O. B., Ilbert, O., et al. 2021, COSMOS2020: A panchromatic view of the Universe to z∼10 from two complementary catalogs, doi: 10.3847/1538-4365/ac3078
-
[70]
Wen, R., Zheng, X. Z., Han, Y., et al. 2024, Monthly Notices of the Royal Astronomical Society, 528, 2770, doi: 10.1093/mnras/stae157
-
[71]
Wright, E. L., Eisenhardt, P. R. M., Mainzer, A., et al. 2010, The Wide-field Infrared Survey Explorer (WISE): Mission Description and Initial On-orbit Performance, doi: 10.1088/0004-6256/140/6/1868
work page internal anchor Pith review doi:10.1088/0004-6256/140/6/1868 2010
-
[72]
Xu, Y., Newberg, H. J., Carlin, J. L., et al. 2015, Rings and Radial Waves in the Disk of the Milky Way, doi: 10.1088/0004-637X/801/2/105
-
[73]
2026, Research in Astronomy and Astrophysics, 26, 024008, doi: 10.1088/1674-4527/ae2101 Yao, et al
Yan, Z.-J., Yin, J., Hao, L., et al. 2026, Research in Astronomy and Astrophysics, 26, 024008, doi: 10.1088/1674-4527/ae2101 Yao, et al. 2019, LAMOST QSO DR4-DR5,
-
[74]
2024, Machine Learning-based Search of High-redshift Quasars, https://arxiv.org/abs/2409.02167
Ye, G., Zhang, H., & Wu, Q. 2024, Machine Learning-based Search of High-redshift Quasars, https://arxiv.org/abs/2409.02167
-
[75]
2021, Research in Astronomy and Astrophysics, 21, 074, doi: 10.1088/1674-4527/21/3/074
Yuan, H.-B., Deng, D.-S., & Sun, Y. 2021, Research in Astronomy and Astrophysics, 21, 074, doi: 10.1088/1674-4527/21/3/074
-
[76]
Sigmoid Loss for Language Image Pre-Training
Zhai, X., Mustafa, B., Kolesnikov, A., & Beyer, L. 2023, Sigmoid Loss for Language Image Pre-Training, https://arxiv.org/abs/2303.15343
work page internal anchor Pith review Pith/arXiv arXiv 2023
-
[77]
2011, Scientia Sinica Physica, Mechanica & Astronomica, 41, 1441, doi: 10.1360/132011-961
Zhan, H. 2011, Scientia Sinica Physica, Mechanica & Astronomica, 41, 1441, doi: 10.1360/132011-961
-
[78]
2021, Chinese Science Bulletin, 66, 1290, doi: 10.1360/TB-2021-0016
Zhan, H. 2021, Chinese Science Bulletin, 66, 1290, doi: 10.1360/TB-2021-0016
-
[79]
2023, PhotoniX, 4, 16, doi: 10.1186/s43074-023-00094-4
Zhang, Y., Jiang, H., Shectman, S., et al. 2023, PhotoniX, 4, 16, doi: 10.1186/s43074-023-00094-4
-
[80]
Zhao, C., Huang, S., He, M., et al. 2024, MUltiplexed Survey Telescope (MUST) Science White Paper I: Overview of Large-Scale Structure Cosmology in the Era of Stage-V Spectroscopic Surveys, https://arxiv.org/abs/2411.07970
work page internal anchor Pith review Pith/arXiv arXiv 2024
-
[81]
2026, Research in Astronomy and Astrophysics, 26, 055020, doi: 10.1088/1674-4527/ae4a05
Zheng, Z.-Y., Xu, C., Liu, X., et al. 2026, Research in Astronomy and Astrophysics, 26, 055020, doi: 10.1088/1674-4527/ae4a05
discussion (0)
Sign in with ORCID, Apple, or X to comment. Anyone can read and Pith papers without signing in.