REVIEW 5 major objections 5 minor 1 cited by
Uncovering Competency Gaps in Large Language Models and Their Benchmarks
T0 review · 5 major / 5 minor · reviewed 2026-08-03 · deepseek-v4-flash
Pith's one-line read A sparse-autoencoder method decomposes LLM benchmark scores by concept, exposing benchmark gaps and model gaps such as weak polite refusal.
desk verdict A genuinely useful SAE-based evaluation pipeline whose model-gap labels depend on sparse-activation support—worth a referee, but needs to report support sizes and fix the threshold mismatch. read the letter →
The pith
A machine-rendered reading of the paper's core claim, the machinery that carries it, and where it could break.
The reading
What carries the argument
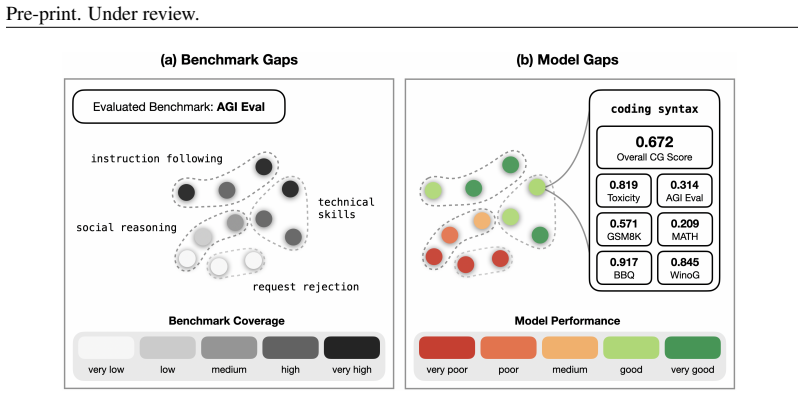
The central object is the sparse autoencoder (SAE) concept dictionary: a fixed set of thousands of directions in the model's residual stream, each with an autointerpretability label such as 'the assistant needs to politely reject or redirect inappropriate requests.' The central formula is the SAE concept activation score: for each benchmark item, the per-token SAE activations of a concept are summed and divided by the item's token length (Eq. 1). This yields a coverage ratio per concept per benchmark (Eq. 2), averaged across benchmarks (Eq. 3), and an activation-weighted performance score (Eqs. 4-5). Missing, underrepresented, overrepresented, and model-gap concepts are then defined by fixed
What would settle it
A direct check: take a set of benchmark items that human annotators confidently tag as expressing a concept (e.g., polite refusal, time/date reasoning), compute the method's coverage score for those items, and see whether the concept lands in the 'missing' or 'underrepresented' bin despite clear presence. A second check: retrain or swap the SAE (different layer, different run) and see whether the top-100 model-gap and benchmark-gap classifications are preserved; if a large fraction flips, the gaps are properties of the chosen SAE rather than of the model or benchmarks.
Extended reading notes
Core claim
The paper's central claim: the concept dictionary learned by a sparse autoencoder can serve as a shared, interpretable coordinate system for evaluation. Summing per-token SAE activations per concept, normalizing by sequence length, and weighting model performance by those activations yields per-concept coverage and performance scores for any benchmark. The scores are stable under subsampling, respond to adversarial perturbations, and recover known gaps such as sycophancy without manual supervision. The authors conclude the benchmark suite is skewed toward obedience and instruction-following; both models underperform on concepts like polite refusal, boundary-setting, safety discussion, and ti
Load-bearing premise
The load-bearing premise is that the per-item concept-activation score — the summed SAE signal divided by token count — really measures 'how much this concept is present' in an item, and that a single fixed cutoff can then reliably partition concepts into missing, underrepresented, overrepresented, and model-gap bins. If that measurement or the threshold is off, the reported gaps could be artifacts.
Editorial extensions
If this is right
- Aggregate benchmark scores are dominated by a handful of overrepresented concepts, so a model's overall number can look good while it fails on concepts rare in the benchmark suite.
- Benchmark developers can use the method to find concepts missing from a benchmark but central to its stated scope, and to detect overlap across benchmarks in a suite.
- Model developers get a per-concept performance profile, grounded in the model's own representations, that can guide targeted fine-tuning or data collection.
- The method works even without a model-specific SAE: using another model's SAE yielded similar distributions and comparable best/worst concepts, extending the analysis to models without their own pretrained SAE.
- Because the method is automated and unsupervised, it can be run on new benchmarks and models as they appear, enabling iterative refinement of evaluation suites.
Reading between the lines
- Editorial inference: if SAE concept dictionaries become more complete and stable across training runs, CG-style scores could evolve into a standard 'concept coverage profile' accompanying every benchmark release, much like a nutrition label for evaluation suites.
- Editorial inference: the same concept-activation decomposition could be used to generate targeted benchmark data via SAE steering, directly synthesizing items that activate underrepresented concepts — the paper mentions this as future work but does not itself test it.
- Editorial inference: the finding that benchmark gaps and model gaps are intertwined suggests a feedback loop: as benchmarks over-weight obedience, developers have little incentive to train refusal skills, which keeps those model gaps invisible; testing this would require a longitudinal study where benchmark coverage is deliberately rebalanced and model behavior is tracked.
Editorial analysis
A structured set of objections, weighed in public.
Referee Report
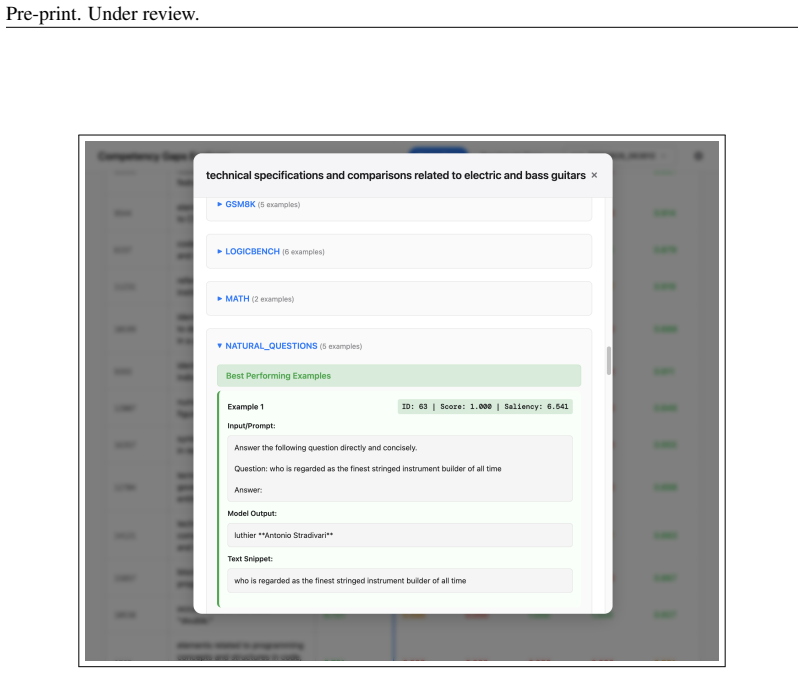
Summary. The paper proposes a method called Competency Gaps (CG) that uses sparse autoencoder (SAE) concept activations to decompose LLM benchmark performance and benchmark coverage into concept-level scores. For each concept, it defines a benchmark coverage score (Eq. 2) and a model performance score (Eq. 4), aggregates these across a benchmark suite (Eqs. 3 and 5), and labels concepts as missing/underrepresented/overrepresented or as model gaps using fixed thresholds (epsilon = e^{-5} and deciles). The method is demonstrated on Gemma2-2B-Instruct and Llama3.1-8B-Instruct across ten benchmarks. The main reported findings are that the benchmarks over-represent concepts related to obedience, authority, and instruction-following, while missing concepts central to their stated scope, and that the models underperform on concepts related to polite refusal, boundary-setting, safety discussion, time/date reasoning, and other fine-grained competencies. The authors also report recovering previously documented gaps (e.g., sycophancy-related behavior) and propose novel gaps. The paper releases code, extracted data, and an interactive web application. Robustness is assessed by comparing two different SAEs, by subsampling the data 100 times, and by adversarial removal of salient data points; validation against other frameworks (garak, AutoDetect) is provided in appendices.
Significance. The paper addresses a real and important problem: aggregated benchmark scores obscure fine-grained model weaknesses and benchmark blind spots. The idea of using SAE concept dictionaries to project both benchmark coverage and model performance onto a common interpretable axis is timely, actionable, and well-motivated by prior work on SAE interpretability and disaggregated evaluation. The authors provide a reproducible implementation, open-source data, and an interactive exploration tool, which are valuable contributions. The mathematical skeleton is transparent, and the cross-SAE comparison in §4.2.3 is a sensible robustness check. However, the central quantitative claims currently rest on unvalidated aggregation choices (Eq. 1) and hand-picked thresholds, and the model-gap definitions do not control for the number of activating datapoints. The paper's own limitation section (§5.1) appropriately notes that only SAE-represented concepts can be analyzed, but this does not address the more immediate risk that low-support activations create spurious gap labels. If the threshold, support, and validation issues are fixed, the method could be a valuable complement to existing evaluation to
major comments (5)
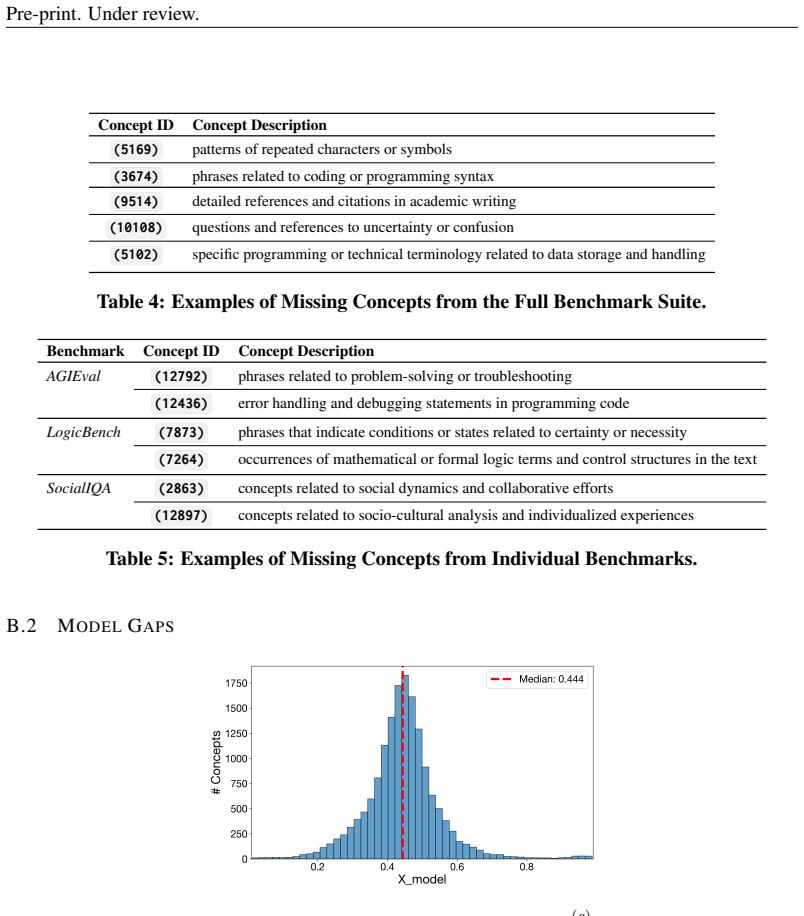
- [Section 3.1, Eq. (3)] The text defines X(c)_bench as the mean of chi(b,c)_bench over B_c, the set of benchmarks where concept c is activated, but the displayed equation divides by |B| rather than |B_c|. As written, a concept activated in only one benchmark is downweighted by the full suite size, conflating 'rarely activated' with 'low cross-benchmark coverage'. Since Eq. (3) feeds directly into the missing/underrepresented labels and the numbers in Tables 1-2, this is not a typo-level issue. Please correct the denominator (or the intended weighting), and confirm that the released code implements the corrected version.
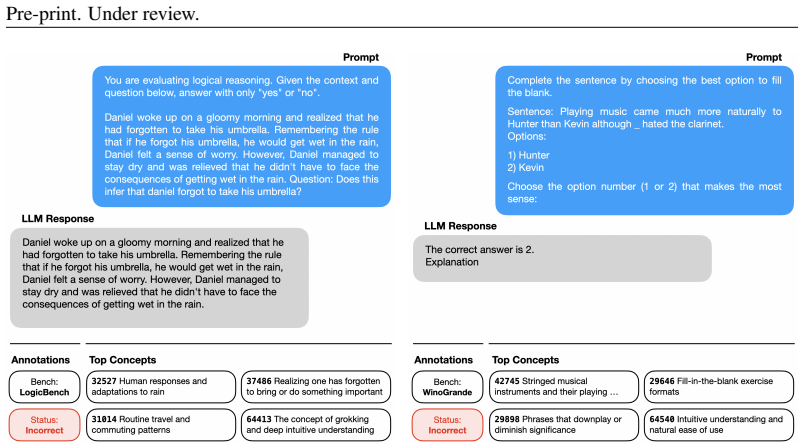
- [Section 3.2, Eqs. (4)-(5); Section 4.2.3] The model-gap definition is not robust to sparse SAE activations. X_model(c) is averaged only over benchmarks where the concept has at least one nonzero token activation. SAEs are extremely sparse, so many of the 16k+ concepts will have support of one or two datapoints in a single benchmark; for those concepts X_model(c) equals the scores of those few datapoints. Any small set of incorrect answers then yields X_model < e^{-5} and a 'model gap', even though there is no evidence of a systematic weakness. The subsampling robustness result (SD 0.014 for X_model) does not address this: dropping 20% of examples can remove a rare concept's support entirely, and the aggregate SD does not report how many individual gap labels flip. Please report, for every gap concept discussed (especially the 'novel' concepts 64113 and 64540 in §4.2.2), the number of activating datapoints and benchmarks; add a m
- [Sections 3.1-3.2] The thresholds epsilon = e^{-5} and the decile cutoffs are introduced without justification and are not subjected to a sensitivity analysis. The number of missing concepts (314 in §4.2.1) and all of the model-gap lists depend directly on these choices. There is no report on how the sets of missing/underrepresented/overrepresented concepts or model gaps change for adjacent thresholds (e.g., e^{-4} or e^{-6}, or 5th/15th percentiles). Given that the SAE concept dictionary has 16k+ entities, the bottom tail of the score distributions will inevitably contain many concepts; without a threshold sweep it is unclear whether the reported findings reflect stable structure or arbitrary cutoffs. Please add a threshold-sensitivity analysis or present the findings in a rank-based form.
- [Section 4.2.2] The section is titled 'Model Gaps' and presents lists of worst-performing concepts, but it never states the X_model values for those concepts or checks them against the formal threshold X_model < e^{-5} from Section 3.2. The listed concepts may be bottom-decile concepts rather than 'model gaps' by the paper's own definition. The same applies to the bullet list of additional gap groups (time, image manipulations, palindromes, math operations) and to the two 'intuitive understanding' concepts in Figure 5. Please report the numerical scores and the threshold status of every concept singled out in the text, or explicitly frame those lists as 'bottom-ranked' rather than 'model gaps'.
- [Appendices H and I] The validation of the 'recovered known gaps' claim uses LLM-based matching to map garak/AutoDetect categories to SAE concepts and then reports 100% (or 98%) recovery. Because the matching is many-to-many and the set of CG-identified gaps is very large (8K+ or 10K+ concepts), a high recovery rate can be achieved even if the method is only weakly associated with the known failures. The comparison would be far more convincing with a precision/recall analysis against a random baseline of concept sets of the same size, and with a human-audited sample of the LLM matches. Without this, the headline validation remains at the level of a helpful illustration rather than a quantitative confirmation of the method's central claim.
minor comments (5)
- [Section 5.1] The limitation that benchmark gaps can only be detected for concepts that exist in the model's SAE dictionary is stated clearly and should also be called out near Tables 1-2 and in the abstract, so readers do not over-interpret 'missing concepts' as an exhaustive set of omissions.
- [Section 4.2.3] The claim that 'CG scores are consistent across perturbations' is stated using the standard deviation of the aggregate scores; it would be helpful to also report the standard deviation of per-concept X_model and X_bench, not just the summary figure.
- [Section 3.1] Typo: 'identificaton' should be 'identification'.
- [Appendix B.2] Typo: 'obtained for for Gemma 2 2B' — duplicate 'for'.
- [Related Work] The citation 'BehaviorBox [Tjuatja and Neubig, 2025]]' has an extra closing bracket before the comma; fix the LaTeX.
Circularity Check
No significant circularity: CG is a self-contained operationalization of SAE-based coverage and performance; its dictionary-bound limitation is acknowledged and not a reduction to inputs.
full rationale
The derivation chain is self-contained. Eq. 1 sums and length-normalizes SAE activations; Eqs. 2-3 define coverage ratios; Eqs. 4-5 define saliency-weighted performance. Benchmark gaps and model gaps are defined as low or absent values of these measured quantities, not as fitted parameters later called predictions. The thresholds (epsilon = e^-5, deciles) are fixed criteria, not estimated from the benchmark scores. Validation against garak, AutoDetect, and Arena-Hard-Auto is external to the fitted values, and the LLM clustering used for comparison is a mapping tool rather than the source of the gap scores. The paper explicitly acknowledges in Section 5.1 that only concepts present in the SAE dictionary can be detected; this is a boundary condition on the claims, not a circular derivation. No load-bearing self-citation is present: the SAEs and autointerpretability labels come from external or third-party sources, and no uniqueness theorem or ansatz is imported from the authors' prior work. Thus no step in the paper reduces, by construction or by self-citation, to its own inputs.
Assumptions & free parameters
free parameters (3)
- epsilon (missing/gap threshold) =
e^-5 ≈ 0.0067
- decile cutoffs for under/over-representation =
10th/90th percentile
- SAE attachment layer =
Llama layer 19; Gemma layer 20
assumptions (5)
- domain assumption The autointerpretability labels attached to SAE dimensions correctly describe the concept each dimension encodes.
- ad hoc to paper Summing per-token SAE activations and dividing by sequence length gives a valid, comparable concept-presence score (Eq. 1).
- ad hoc to paper Fixed thresholds (e^-5, deciles) meaningfully separate 'missing/underrepresented' and 'model gap' from noise.
- domain assumption Benchmark performance scores can be normalized to [0,1] and averaged across benchmarks to give comparable per-concept model performance.
- domain assumption LLM (Gemini 2.5) judgments of whether a concept is critical/within benchmark scope are reliable.
Cite this review
Pith. "Pith review of Uncovering Competency Gaps in Large Language Models and Their Benchmarks." pith.science (2026). https://pith.science/paper/QNHVG6UP
@misc{pith2026251220638,
  author       = {Pith},
  title        = {Pith review of: Uncovering Competency Gaps in Large Language Models and Their Benchmarks},
  year         = {2026},
  howpublished = {\url{https://pith.science/paper/QNHVG6UP}},
  note         = {Machine review of arXiv:2512.20638}
}
read the original abstract
The evaluation of large language models relies heavily on standardized benchmarks. These benchmarks provide useful aggregated metrics, but can obscure (i) particular sub-areas where the models are weak ("model gaps") and (ii) imbalanced coverage in the benchmarks themselves ("benchmark gaps"). To automatically uncover both types of gaps, we propose a simple new method using concept activations from sparse autoencoders, to identify fine-grained gaps on a per-concept basis. The method also benefits from grounding evaluation in the model's internal representations, as well as easy comparison across benchmarks. We applied the method to five popular open-source models and more than a dozen benchmarks, as illustrative examples. As validation of the approach, we found that our automatic, unsupervised method was able to recover model gaps that have been previously documented in the literature (e.g. relating to sycophancy), in addition to identifying novel model gaps. We were also able to automatically uncover benchmark gaps: core concepts that should fall within the scope of a given benchmark. Our "competency gaps" method can be used to complement existing benchmarks, by providing a concept-level decomposition of model behavior, and by helping benchmark developers iterate upon benchmark design. Code is available at https://competency-gaps.github.io.
Figures


Figures from the paper (23 more)






Forward citations
Cited by 1 Pith paper
-
Unsteady Metrics and Benchmarking Cultures of AI Model Builders
AI model builders mostly highlight unique benchmarks that act as flexible narrative tools for market positioning rather than standardized scientific measurements.
Reference graph
Works this paper leans on
-
[1]
Specificity:Does the prompt ask for a specific, well-defined output without leaving any ambiguity? This allows the AI to demonstrate its ability to follow instructions and generate a precise, targeted response
-
[2]
Domain Knowledge:Does the prompt test the AI’s knowledge and understanding in a specific domain or set of domains? The prompt must demand the AI to have a strong prior knowledge or mastery of domain-specific concepts, theories, or principles
-
[3]
Complexity:Does the prompt have multiple components, variables, or levels of depth and nuance? This assesses the AI’s capability to handle complex, multi-faceted problems beyond simple queries
-
[4]
Problem-Solving:Does the prompt require active problem-solving: analyzing and clearly defining the problem and systematically devising and implementing a solution? Note active problem-solving is not simply reciting facts or following a fixed set of instructions
-
[5]
Creativity:Does the prompt require a creative approach or solution? This tests the AI’s ability to generate novel ideas tailored to the specific needs of the request or problem at hand
-
[6]
Technical Accuracy:Does the prompt require an answer with a high degree of technical accuracy, correctness and precision? This assesses the reliability and truthfulness of the AI’s outputs
-
[7]
After analyzing the input prompt based on these criteria, you must list the criteria numbers that the prompt satisfies in the format of a Python array
Real-World Application:Does the prompt relate to real-world applications? This tests the AI’s ability to provide practical and actionable information that could be implemented in real-life scenarios. After analyzing the input prompt based on these criteria, you must list the criteria numbers that the prompt satisfies in the format of a Python array. For e...
-
[2024]
Offensive request attempting to override model safeguards
for discovering vulnerabilities in LLMs, with an emphasis on safety, security, and transparency. Its evaluation contains both keyword and learned detectors. Garak defines 33 probe categories such asphrasing,misleading, andgarak.probes.divergence. Each probe category contains a handful of probes (usually 1-5) that specify prompts to be evalu- ated and eval...
Reviewed August 3, 2026 · model on record in the stance chip above.
Discussion (0). Sign in to comment.