REVIEW 3 major objections 3 minor 8 cited by
ACE2: Accurately learning subseasonal to decadal atmospheric variability and forced responses
T0 review · 3 major / 3 minor · reviewed 2026-08-12 · deepseek-v4-flash
Pith's one-line read ACE2, a 450-million-parameter learned atmospheric model, can be stepped forward stably for arbitrarily many steps and reproduces atmospheric variability from days to decades, including the response to El Niño and 80-year temperature trends.
desk verdict A serious step forward for learned climate emulators, but the forced-response claim is only established for combined historical forcing, not separable SST and CO2 responses. read the letter →
The pith
A machine-rendered reading of the paper's core claim, the machinery that carries it, and where it could break.
The reading
What carries the argument
The central object is ACE2 itself: an autoregressive Spherical Fourier Neural Operator that maps a 6-hourly atmospheric state plus forcing variables (SST, CO2, solar radiation, surface fractions) to the next state, with a physical-corrector module appended as part of the architecture. The corrector enforces exact global dry-air-mass conservation and a closed global moisture budget by adjusting surface pressure and precipitation and deriving the advective moisture tendency as a residual. The other load-bearing mechanisms are the use of CO2 as an input feature, training on two 80-year datasets with historical SST variability, and a checkpoint-selection criterion based on time-mean climate skill rather than short-term loss. Together these let ACE2 roll out for centuries under changing boundary conditions instead of drifting to a fixed climatology.
What would settle it
The decisive test is to generate paired SHiELD simulations with historical SST plus fixed CO2 and fixed SST plus historical CO2, then run ACE2 with the same factorial forcings; if ACE2's separated responses do not match the physics model's, the forced-response claim holds only for the combined historical forcing. The paper's Figure 14 already hints at this, since fixing CO2 removes most near-surface warming.
Extended reading notes
Core claim
ACE2's central claim is that a model trained only to predict two 6-hour steps ahead can be integrated autoregressively over 81 years and beyond without instability, while tracking the observed atmospheric response to changing boundary conditions. The paper reports that ACE2-ERA5 matches the global-annual mean 2-meter temperature of ERA5 with an $R^2$ of 0.93, that the ENSO-regressed precipitation map is as close to the reference as the reference's own internal variability, and that a 1000-year run under climatological forcing shows no drift in total water path. It generates tropical cyclones, the Madden-Julian Oscillation, and sudden stratospheric warmings as emergent behavior. The authors state the model 'can be stepped forward stably for arbitrarily many steps' and 'accurately reproduces the atmospheric response to El Niño variability and global trends of temperature over the past 80 years.' The same experiments show the separation of CO2 and SST forcing is incomplete: fixing CO2 at its 1940 value removes most near-surface warming and all stratospheric cooling, which is not physically expected.
Load-bearing premise
The load-bearing premise is that the 1940–2020 record, in which sea surface temperature and CO2 rise together, provides enough signal for the model to learn physically correct separate responses to each forcing, a premise the paper's fixed-CO2 test only partially confirms.
Editorial extensions
If this is right
- Century-scale simulations become cheap enough for large ensembles: ACE2 runs about 1,500 simulated years per wall-clock day on one GPU, so separating forced response from internal variability no longer requires thousands of node-hours.
- Because ACE2-ERA5 reproduces Madden-Julian Oscillation propagation, tropical cyclone statistics, and polar stratospheric vortex variability, it is a plausible fast platform for subseasonal-to-seasonal predictability studies.
- The 4-degree version retains most of the 1-degree model's climate skill at a fraction of the cost, which would make paleoclimate and biogeochemistry applications tractable with a learned emulator.
- The hard dry-air-mass and moisture constraints eliminate the long-term drift seen in the earlier ACE model; a 1000-year simulation forced by climatological 1990–2020 boundary conditions shows no drift in total water path.
- Weather forecast skill is a separate axis: ACE2-ERA5 sits behind the IFS and GraphCast in medium-range RMSE, so climate fidelity does not automatically buy forecast skill.
Reading between the lines
- Editorial extension: because SST and CO2 rise together in the 1940–2020 training record, the fixed-CO2 experiment suggests the two forcings are entangled in what the model learns; a factorial training set with historical SST at fixed CO2 and vice versa, which the authors note could be generated from SHiELD, is the natural test of whether separable sensitivities are learnable at all.
- Editorial extension: the model is differentiable and cheap, so it invites use in data assimilation or parameter-estimation loops, where many forward integrations are needed.
- Editorial extension: the same architecture and conservation constraints could extend to ocean or coupled emulation, since ACE2 itself is atmosphere-only with prescribed SST and sea ice.
Signed reviews
Editorial analysis
A structured set of objections, weighed in public.
Referee Report
Summary. The paper presents ACE2, a 450M-parameter autoregressive machine learning emulator run at 1-degree resolution and 6-hour steps, trained on either ERA5 or an AMIP-style GFDL SHiELD simulation. It reports stable multi-decadal and millennial rollouts, exact dry-air mass and moisture conservation, realistic ENSO regression patterns, tropical cyclone statistics, MJO propagation, polar stratospheric variability, medium-range weather skill, and roughly 1500 simulated years per wall-clock day. The central claim is that ACE2 accurately captures subseasonal-to-decadal atmospheric variability and forced responses over 1940-2020, while the authors acknowledge that separately varying SST and CO2 produces non-realistic sensitivities.
Significance. If the main claims hold, this is a substantial advance for learned climate emulators: it demonstrates stable long autoregressive simulations under historically varying SST and CO2 forcing, with emergent phenomena such as TCs, MJO, and SSWs, and with enforceable conservation properties. The paper is unusually strong on reproducibility: training targets, code, and trained checkpoints are public, and the 10-year held-out test period, the 1000-year stability check, and the ENSO regression comparisons against reference internal variability provide concrete evidence. The main caveat is that the forced-response claim is broader than what the current evidence supports, because the model's separate SST and CO2 sensitivities are shown in Section 2.4 to be physically questionable.
major comments (3)
- [§2.2.1] The fixed-CO2 experiment directly tests the learned separate CO2 sensitivity, and it fails: when CO2 is held at 307 ppm while SST rises, ACE2-SHiELD loses most of the near-surface warming, including high-latitude land amplification that the paper itself (citing Screen et al., 2012) expects to be driven mainly by SST and sea-ice forcing. Because SST and CO2 rise together over 1940-2020, the training data cannot identify which forcing produced the learned trend, so the model's separate sensitivities are not physically grounded. This is load-bearing for the title/abstract claim of "forced responses": the paper establishes an accurate response to the combined historical SST+CO2 forcing, but not an accurate response to the individual forcing agents, which is what scenario interpolation would require. The Discussion in Section 3 acknowledges the limitation, but the framing should be revised, and/or the suggested SHiELD runs with historical SST/fixed CO2 and vice versa should be performed to test whether training-data augmentation fixes the attribution.
- [§2.1] The 81-year trend evaluation overlaps substantially with the training data (1940-1995 and 2011-2019) and with the validation/checkpoint-selection period (1996-2000; see Section 4.3). Although ACE2 is trained only on 6-hour transitions, the long-trend R2 values in Figure 1 reflect this overlap and therefore do not by themselves prove out-of-sample generalization of the 80-year trend. The held-out 2001-2010 test period supports the 10-year climate-skill and ENSO-response claims, but it is too short to validate the "past 80 years" trend claim. Please either report trend skill on a fully held-out period (for example, 2001-2010 only) or explicitly restate the trend claim as an in-sample/emergent property of the 6-hourly training objective.
- [§4.3] The final model is selected by climate skill over twelve 5-year inference runs spanning 1940-2000, with the q0 channel downweighted by a factor of 10, rather than by held-out test skill. This introduces a mild selection bias into the long-run skill statistics in Figures 1 and 13. The 10-year test period and Figure 20 mitigate the concern, but the paper should quantify how much of the reported 81-year skill is robust across the four training seeds and whether the q0 downweighting changes the qualitative conclusions.
minor comments (3)
- [Abstract and §2.4/§3] The phrase "forced responses" should be qualified as "responses to combined historical SST and CO2 forcing" unless the separate-forcing experiments are added, because the paper itself reports non-realistic separate SST and CO2 sensitivities.
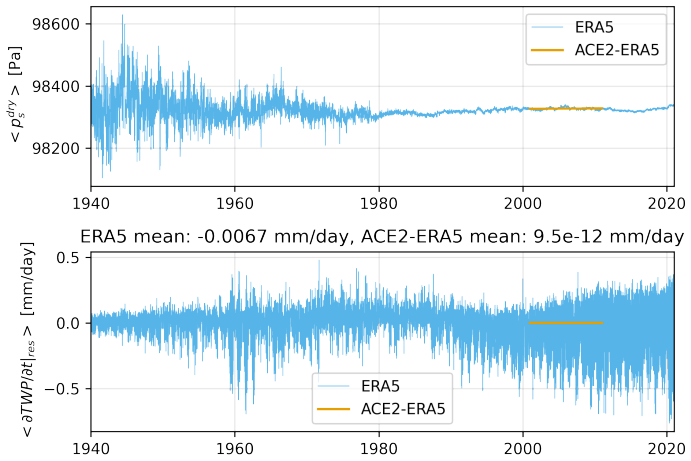
- [§4.3 (Eq. 6)] The moisture-correction formula appears mis-typed: it should read ⟨E(t) − (TWP(t) − TWP(t−1))/Δt⟩ rather than ⟨E(t) − TWP(t) − TWP(t−1)/Δt⟩.
- [Typos] There are several typos: "that ERA5" (Section 2.2.3), "of of" and "variabilty" (Section 2.2.4), and "simmilar" (Appendix A.5).
Circularity Check
No significant circularity: held-out test-period evaluations carry the central claims, and the paper explicitly concedes imperfect separated SST/CO2 sensitivities.
full rationale
ACE2's central claims—81-year global-mean temperature and water-path trends, ENSO-regressed precipitation, MJO, tropical cyclone, and sudden stratospheric warming emergence, 1000-year stability, and exact mass and moisture conservation—do not reduce by construction to the model's fitted inputs or outputs. The model is trained only to predict two 6-hourly steps ahead, and the multi-decadal rollouts are generated autoregressively; no equation in the paper defines the predicted long-term trend as the training target, and the held-out test period (2001-2010, plus 2020) is used for the climate-skill RMSEs and ENSO regression maps, providing independent evidence for the central skill claims. The 81-year trend plots in Figure 1 overlap training and validation data, and the checkpoint-selection metric (Eq. 8) is evaluated over 1940-2000, so the reported 81-year R2 values are mildly in-sample with respect to model selection; this is an evaluation caveat, not a by-construction equivalence. The paper itself flags the most significant limitation: Section 2.4 and Figure 14 show that with CO2 held fixed at 1940 levels, ACE2-SHiELD 'loses much of the trend of near-surface warming, which is not expected,' and the abstract states that 'its sensitivities to separately changing sea surface temperature and carbon dioxide are not entirely realistic.' Thus the separated-forcing claim is explicitly qualified rather than concealed. Self-citations to prior ACE work serve as architecture and baseline references and do not carry a load-bearing uniqueness argument or smuggle in an unverified ansatz. No 'prediction' is a renamed fitted parameter, and no derived quantity equals its input by definition.
Assumptions & free parameters
free parameters (4)
- SFNO model parameters (approximately 450M) =
learned from training data
- Loss weights for output variables (Table 2) =
0.25 to 10 depending on variable
- Checkpoint-selection weighting on q0 =
0.1 (downweighted by factor of 10)
- Training hyperparameters (embed_dim 384, 8 layers, learning rate 1e-4, etc.) =
see Tables 6 and 7
assumptions (5)
- domain assumption ERA5 and the SHiELD AMIP simulation are adequate references for atmospheric variability and forced response over 1940-2020.
- domain assumption Six-hourly autoregressive training over two time steps is sufficient for the model to learn stable multi-decadal behavior.
- ad hoc to paper The historical co-variation of SST and CO2 does not prevent the model from learning physically correct separate sensitivities.
- domain assumption The physical corrector for mass and moisture can be applied before computing the loss without introducing model bias.
- standard math Hydrostatic balance justifies replacing the tropical cyclone warm-core thickness criterion with an upper-tropospheric temperature criterion.
Cite this review
Pith. "Pith review of ACE2: Accurately learning subseasonal to decadal atmospheric variability and forced responses." pith.science (2026). https://pith.science/paper/WPOGER2V
@misc{pith2026241111268,
  author       = {Pith},
  title        = {Pith review of: ACE2: Accurately learning subseasonal to decadal atmospheric variability and forced responses},
  year         = {2026},
  howpublished = {\url{https://pith.science/paper/WPOGER2V}},
  note         = {Machine review of arXiv:2411.11268}
}
read the original abstract
Existing machine learning models of weather variability are not formulated to enable assessment of their response to varying external boundary conditions such as sea surface temperature and greenhouse gases. Here we present ACE2 (Ai2 Climate Emulator version 2) and its application to reproducing atmospheric variability over the past 80 years on timescales from days to decades. ACE2 is a 450M-parameter autoregressive machine learning emulator, operating with 6-hour temporal resolution, 1{\deg} horizontal resolution and eight vertical layers. It exactly conserves global dry air mass and moisture and can be stepped forward stably for arbitrarily many steps with a throughput of about 1500 simulated years per wall clock day. ACE2 generates emergent phenomena such as tropical cyclones, the Madden Julian Oscillation, and sudden stratospheric warmings. Furthermore, it accurately reproduces the atmospheric response to El Ni\~no variability and global trends of temperature over the past 80 years. However, its sensitivities to separately changing sea surface temperature and carbon dioxide are not entirely realistic.
Figures


Figures from the paper (20 more)


Forward citations
Cited by 8 Pith papers
-
ACE2-SOM: Coupling an ML atmospheric emulator to a slab ocean and learning the sensitivity of climate to changed CO$_2$
ACE2-SOM, an ML atmospheric emulator with a slab ocean, accurately emulates equilibrium climate sensitivity to CO2 doubling, tripling, and quadrupling, but mishandles non-equilibrium transitions.
-
Physics constraints and response validation in discrete-time reduced-order modeling: from idealized turbulent systems to climate dynamics
A framework builds stable neural models of turbulent dynamics by enforcing energy-preserving nonlinearities and causal constraints in discrete-time flow maps, demonstrated on Charney-DeVore and Lorenz-96 systems.
-
ArchesClimate: Probabilistic Decadal Ensemble Generation With Flow Matching
ArchesClimate autoregressively generates 10-year monthly climate states with a flow-matching emulator trained on IPSL-CM6A-LR decadal hindcasts, producing ensembles that match the climate model for some variables.
-
Finetuning a Weather Foundation Model with Lightweight Decoders for Unseen Physical Processes
A frozen weather foundation model's latent space can be decoded by a small MLP to predict unseen hydrological variables, with accuracy and efficiency strongly favoring this lightweight approach over full fine-tuning.
-
PEAR: Equal Area Weather Forecasting on the Sphere
A transformer weather model operating natively on the equal-area HEALPix grid beats an equiangular-grid counterpart at longer lead times with 2.6x fewer parameters.
-
Applying the ACE2 Emulator to SST Green's Functions for the E3SMv3 Global Atmosphere Model
An ML emulator trained on one climate model reproduces that model's SST Green's function patterns qualitatively, with significant regional biases and about a 100x wall-clock speedup.
-
Simultaneous emulation and downscaling with physically-consistent deep learning-based regional ocean emulators
A two-stage deep learning framework autoregressively emulates Gulf of Mexico ocean surface fields at 8 km and downscales them to 4 km with stable 10-year climatology.
-
What You See is Not What You Get: Neural Partial Differential Equations and The Illusion of Learning
NeuralPDEs trained on finite-difference simulation data inherit the discretization's Taylor-series truncation error, so generalization depends on matching numerical schemes between the solver and the model.
Reference graph
Works this paper leans on
-
[1]
Min‐Seop Ahn, Daehyun Kim, Daehyun Kang, Jiwoo Lee, Kenneth R. Sperber, et al. MJO Propagation Across the Maritime Continent: Are CMIP6 Models Better Than CMIP5 Models? Geophysical Research Letters, 47(11), 2020. doi:10.1029/2020gl087250
-
[2]
James A. Anstey, Scott M. Osprey, Joan Alexander, Mark P. Baldwin, Neal Butchart, et al. Impacts, processes and projections of the quasi-biennial oscillation. Nature Reviews Earth Environment, 3(9):588–603, 2022. doi:10.1038/s43017-022-00323-7
-
[3]
Mark P. Baldwin and Timothy J. Dunkerton. Stratospheric Harbingers of Anomalous Weather Regimes. Science, 294(5542):581–584, 2001. doi:10.1126/science.1063315
-
[4]
Climate-invariant machine learning
Tom Beucler, Pierre Gentine, Janni Yuval, Ankitesh Gupta, Liran Peng, et al. Climate-invariant machine learning. Science Advances, 10(6):eadj7250, 2024. doi:10.1126/sciadv.adj7250
-
[5]
Kieran T. Bhatia, Gabriel A. Vecchi, Thomas R. Knutson, Hiroyuki Murakami, James Kossin, et al. Recent increases in tropical cyclone intensification rates. Nature Communications, 10(1), 2019. doi:10.1038/s41467-019-08471-z
-
[7]
Accurate medium-range global weather forecasting with 3D neural networks
Kaifeng Bi, Lingxi Xie, Hengheng Zhang, Xin Chen, Xiaotao Gu, et al. Accurate medium-range global weather forecasting with 3D neural networks. Nature, 619(7970):533–538, 2023 b . doi:10.1038/s41586-023-06185-3
-
[8]
Spherical Fourier Neural Operators: Learning Stable Dynamics on the Sphere
Boris Bonev, Thorsten Kurth, Christian Hundt, Jaideep Pathak, Maximilian Baust, et al. Spherical Fourier Neural Operators: Learning Stable Dynamics on the Sphere. Proceedings of the 40th International Conference on Machine Learning (ICML), 2023. doi:10.48550/ARXIV.2306.03838
-
[9]
Julien Brajard, Alberto Carrassi, Marc Bocquet, and Laurent Bertino. Combining data assimilation and machine learning to emulate a dynamical model from sparse and noisy observations: A case study with the Lorenz 96 model. Journal of Computational Science, 44:101171, 2020. doi:10.1016/j.jocs.2020.101171
arXiv 2020
Show all 68 references
-
[10]
Carver and Alex Merose
Robert W. Carver and Alex Merose. ARCO-ERA5: An Analysis-Ready Cloud-Optimized Reanalysis Dataset . 22nd Conf. on AI for Env. Science, Denver, CO, Amer. Meteo. Soc., 2023
2023
-
[11]
A machine learning model that outperforms conventional global subseasonal forecast models
Lei Chen, Xiaohui Zhong, Hao Li, Jie Wu, Bo Lu, et al. A machine learning model that outperforms conventional global subseasonal forecast models. Nature Communications, 15(1), 2024. doi:10.1038/s41467-024-50714-1
2024 doi
-
[12]
FuXi: a cascade machine learning forecasting system for 15-day global weather forecast
Lei Chen, Xiaohui Zhong, Feng Zhang, Yuan Cheng, Yinghui Xu, et al. FuXi: a cascade machine learning forecasting system for 15-day global weather forecast. npj Climate and Atmospheric Science, 6(1), 2023. doi:10.1038/s41612-023-00512-1
2023 doi
-
[13]
Merlis, Maximilien Bolot, et al
Kai-Yuan Cheng, Lucas Harris, Christopher Bretherton, Timothy M. Merlis, Maximilien Bolot, et al. Impact of Warmer Sea Surface Temperature on the Global Pattern of Intense Convection : Insights From a Global Storm Resolving Model . Geophysical Research Letters, 49(16):e2022GL0...
2022 doi
-
[14]
Clark, Noah D
Spencer K. Clark, Noah D. Brenowitz, Brian Henn, Anna Kwa, Jeremy McGibbon, et al. Correcting a 200 km Resolution Climate Model in Multiple Climates by Machine Learning From 25 km Resolution Simulations. Journal of Advances in Modeling Earth Systems, 14(9), 2022. doi:10.1029/2...
2022 doi
-
[15]
Claussen, L
M. Claussen, L. Mysak, A. Weaver, Crucifix M., T. Fichefet, et al. Earth system models of intermediate complexity: closing the gap in the spectrum of climate system models. Climate Dynamics, 18(7):579–586, 2002. doi:10.1007/s00382-001-0200-1
2002 doi
-
[16]
Description of the NCAR Community Atmosphere Model (CAM 3.0)
William Collins, Philip Rasch, Byron Boville, James McCaa, David Williamson, et al. Description of the NCAR Community Atmosphere Model (CAM 3.0) . Technical report, UCAR/NCAR , 2004. doi:10.5065/D63N21CH
2004 doi
-
[17]
Conway, Pieter P
Thomas J. Conway, Pieter P. Tans, Lee S. Waterman, Kirk W. Thoning, Duane R. Kitzis, et al. Evidence for Interannual Variability of the Carbon Cycle from the National Oceanic and Atmospheric Administration / Climate Monitoring and Diagnostics Laboratory Global Air Sampling Net...
1994 doi
-
[18]
Espinosa, et al
Nathaniel Cresswell-Clay, Bowen Liu, Dale Durran, Andy Liu, Zachary I. Espinosa, et al. A Deep Learning Earth System Model for Stable and Efficient Simulation of the Current Climate. 2024. doi:10.48550/ARXIV.2409.16247
2024 doi
-
[19]
Uncertainty in Climate Change Projections: The Role of Internal Variability
Clara Deser, Adam Phillips, Vincent Bourdette, and Haiyan Teng. Uncertainty in Climate Change Projections: The Role of Internal Variability. Climate Dynamics, 38(3):527--546, 2012. doi:10.1007/s00382-010-0977-x
2012 doi
-
[20]
James P. C. Duncan, Elynn Wu, Jean‐Christophe Golaz, Peter M. Caldwell, Oliver Watt‐Meyer, et al. Application of the AI2 Climate Emulator to E3SMv2’s Global Atmosphere Model, With a Focus on Precipitation Fidelity. Journal of Geophysical Research: Machine Learning and Computat...
2024 doi
-
[21]
Durack, Karl E
Paul J. Durack, Karl E. Taylor, Stephen Po-Chedley , and Charles Doutriaux. amipbcs - AMIP Dataset Prepared for input4MIPS . 2022
2022
-
[22]
Elsner, James P
James B. Elsner, James P. Kossin, and Thomas H. Jagger. The increasing intensity of the strongest tropical cyclones. Nature, 455(7209):92–95, 2008. doi:10.1038/nature07234
2008 doi
-
[23]
Meehl, Catherine A
Veronika Eyring, Sandrine Bony, Gerald A. Meehl, Catherine A. Senior, Bjorn Stevens, et al. Overview of the Coupled Model Intercomparison Project Phase 6 (CMIP6) experimental design and organization. Geoscientific Model Development, 9(5):1937–1958, 2016. doi:10.5194/gmd-9-1937-2016
1937 doi
-
[24]
Van Roekel, Xue Zheng, Andrew F
Jean‐Christophe Golaz, Luke P. Van Roekel, Xue Zheng, Andrew F. Roberts, Jonathan D. Wolfe, et al. The DOE E3SM Model Version 2: Overview of the Physical Model and Initial Model Evaluation. Journal of Advances in Modeling Earth Systems, 14(12), 2022. doi:10.1029/2022ms003156
2022 doi
-
[25]
LUCIE: A Lightweight Uncoupled ClImate Emulator with long-term stability and physical consistency for O(1000)-member ensembles
Haiwen Guan, Troy Arcomano, Ashesh Chattopadhyay, and Romit Maulik. LUCIE: A Lightweight Uncoupled ClImate Emulator with long-term stability and physical consistency for O(1000)-member ensembles. 2024. doi:10.48550/ARXIV.2405.16297
-
[26]
Ruby Leung, and Jimy Dudhia
Samson Hagos, L. Ruby Leung, and Jimy Dudhia. Thermodynamics of the Madden–Julian Oscillation in a Regional Model with Constrained Moisture. Journal of the Atmospheric Sciences, 68(9):1974–1989, 2011. doi:10.1175/2011jas3592.1
1974 doi
-
[27]
GFDL SHiELD: A Unified System for Weather‐to‐Seasonal Prediction
Lucas Harris, Linjiong Zhou, Shian‐Jiann Lin, Jan‐Huey Chen, Xi Chen, et al. GFDL SHiELD: A Unified System for Weather‐to‐Seasonal Prediction. Journal of Advances in Modeling Earth Systems, 12(10), 2020. doi:10.1029/2020ms002223
2020 doi
-
[28]
Building Tangent‐Linear and Adjoint Models for Data Assimilation With Neural Networks
Sam Hatfield, Matthew Chantry, Peter Dueben, Philippe Lopez, Alan Geer, et al. Building Tangent‐Linear and Adjoint Models for Data Assimilation With Neural Networks. Journal of Advances in Modeling Earth Systems, 13(9), 2021. doi:10.1029/2021ms002521
2021 doi
-
[29]
The ERA5 global reanalysis
Hans Hersbach, Bill Bell, Paul Berrisford, Shoji Hirahara, András Horányi, et al. The ERA5 global reanalysis. Quarterly Journal of the Royal Meteorological Society, 146(730):1999–2049, 2020. doi:10.1002/qj.3803
1999 doi
-
[30]
How Well Are Tropical Cyclones Represented in Reanalysis Datasets? Journal of Climate, 30(14):5243–5264, 2017
Kevin Hodges, Alison Cobb, and Pier Luigi Vidale. How Well Are Tropical Cyclones Represented in Reanalysis Datasets? Journal of Climate, 30(14):5243–5264, 2017. doi:10.1175/jcli-d-16-0557.1
2017 doi
-
[31]
Durran, Raul A
Matthias Karlbauer, Nathaniel Cresswell‐Clay, Dale R. Durran, Raul A. Moreno, Thorsten Kurth, et al. Advancing Parsimonious Deep Learning Weather Prediction Using the HEALPix Mesh. Journal of Advances in Modeling Earth Systems, 16(8), 2024. doi:10.1029/2023ms004021
2024 doi
-
[32]
J. E. Kay, C. Deser, A. Phillips, A. Mai, C. Hannay, et al. The Community Earth System Model (CESM) Large Ensemble Project: A Community Resource for Studying Climate Change in the Presence of Internal Climate Variability. Bulletin of the American Meteorological Society, 96(8):...
2015 doi
-
[33]
Kenneth, J
R. Kenneth, J. Howard, P. James, C. Michael, and J. Carl. International Best Track Archive for Climate Stewardship (IBTrACS) Project, Version 4. 2019. doi:10.25921/82TY-9E16
2019 doi
-
[34]
D. Kim, K. Sperber, W. Stern, D. Waliser, I.-S. Kang, et al. Application of MJO Simulation Diagnostics to Climate Models. Journal of Climate, 22(23):6413–6436, 2009. doi:10.1175/2009jcli3063.1
2009 doi
-
[35]
Knapp, Michael C
Kenneth R. Knapp, Michael C. Kruk, David H. Levinson, Howard J. Diamond, and Charles J. Neumann. The International Best Track Archive for Climate Stewardship (IBTrACS): Unifying Tropical Cyclone Data. Bulletin of the American Meteorological Society, 91(3):363–376, 2010. doi:10...
2010 doi
-
[36]
Smith, Ayya Alieva, Qing Wang, Michael P
Dmitrii Kochkov, Jamie A. Smith, Ayya Alieva, Qing Wang, Michael P. Brenner, et al. Machine learning–accelerated computational fluid dynamics. Proceedings of the National Academy of Sciences, 118(21):e2101784118, 2021. doi:10.1073/pnas.2101784118
2021 doi
-
[37]
Neural general circulation models for weather and climate
Dmitrii Kochkov, Janni Yuval, Ian Langmore, Peter Norgaard, Jamie Smith, et al. Neural general circulation models for weather and climate. Nature, 632(8027):1060–1066, 2024. doi:10.1038/s41586-024-07744-y
2024 doi
-
[38]
King, Riccardo Farneti, In-Sik Kang, et al
Fred Kucharski, Franco Molteni, Martin P. King, Riccardo Farneti, In-Sik Kang, et al. On the Need of Intermediate Complexity General Circulation Models: A SPEEDY Example. Bulletin of the American Meteorological Society, 94(1):25--30, 2013. doi:10.1175/bams-d-11-00238.1
2013 doi
-
[39]
Learning skillful medium-range global weather forecasting
Remi Lam, Alvaro Sanchez-Gonzalez, Matthew Willson, Peter Wirnsberger, Meire Fortunato, et al. Learning skillful medium-range global weather forecasting. Science, 382(6677):1416–1421, 2023. doi:10.1126/science.adi2336
2023 doi
-
[40]
Huge Ensembles Part I: Design of Ensemble Weather Forecasts using Spherical Fourier Neural Operators
Ankur Mahesh, William Collins, Boris Bonev, Noah Brenowitz, Yair Cohen, et al. Huge Ensembles Part I: Design of Ensemble Weather Forecasts using Spherical Fourier Neural Operators. 2024. doi:10.48550/ARXIV.2408.03100
-
[41]
Wetherald
Syukuro Manabe and Richard T. Wetherald. Thermal Equilibrium of the Atmosphere with a Given Distribution of Relative Humidity. Journal of the Atmospheric Sciences, 24(3):241–259, 1967. doi:10.1175/1520-0469(1967)024<0241:teotaw>2.0.co;2
1967 doi
-
[42]
Historical Greenhouse Gas Concentrations for Climate Modelling ( CMIP6 )
Malte Meinshausen, Elisabeth Vogel, Alexander Nauels, Katja Lorbacher, Nicolai Meinshausen, et al. Historical Greenhouse Gas Concentrations for Climate Modelling ( CMIP6 ). Geoscientific Model Development, 10(5):2057--2116, 2017. doi:10.5194/gmd-10-2057-2017
2017 doi
-
[43]
How large does a large ensemble need to be? Earth System Dynamics, 11(4):885–901, 2020
Sebastian Milinski, Nicola Maher, and Dirk Olonscheck. How large does a large ensemble need to be? Earth System Dynamics, 11(4):885–901, 2020. doi:10.5194/esd-11-885-2020
2020 doi
-
[44]
NOAA-GFDL / FRE-NCtools
NOAA-GFDL. NOAA-GFDL / FRE-NCtools . NOAA - Geophysical Fluid Dynamics Laboratory, 2024
2024
-
[45]
W. A. Perkins and G. J. Hakim. Coupled Atmosphere–Ocean Reconstruction of the Last Millennium Using Online Data Assimilation. Paleoceanography and Paleoclimatology, 36(5), 2021. doi:10.1029/2020pa003959
2021 doi
- [46]
-
[47]
James F. Price. Upper Ocean Response to a Hurricane. Journal of Physical Oceanography, 11(2):153–175, 1981. doi:10.1175/1520-0485(1981)011<0153:uortah>2.0.co;2
1981 doi
-
[48]
WeatherBench 2: A Benchmark for the Next Generation of Data‐Driven Global Weather Models
Stephan Rasp, Stephan Hoyer, Alexander Merose, Ian Langmore, Peter Battaglia, et al. WeatherBench 2: A Benchmark for the Next Generation of Data‐Driven Global Weather Models. Journal of Advances in Modeling Earth Systems, 16(6), 2024. doi:10.1029/2023ms004019
2024 doi
- [49]
-
[50]
Iain Russell and Sandor Kertész. Metview. 2017
2017
-
[51]
J. A. Screen, C. Deser, and I. Simmonds. Local and remote controls on observed Arctic warming. Geophysical Research Letters, 39(10), 2012. doi:https://doi.org/10.1029/2012GL051598
2012 doi
-
[52]
Stratospheric ozone depletion: A review of concepts and history
Susan Solomon. Stratospheric ozone depletion: A review of concepts and history. Reviews of Geophysics, 37(3):275–316, 1999. doi:10.1029/1999rg900008
1999 doi
-
[53]
Taylor, David Williamson, and Zwiers Francis
Karl E. Taylor, David Williamson, and Zwiers Francis. The Sea Surface Temperature and Sea-Ice Concentration Boundary Conditions for AMIP II Simulations . Technical report, Lawrence Livermore National Laboratory, 2000
2000
-
[54]
Trenberth
Kevin E. Trenberth. The Definition of El Niño. Bulletin of the American Meteorological Society, 78(12):2771–2777, 1997. doi:10.1175/1520-0477(1997)078<2771:tdoeno>2.0.co;2
1997 doi
-
[55]
Trenberth, John T
Kevin E. Trenberth, John T. Fasullo, and Jessica Mackaro. Atmospheric Moisture Transports from Ocean to Land and Global Energy Flows in Reanalyses. Journal of Climate, 24(18):4907–4924, 2011. doi:10.1175/2011jcli4171.1
2011 doi
-
[56]
Ullrich, Colin M
Paul A. Ullrich, Colin M. Zarzycki, Elizabeth E. McClenny, Marielle C. Pinheiro, Alyssa M. Stansfield, et al. TempestExtremes v2.1: a community framework for feature detection, tracking, and analysis in large datasets. Geoscientific Model Development, 14(8):5023–5048, 2021. do...
2021 doi
-
[57]
Evaluation of global horizontal irradiance estimates from ERA5 and COSMO-REA6 reanalyses using ground and satellite-based data
Ruben Urraca, Thomas Huld, Ana Gracia-Amillo, Francisco Javier Martinez-de Pison, Frank Kaspar, et al. Evaluation of global horizontal irradiance estimates from ERA5 and COSMO-REA6 reanalyses using ground and satellite-based data. Solar Energy, 164:339–354, 2018. doi:10.1016/j...
2018 doi
-
[58]
Vecchi, Christopher Landsea, Wei Zhang, Gabriele Villarini, and Thomas Knutson
Gabriel A. Vecchi, Christopher Landsea, Wei Zhang, Gabriele Villarini, and Thomas Knutson. Changes in Atlantic major hurricane frequency since the late-19th century. Nature Communications, 12(1), 2021. doi:10.1038/s41467-021-24268-5
2021 doi
-
[59]
Waliser et al
D. Waliser et al. MJO Simulation Diagnostics. Journal of Climate, 22(11):3006–3030, 2009. doi:10.1175/2008jcli2731.1
2009 doi
-
[60]
D. E. Waliser, K. Jin, I.-S. Kang, W. F. Stern, S. D. Schubert, et al. AGCM simulations of intraseasonal variability associated with the Asian summer monsoon. Climate Dynamics, 21(5–6):423–446, 2003. doi:10.1007/s00382-003-0337-1
2003 doi
-
[61]
Watson‐Parris, Y
D. Watson‐Parris, Y. Rao, D. Olivié, Ø. Seland, P. Nowack, et al. ClimateBench v1.0: A Benchmark for Data‐Driven Climate Projections. Journal of Advances in Modeling Earth Systems, 14(10), 2022. doi:10.1029/2021ms002954
2022 doi
- [62]
-
[63]
Brenowitz, Spencer K
Oliver Watt‐Meyer, Noah D. Brenowitz, Spencer K. Clark, Brian Henn, Anna Kwa, et al. Neural Network Parameterization of Subgrid‐Scale Physics From a Realistic Geography Global Storm‐Resolving Simulation. Journal of Advances in Modeling Earth Systems, 16(2), 2024. doi:10.1029/2...
2024 doi
-
[64]
Weyn, Dale R
Jonathan A. Weyn, Dale R. Durran, and Rich Caruana. Improving Data‐Driven Global Weather Prediction Using Deep Convolutional Neural Networks on a Cubed Sphere. Journal of Advances in Modeling Earth Systems, 12(9), 2020. doi:10.1029/2020ms002109
2020 doi
-
[65]
Matthew Wheeler and George N. Kiladis. Convectively Coupled Equatorial Waves: Analysis of Clouds and Temperature in the Wavenumber–Frequency Domain. Journal of the Atmospheric Sciences, 56(3):374–399, 1999. doi:10.1175/1520-0469(1999)056<0374:ccewao>2.0.co;2
1999 doi
-
[66]
Madden‐Julian Oscillation
Chidong Zhang. Madden‐Julian Oscillation. Reviews of Geophysics, 43(2), 2005. doi:10.1029/2004rg000158
2005 doi
-
[67]
Improving Global Weather Prediction in GFDL SHiELD Through an Upgraded GFDL Cloud Microphysics Scheme
Linjiong Zhou, Lucas Harris, Jan-Huey Chen, Kun Gao, Huan Guo, et al. Improving Global Weather Prediction in GFDL SHiELD Through an Upgraded GFDL Cloud Microphysics Scheme . Journal of Advances in Modeling Earth Systems, 14(7):e2021MS002971, 2022. doi:10.1029/2021MS002971
2022 doi
-
[68]
, " * write output.state after.block = add.period write newline
ENTRY address author booktitle chapter doi edition editor eid howpublished institution isbn journal key month note number organization pages publisher school series title type volume year label extra.label sort.label short.list INTEGERS output.state before.all mid.sentence aft...
-
[69]
write newline
" write newline "" before.all 'output.state := FUNCTION n.dashify 't := "" t empty not t #1 #1 substring "-" = t #1 #2 substring "--" = not "--" * t #2 global.max substring 't := t #1 #1 substring "-" = "-" * t #2 global.max substring 't := while if t #1 #1 substring * t #2 gl...
Reviewed August 12, 2026 · model on record in the stance chip above.
Discussion (0). Continue with ORCID to comment.