REVIEW 4 major objections 7 minor 49 references
Brightfield images predict Raman spectra at 98% similarity
Reviewed by Pith at T0; open to challenge. T0 means a machine referee read the full paper against a public rubric. the ladder, T0–T4 →
T0 review · glm-5.2
2026-07-09 03:36 UTC pith:ZCKCZRRW
load-bearing objection Novel brightfield-to-Raman translation with suggestive but insufficiently validated results; missing mean-spectrum baseline is the key gap. the 4 major comments →
Pic2Spec: Generative Modeling Reconstructs Single Cell Raman Fingerprints from Brightfield Images
The pith
A machine-rendered reading of the paper's core claim, the machinery that carries it, and where it could break.
Core claim
The central object is a dual-decoder variational autoencoder architecture in which a single encoder maps a 96×96 brightfield image into a 100-dimensional Gaussian latent space, from which two decoders jointly reconstruct the image and predict the Raman spectrum. The image-reconstruction branch acts as a structural anchor, preventing the latent space from drifting toward spectral-only features untethered from the observed cell morphology. The spectral decoder uses 1D convolutions with a composite loss combining mean squared error, cosine distance, derivative alignment, and peak-ratio preservation. The authors show this joint architecture preserves cell-to-cell spectral variability better than
What carries the argument
A dual-decoder VAE with a shared latent space linking brightfield morphology to Raman spectral output, trained with a four-component spectral loss (MSE, cosine, derivative, peak-ratio) and KL annealing.
Load-bearing premise
The evaluation rests on very small numbers of unique test cells (roughly 20–45 original cells per system after an 80:10:10 split, expanded 6-fold by augmentation), and the test spectra themselves are augmented copies of measurements from the same experimental session rather than independently acquired spectra, making it difficult to distinguish genuine cross-modal learning from memorization of session-specific correlations.
What would settle it
Train Pic2Spec on one experimental session's paired data, then test on paired brightfield-Raman data acquired in a separate session with different cell preparations; if spectral similarity drops sharply, the model has learned session-specific correlations rather than a generalizable morphology-to-biochemistry mapping.
If this is right
- If the image-to-spectrum mapping generalizes across microscope platforms and cell states, any laboratory with a brightfield microscope could perform label-free biochemical phenotyping without purchasing Raman hardware.
- The framework could extend to longitudinal live-cell monitoring, where repeated Raman measurements are impractical due to phototoxicity or throughput, by inferring molecular profiles from time-lapse brightfield images alone.
- The latent-space disentanglement of intensity from composition suggests that controlled latent perturbation could be used to explore how morphological changes map to specific biochemical shifts, enabling hypothesis generation about morphology-composition relationships.
- If the approach extends to clinical samples (blood, tissue aspirates), it could enable rapid pathogen identification or cell-state screening at point-of-care settings where Raman instrumentation is unavailable.
Where Pith is reading between the lines
- The high spectral similarity metrics may be partly explained by the relative homogeneity of Raman spectra within a given cell type; if the model learns to output a cell-type-conditioned mean spectrum with modest image-driven variation, cosine similarity and Pearson correlation would remain high even without a deep morphology-to-biochemistry mapping. The 20-point improvement in GFP classification o
- The saliency analysis showing spatially structured attribution within cell footprints is suggestive but not conclusive: a model that has learned session-specific correlations between image artifacts and spectral features could also produce cell-localized saliency maps.
- A decisive test would be to acquire paired brightfield-Raman data on one instrument, train the model, then evaluate on cells imaged on a different microscope or from a different culture batch, with independently acquired Raman spectra as ground truth rather than augmented copies of training-session measurements.
Editorial analysis
A structured set of objections, weighed in public.
Referee Report
Summary. This manuscript introduces Pic2Spec, a dual-decoder variational autoencoder that predicts single-cell Raman spectra from brightfield microscopy images. The model is trained and evaluated on paired image-spectrum datasets from Jurkat T cells, primary B cells, and E. coli (including GFP+ and GFP- strains). The authors report 98% cosine similarity and ~95% Pearson correlation between generated and measured spectra, and show that generated spectra discriminate GFP+ from GFP- E. coli at ~88% accuracy, outperforming an image-only baseline by ~20 percentage points. Architectural comparisons among three model variants, saliency mapping, and latent-space perturbation analyses are provided to argue that the learned mapping is structured and biochemically grounded. The central claim is that this constitutes the first demonstration of chemically informative virtual molecular fingerprints inferred from brightfield contrast alone.
Significance. If the central claim holds, this work would represent a meaningful advance in computational spectroscopy, potentially enabling molecular profiling from ubiquitous microscopy platforms. The dual-decoder VAE architecture, the multi-component spectral loss, and the latent-space interpretability analyses represent a thoughtful engineering effort. The GFP classification result, where generated spectra outperform image-only analysis, is the most compelling piece of evidence for image-conditioned biochemical inference. The saliency and latent perturbation analyses are commendable attempts at mechanistic interpretation.
major comments (4)
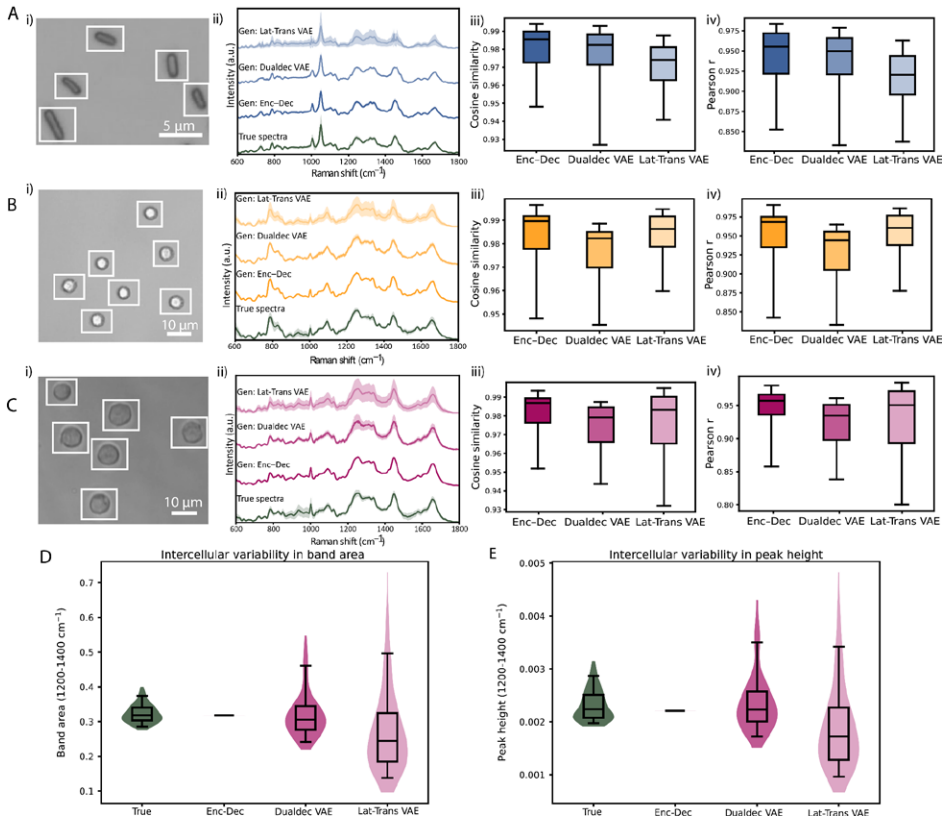
- No mean-spectrum baseline is reported anywhere in the manuscript. This is load-bearing for the central claim of 'cell-dependent spectra prediction' (Results, paragraph 4: 'Pic2Spec captures cell-resolved spectral structure... rather than merely reproducing population-level averages'). Raman spectra within a cell type share highly conserved major vibrational bands; a model that simply outputs the cell-type mean training spectrum would likely achieve very high cosine similarity and Pearson correlation. The paper's own architectural comparison provides indirect evidence of this risk: the Enc-Dec model is described as showing 'regression-to-the-mean behavior' with 'markedly compressed' variability (Fig. 4D-E), yet it still achieves cosine similarity and Pearson correlation values comparable to Pic2Spec (Fig. 4A-C(iii-iv)). This suggests that global similarity metrics are insensitive to cell-
- The effective test set sizes are very small after de-augmentation. Methods §5-6 state that each cell is augmented 6-fold (5 geometric transforms + original) and that augmented variants of the same cell are confined to a single split. With 206 T-cell and 209 B-cell pairs at an 80:10:10 split, the test sets of ~123 T cells and ~125 B cells derive from approximately 20-21 unique cells each. The bacterial test set of 270 derives from ~45 unique cells. These sample sizes are small for deep learning evaluation and limit the statistical reliability of the reported metrics and their confidence intervals. The manuscript should report the number of unique (de-augmented) test cells alongside the augmented counts and discuss the implications for generalization.
- Test spectra are augmented versions of original measurements (intensity scaling ±10%, Gaussian noise 0.5-2%, peak broadening 0-3 cm^-1; Methods §5), not independently acquired data. While the augmentation is designed to simulate experimental variability, the model is evaluated against perturbed copies of spectra from the same experimental session on the same instrument. This makes it difficult to distinguish genuine cross-modal learning from memorization of session-specific correlations. The manuscript should acknowledge this limitation explicitly and discuss how performance might change on independently acquired spectra from different sessions or instruments.
- The spectral loss function includes a peak-ratio term (L_ratio, Methods §7, Eq. for L_ratio) that constrains selected peak-intensity ratios (I_1008/I_1120, I_720/I_740, I_995/I_1010). The same ratios are then evaluated in Fig. 5B to demonstrate that 'Pic2Spec retained relative intensity structure between functionally related peaks rather than reproducing the average spectral shape.' Since these ratios are directly optimized during training, their preservation in generated spectra is partly expected by construction and does not independently demonstrate that the model learns a generalizable morphological-to-biochemical mapping. The authors should clarify this circularity and evaluate peak ratios that were not included in the loss function.
minor comments (7)
- The abstract states '98% cosine similarity and Pearson correlations of ~95%' without specifying that these are median values; the main text (Fig. 2C) reports median Pearson r = 0.94 [0.90-0.95] for T cells, which is slightly below ~95%. Clarify.
- Fig. 2C caption states 'n=123 T cells, n=125 B cells' but does not clarify that these are augmented counts. Adding the unique cell count would improve transparency.
- The notation in Methods §7 for the spectral loss uses both 'K' and 'L' for spectral length in different equations (L_MSE uses K, while the text later refers to L=573). Standardize.
- The SAM metric is defined as 'R_S(y, ŷ)' in Methods §8 but the symbol is unconventional; consider using θ or SAM to avoid confusion with Pearson's r.
- Fig. 5E caption refers to 'global intensity effect' and 'composition-sensitive (peak-ratio) effect' but the axes labels in the figure should match the definitions in Methods §12 (I_k and C_k) for clarity.
- The claim 'first demonstration of chemically informative virtual molecular fingerprints inferred purely from brightfield contrast' appears in both the abstract and significance statement. Given that the evaluation is limited to same-session data with augmented test spectra, this claim should be tempered or qualified.
- References 4 and 19 in the Supporting Information cite future dates (2025, 2026); verify these are correctly published or mark as 'in press.'
Simulated Author's Rebuttal
We thank the referee for a careful and substantive review. The comments identify legitimate concerns regarding baseline comparisons, effective sample sizes, spectral augmentation in the test set, and potential circularity in peak-ratio evaluation. We address each point below and describe concrete revisions we will make.
read point-by-point responses
-
Referee: No mean-spectrum baseline is reported. A model outputting the cell-type mean training spectrum would likely achieve high cosine similarity and Pearson correlation, and the Enc-Dec model shows regression-to-the-mean yet achieves comparable global metrics. This is load-bearing for the claim of cell-resolved spectral structure.
Authors: The referee is correct that a mean-spectrum baseline is essential and its absence is a significant gap. We will add this baseline in revision. We will compute the cell-type mean training spectrum and evaluate it against the held-out test set using all four metrics (RMSE, cosine similarity, Pearson correlation, SAM) for each cell system (T cells, B cells, bacteria, GFP+, GFP-). We expect the mean baseline to achieve high cosine similarity and Pearson correlation, which would confirm the referee's concern that global metrics alone are insufficient to demonstrate cell-resolved prediction. This is precisely why we included the band-area and peak-height variability analyses (Fig. 4D-E) and the single-cell spectral heterogeneity figures (Figs. S5, S7, S9): these show that Pic2Spec preserves cell-to-cell variability that the Enc-Dec model compresses. However, we agree that a direct quantitative comparison against the mean baseline strengthens this argument and should have been included. We will add it and will also report per-cell residual variance metrics (e.g., the standard deviation of residuals across cells) that are more sensitive to cell-resolved structure than global similarity metrics. We will temper the claim about 'cell-resolved spectral structure' to explicitly acknowledge that global similarity metrics cannot distinguish cell-resolved prediction from mean reproduction, and that our evidence for cell-resolved structure rests on the variability preservation analyses rather than the aggregate metrics. revision: yes
-
Referee: Effective test set sizes are very small after de-augmentation (~20-21 unique cells for T and B cells, ~45 for bacteria). These sample sizes limit statistical reliability of reported metrics and confidence intervals.
Authors: The referee's arithmetic is correct. With 6-fold augmentation and 80:10:10 splits, the test sets of 123 T-cell, 125 B-cell, and 270 bacterial spectra derive from approximately 20-21, 20-21, and 45 unique cells, respectively. We agree these are small for deep learning evaluation and that this limitation should be transparently reported. In revision, we will (1) report the number of unique de-augmented test cells alongside augmented counts in all relevant figure captions and the Methods, (2) add a discussion of the implications for generalization, and (3) note that confidence intervals reported on augmented test samples do not reflect independent biological replicates. We acknowledge that this is a genuine limitation of the current study that cannot be fully resolved without additional data collection. We will state this explicitly as a scope limitation and identify larger-scale data acquisition as a priority for future work. We respectfully note that the augmented test samples do represent non-overlapping cells (augmented variants of the same cell are confined to one split), so there is no train-test leakage; the issue is statistical power, not data contamination. revision: yes
-
Referee: Test spectra are augmented versions of original measurements (intensity scaling, noise, peak broadening), not independently acquired data. This makes it difficult to distinguish genuine cross-modal learning from memorization of session-specific correlations.
Authors: This is a fair and important concern. The spectral augmentation (intensity scaling ±10%, Gaussian noise 0.5-2%, peak broadening 0-3 cm^-1) is applied to spectra from the same experimental session and instrument, so the test set does not represent fully independent spectral measurements. We agree that this should be acknowledged as a limitation. In revision, we will add an explicit discussion of this point in the manuscript, noting that (1) the test spectra are perturbed copies of same-session measurements rather than independently acquired data, (2) performance on truly independent spectra from different sessions or instruments may differ due to session-specific correlations, calibration drift, or instrument variability, and (3) cross-session and cross-instrument validation is needed to establish robustness to domain shift. We note that the brightfield images in the test set are geometrically augmented (rotations, flips) rather than intensity-perturbed, and the image-to-spectrum mapping must still generalize across orientations. However, the referee's core point stands: the spectral targets share session-specific characteristics with training data, and we cannot rule out that the model exploits some session-specific correlations. We will state this limitation clearly and identify cross-session validation as a critical next step. We cannot fully resolve this concern with the current dataset. revision: yes
-
Referee: The spectral loss includes L_ratio constraining peak ratios (I_1008/I_1120, I_720/I_740, I_995/I_1010), and the same ratios are evaluated in Fig. 5B. This is circular: their preservation is partly expected by construction.
Authors: The referee is correct that evaluating peak ratios that are directly optimized in the loss function is circular and does not independently demonstrate generalization. We will address this in two ways. First, we will explicitly acknowledge in the manuscript that the three ratios shown in Fig. 5B (I_1008/I_1120, I_720/I_740, I_995/I_1010) are the same ratios included in L_ratio, and that their preservation is therefore partly expected by construction. Second, we will evaluate additional peak ratios that were NOT included in the loss function. Specifically, we will compute ratios such as I_1450/I_1660 (CH2/Amide I), I_1003/I_1200 (phenylalanine/amide III), and I_785/I_1095 (nucleic acid/phosphate) between true and generated spectra, and report JS divergence for these non-optimized ratios. If these ratios are also preserved, it would provide independent evidence that the model learns a generalizable morphological-to-biochemical mapping rather than merely satisfying the loss constraints. If they are not preserved, we will report that honestly and adjust our claims accordingly. We will revise the Fig. 5B analysis and accompanying text to separate optimized from non-optimized ratios and to clarify which conclusions rest on independent evidence. revision: yes
- The small number of unique cells (20-45 per test set) is a fundamental limitation of the current dataset that cannot be resolved without new data collection. We can acknowledge it transparently but cannot increase the sample sizes in revision.
- Cross-session and cross-instrument validation cannot be performed with existing data, as all measurements were acquired on a single instrument in single sessions per cell type. We can acknowledge this as a limitation but cannot address it within the scope of this revision.
Circularity Check
No significant circularity; minor overlap between training loss components and evaluation metrics, but central claims supported by independent evaluation on held-out data.
full rationale
Pic2Spec is a supervised generative model trained on paired brightfield-Raman data and evaluated on held-out test cells. The spectral reconstruction loss includes cosine similarity (λ=0.2) and peak-ratio (λ=0.005) terms, which overlap with some reported evaluation metrics (cosine similarity in Fig. 2C/G, peak ratios in Fig. 5B). However, this is standard supervised ML practice: the model is evaluated on non-overlapping held-out cells, and high metrics on test data are not guaranteed by the training objective. The peak-ratio loss uses an unspecified set P of peak pairs with a very small weight (0.005), and the peak-ratio evaluation uses JS divergence at the distribution level rather than per-sample loss. The paper's central claim — that generated spectra discriminate GFP+ from GFP- E. coli at 88% accuracy — is supported by an independent downstream classification task not tied to the spectral reconstruction loss. The sole self-citation (Ref. 19, SpectroGen by co-author Tadesse) is contextual and not load-bearing. No derivation step reduces to its inputs by construction.
Axiom & Free-Parameter Ledger
free parameters (6)
- λ_img (image reconstruction loss weight) =
0.5
- λ_MSE, λ_cos, λ_deriv, λ_ratio (spectral loss weights) =
1.0, 0.2, 0.05, 0.005
- Latent dimensionality =
100
- Convolutional filter sizes (8, 16, 4, 4) =
8, 16, 4, 4
- β-annealing schedule =
Not specified numerically
- Spectral augmentation parameters =
shift ±1.5 cm⁻¹, intensity ±10%, noise 0.5-2%, broadening 0-3 cm⁻¹
axioms (3)
- domain assumption There exists a learnable mapping from brightfield image morphology to Raman spectral structure at the single-cell level.
- domain assumption Brightfield images do not contain fluorescence or other non-morphological chemical information.
- ad hoc to paper Augmented spectra are valid proxies for independently acquired measurements.
read the original abstract
Single-cell molecular characterization remains a bottleneck in scalable biological analysis because of labeling requirements, limited multiplexing, and reagents that perturb physiology. Raman spectroscopy addresses these limits by providing chemically specific, label-free vibrational fingerprints, but long acquisition times and specialized instruments restrict high-throughput use. Here, we overcome this barrier by showing that spectral fingerprints can be reconstructed from brightfield microscopy using generative modeling. We introduce Pic2Spec, a framework that learns a shared latent biochemical representation linking image morphology to vibrational spectral structure, enabling virtual Raman spectroscopy without hardware. We validate Pic2Spec across mammalian and bacterial cells, generating high-fidelity spectra that reproduce measured Raman fingerprints with 98% cosine similarity and Pearson correlations of ~95%, while preserving biochemical peaks and population distributions. Beyond spectral similarity, Pic2Spec provides molecular-level resolution in bacterial systems: generated spectra discriminate mutation-driven transgenic states and predict GFP expression with accuracy approaching true Raman measurements, outperforming conventional image analysis by 20%. These findings establish Pic2Spec as a first demonstration of chemically informative virtual molecular fingerprinting from brightfield images, complementing slow, hardware-intensive spectroscopy with computational inference. By redefining microscopy as an inference-enabled molecular profiling platform, Pic2Spec democratizes label-free biochemical phenotyping and overcomes the hardware and time constraints that have confined spectroscopy to specialized laboratories. This enables high-throughput molecular analysis for clinical diagnostics, screening, and monitoring at the scale and accessibility of standard microscopy.
Figures



Reference graph
Works this paper leans on
-
[1]
Chen, B. et al. Label-free live cell recognition and tracking for biological discoveries and translational applications. npj Imaging 2, 41 (2024)
work page 2024
-
[2]
McKinnon, K. M. Flow Cytometry: An Overview. Current Protocols in Immunology 120, 5.1.1-5.1.11 (2018)
work page 2018
-
[3]
Robinson, J. P., Ostafe, R., Iyengar, S. N., Rajwa, B. & Fischer, R. Flow Cytometry: The Next Revolution. Cells 12, 1875 (2023)
work page 2023
-
[4]
Hemme, C. L., Atoyan, J., Cai, A. & Liu, C. Challenges and Opportunities in Multi -Omics Data Acquisition and Analysis: Toward Integrative Solutions. Biomolecules 16, 271 (2026)
work page 2026
-
[5]
Record, C. J. & Reilly, M. M. Lessons and pitfalls of whole genome sequencing. Practical Neurology 24, 263–274 (2024)
work page 2024
-
[6]
Kobayashi-Kirschvink, K. J. et al. Prediction of single-cell RNA expression profiles in live cells by Raman microscopy with Raman2RNA. Nat Biotechnol 42, 1726–1734 (2024)
work page 2024
-
[7]
Kamei, K. F. & Wakamoto, Y. Live-cell omics with Raman spectroscopy. Microscopy (Oxf) 74, 189–200 (2025)
work page 2025
-
[8]
Pavillon, N. & Smith, N. I. Non-invasive monitoring of T cell differentiation through Raman spectroscopy. Sci Rep 13, 3129 (2023)
work page 2023
-
[9]
Pavillon, N. et al. Non-invasive detection of regulatory T cells with Raman spectroscopy. Sci Rep 14, 14025 (2024)
work page 2024
-
[10]
Zhang, Y. et al. From Genotype to Phenotype: Raman Spectroscopy and Machine Learning for Label-Free Single-Cell Analysis. ACS Nano 18, 18101–18117 (2024)
work page 2024
-
[11]
Li, Y. et al. Rapid culture-free diagnosis of clinical pathogens via integrated microfluidic - Raman micro-spectroscopy. Nat Commun 17, 283 (2025)
work page 2025
-
[12]
Fernández-Galiana, Á., Bibikova, O., Vilms Pedersen, S. & Stevens, M. M. Fundamentals and Applications of Raman- Based Techniques for the Design and Development of Active Biomedical Materials. Advanced Materials 36, 2210807 (2024)
work page 2024
-
[13]
Pence, I. & Mahadevan -Jansen, A. Clinical instrumentation and applications of Raman spectroscopy. Chem Soc Rev 45, 1958–1979 (2016)
work page 1958
-
[14]
Harrison, P. J. et al. Evaluating the utility of brightfield image data for mechanism of action prediction. PLoS Comput Biol 19, e1011323 (2023)
work page 2023
-
[15]
Skrivergaard, S., Rasmussen, M. K., Therkildsen, M. & Young, J. F. High- Throughput Label-Free Continuous Quantification of Muscle Stem Cell Proliferation and Myogenic Differentiation. Stem Cell Rev Rep 21, 2103–2120 (2025)
work page 2025
-
[16]
Schuster, V., Dann, E., Krogh, A. & Teichmann, S. A. multiDGD: A versatile deep generative model for multi-omics data. Nat Commun 15, 10031 (2024)
work page 2024
-
[17]
Radhakrishnan, A. et al. Cross-modal autoencoder framework learns holistic representations of cardiovascular state. Nat Commun 14, 2436 (2023)
work page 2023
- [18]
-
[19]
Zhu, Y. & Tadesse, L. F. SpectroGen: A physically informed generative artificial intelligence for accelerated cross-modality spectroscopic materials characterization. Matter 9, (2026)
work page 2026
-
[21]
Yaman, M. Y., Kalinin, S. V., Guye, K. N., Ginger, D. S. & Ziatdinov, M. Learning and Predicting Photonic Responses of Plasmonic Nanoparticle Assemblies via Dual Variational Autoencoders. Small 19, (2023)
work page 2023
-
[22]
Haque, M. I. U. et al. Deep learning- driven super -resolution in Raman hyperspectral imaging: Efficient high- resolution reconstruction from low -resolution data. Appl. Phys. Lett. 125, (2024)
work page 2024
-
[23]
Georgiev, D. et al. Hyperspectral unmixing for Raman spectroscopy via physics - constrained autoencoders. Proceedings of the National Academy of Sciences 121 , e2407439121 (2024)
work page 2024
-
[24]
He, H. et al. Noise learning of instruments for high- contrast, high -resolution and fast hyperspectral microscopy and nanoscopy. Nat Commun 15, 754 (2024)
work page 2024
-
[25]
Pathak, P. et al. Spectral Similarity Measures for In Vivo Human Tissue Discrimination Based on Hyperspectral Imaging. Diagnostics (Basel) 13, 195 (2023)
work page 2023
-
[26]
Ho, C.-S. et al. Rapid identification of pathogenic bacteria using Raman spectroscopy and deep learning. Nat Commun 10, 4927 (2019)
work page 2019
-
[27]
Evans, T. D. & Zhang, F. Bacterial Metabolic Heterogeneity: Origins and Applications in Engineering and Infectious Disease. Curr Opin Biotechnol 64, 183–189 (2020)
work page 2020
-
[28]
Arvaniti, M. & Skandamis, P. N. Defining bacterial heterogeneity and dormancy with the parallel use of single-cell and population level approaches. Current Opinion in Food Science 44, 100808 (2022)
work page 2022
-
[29]
Uemura, K. et al. Rapid and Integrated Bacterial Evolution Analysis unveils gene mutations and clinical risk of Klebsiella pneumoniae. Nat Commun 16, 2917 (2025). Supporting Information Pic2Spec: Generative Modeling Reconstructs Single Cell Raman Fingerprints from Brightfield Images Srilakshmi Premachandran1, Amit Kumar Bhuyan1, Loza F. Tadesse1,2,3* 1Dep...
work page 2025
-
[30]
Cell culture E. coli strain Seattle 1946 cells (#25922 and #25922GFP for GFP− and GFP+ cells, respectively) were purchased from American Type Culture Collection (ATCC). Cells stored as frozen glycerol stock were streaked onto polystyrene plates with solidified LB agar media (Teknova, Cat. #L1100). Cells were incubated overnight at 37 ℃. A single bacterial...
work page 1946
-
[31]
Acquisition of BF Images and Raman spectra of single bacterial cells BF images were acquired using a Witec Alpha 300 high-intensity white-light LED lamp for Köhler illumination, providing uniform illumination of the sample. Images of single cells were collected using a 100x objective (Zeiss EC Epiplan- Neofluar, NA = 0.9) at 50% illumination intensity. Th...
-
[32]
BF image preprocessing The collected BF images were processed using the Cellpose deep-learning cellular segmentation model to filter single cells morphologically1. Each raw image was loaded and smoothed using a Gaussian filter to suppress high-frequency noise while preserving cell boundaries. Segmentation of single cells was performed using the pretrained...
-
[33]
Raman spectral preprocessing Single-cell Raman spectra were preprocessed using a custom Python pipeline for cosmic ray removal, truncation, baseline correction, smoothing, and normalization. To correct for cosmic ray spikes, each raw spectrum was passed through a 1D median filter, and an intensity vector was computed using a kernel size of 5 points. The d...
-
[34]
Data Augmentation To increase the effective size of training data, the preprocessed single cell images of bacteria were subjected to geometric augmentation using the Pillow imaging library. Each input image was augmented using five geometric transformations, providing invar iance to cell orientation. This included horizontal and vertical flips, 90, 180, a...
-
[35]
Data stratification The image and spectral dataset consists of data acquired from 2 bacterial classes (E. coli and E. coli GFP+). Data stratification and splitting were performed to ensure class balance and prevent any augmentation leakage between the training, validation, and test data. An 80-10-10 split was performed for training, validation, and test d...
-
[36]
Schematic comparison of generative architectures for image-to-Raman translation
Model descriptions Scheme S1. Schematic comparison of generative architectures for image-to-Raman translation. The three model designs evaluated in this study are illustrated. Top, Dual-decoder VAE: a shared image encoder maps the input brightfield image into a common latent space that is decoded through two branches to jointly reconstruct the input image...
-
[37]
Spatial downsampling was performed using 2×2 max pooling between convolutional blocks, yielding a final encoder feature map of size 6×6×4. This representation was flattened to 144 units and projected to the latent mean and log- variance vectors. Latent sampling was performed using the reparameterization trick, 𝑧𝑧= 𝝁𝝁 + 𝑒𝑒𝑥𝑥𝑒𝑒( 1 2 𝑙𝑙𝑙𝑙𝑙𝑙𝞼𝞼2) ⊙ 𝛆𝛆 , with 𝛆...
-
[38]
Each convolution was followed by 2 × 2 max pooling, progressively reducing the spatial resolution from 96 × 96 to 6 × 6. The resulting feature map was flattened and projected to a 100- dimensional latent representation through a fully connected layer. The spectral decoder transformed the latent representation into a Raman spectrum of length 573. The laten...
-
[39]
All metrics were computed independently for each spectrum over the full spectral length
Evaluation metrics Model performance was evaluated by comparing each predicted Raman spectrum variable( 𝑦𝑦�) with its corresponding ground-truth spectrum variable(y) using four complementary metrics: root mean squared error (RMSE), cosine similarity, Pearson correlation coefficient, and spectral angle mapper (SAM). All metrics were computed independently ...
-
[40]
Peak characteristics analysis Peak-level spectral characteristics were quantified from each Raman spectrum to assess whether generated spectra preserved key local features of the true measurements. For each spectrum, peak detection was performed within the Raman window using a prominence- based approach implemented in SciPy. Peaks were required to exceed ...
-
[41]
Saliency Mapping Gradient-based saliency maps were generated to identify image regions contributing to spectral prediction. For a given input BF image 𝑥𝑥, the trained model produced a predicted spectrum 𝑦𝑦�, and a scalar target s( 𝑦𝑦�) was defined as the summed predicted intensity within a selected spectral band. Band limits specified in wavenumber space ...
-
[42]
Classification models Binary classification of GFP+ and GFP− E. coli was performed to determine whether generated Raman spectra preserved class-relevant molecular information. A common held-out test set was maintained across all evaluation settings to ensure direct comparability. Three matched testing conditions were used: Test 1, classification from expe...
-
[43]
Interpretability Analyses To interrogate how the learned representation organizes spectral variability and to determine whether individual latent variables encode physically meaningful transformations, systematic perturbation-based analysis of the latent space was performed. This approach examines how controlled perturbations of latent coordinates propaga...
-
[44]
Stringer, C., Wang, T., Michaelos, M. & Pachitariu, M. Cellpose: a generalist algorithm for cellular segmentation. Nat Methods 18, 100–106 (2021)
work page 2021
-
[45]
Probabilistic Latent Variable Models: Principles and Foundations for Modern Generative AI
Chen, T. Probabilistic Latent Variable Models: Principles and Foundations for Modern Generative AI. SSRN Scholarly Paper at https://doi.org/10.2139/ssrn.5244929 (2025)
-
[46]
Variational Encoder-Decoders for Learning Latent Representations of Physical Systems
Venkatasubramanian, S. & Barajas-Solano, D. A. Variational Encoder-Decoders for Learning Latent Representations of Physical Systems. arXiv.org https://arxiv.org/abs/2412.05175v1 (2024)
work page internal anchor Pith review Pith/arXiv arXiv 2024
-
[47]
Stein, H. S., Guevarra, D., Newhouse, P. F., Soedarmadji, E. & Gregoire, J. M. Machine learning of optical properties of materials – predicting spectra from images and images from spectra. Chem. Sci. 10, 47–55 (2018)
work page 2018
-
[48]
Adhikari, S. & Mondal, J. Elucidating Protein Dynamics through the Optimal Annealing of Variational Autoencoders. J. Chem. Theory Comput. 21, 6367–6379 (2025)
work page 2025
-
[49]
Wei, R. & Mahmood, A. Recent Advances in Variational Autoencoders With Representation Learning for Biomedical Informatics: A Survey. IEEE Access 9, 4939–4956 (2021)
work page 2021
-
[50]
Li, P., Pei, Y. & Li, J. A comprehensive survey on design and application of autoencoder in deep learning. Applied Soft Computing 138, 110176 (2023)
work page 2023
discussion (0)
Sign in with ORCID, Apple, or X to comment. Anyone can read and Pith papers without signing in.