Initial Characterization of Stellar Photometry of Roman images from the OpenUniverse Simulations
Pith reviewed 2026-05-19 10:35 UTC · model grok-4.3
The pith
Library of effective PSFs recovers stellar fluxes in Roman simulations to 0.6-1.2 percent precision
A machine-rendered reading of the paper's core claim, the machinery that carries it, and where it could break.
Core claim
Using a library of effective PSFs compatible with the OpenUniverse HLTDS simulations, stellar flux is recovered to between 0.6 and 1.2 percent photometric precision, with redder bands performing better. Dividing each chip into 8 sub-SCAs improves flux recovery by up to 20 percent. Non-linearity is measured at |s_NL| less than 1.93 times 10 to the minus 3 per dex, and the largest color dependence appears in the R062 band. Detection efficiency functions are characterized for each filter.
What carries the argument
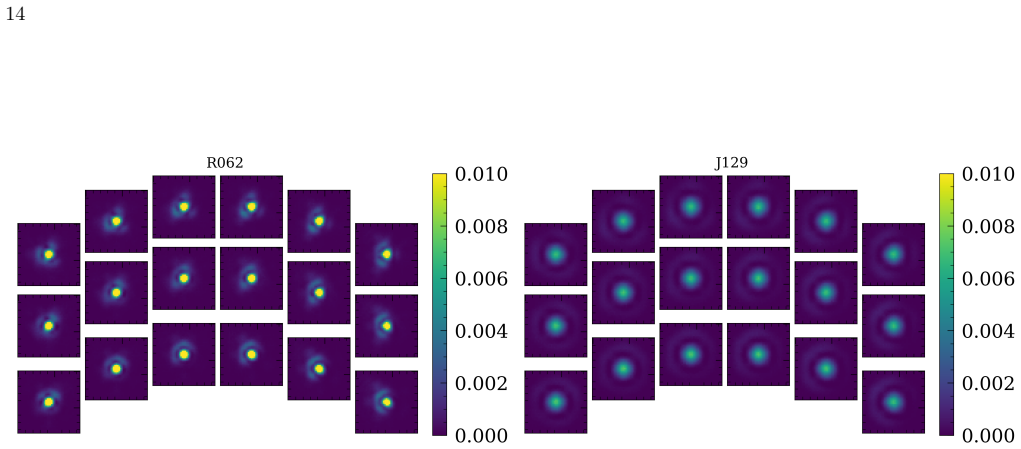
Library of effective PSFs (ePSFs) that model the telescope's spatially varying and undersampled point spread function to enable accurate flux extraction
If this is right
- Redder bands deliver better photometric precision than bluer ones under the same conditions.
- Dividing sensors into eight sub-regions reduces photometric scatter by up to 20 percent.
- Measured non-linearity of 1.93 times 10 to the minus 3 per dex exceeds some stated detector requirements.
- Color dependence is strongest in R062 and may require a color-dependent PSF model.
- Detection efficiency curves are now available for each Roman filter for use in future analyses.
Where Pith is reading between the lines
- These precision benchmarks could support tighter dark energy constraints from high-redshift supernovae if they hold in real data.
- The sub-SCA division technique may apply to other wide-field space telescopes with undersampled PSFs.
- Refining the ePSF library further could reduce the observed color residuals.
- Once real Roman images arrive, repeating the same tests on flight data will test whether the simulation-based numbers transfer.
Load-bearing premise
The OpenUniverse simulations accurately reproduce the real Roman telescope's point spread function and detector response.
What would settle it
Comparison of the reported 0.6-1.2 percent flux recovery numbers against photometry measured on actual Roman flight data once observations begin.
Figures


read the original abstract
NASA's Nancy Grace Roman Space Telescope (Roman) will provide an opportunity to study dark energy with unprecedented precision and accuracy using several techniques, including measurements of high-$z$ Type Ia Supernovae (SNe Ia, $z \lesssim 3.0$) via the High-Latitude Time Domain Survey (HLTDS). In this work, we do an initial "benchmark" characterization of the photometric repeatability of stellar fluxes, which must be below $1\%$ when sky noise is subdominant in order to enable a number of calibration requirements. Achieving this level of flux precision requires attention to Roman's highly-structured, spatially-varying, undersampled PSF. In this work, we build a library of effective PSFs (ePSFs) compatible with the OpenUniverse HLTDS simulations. Using our library of ePSFs, we recover stellar flux to between $0.6 - 1.2\%$ photometric precision, finding that redder bands perform better by this metric. We also find that flux recovery is improved by up to $20\%$ when a chip (sensor chip assembly; SCA) is divided into 8 sub-SCAs in order to account for the spatial variation of the PSF. With our optimized algorithm, we measure non-linearity due to photometry (magnitude dependence) of $|s_{NL}| < 1.93 \times 10^{-3}$ per dex, which is still larger than stated requirements for detector effects and indicates that further work is necessary. We also measure the dependence of photometric residuals on stellar color, and find the largest possible dependence in R062, implying a color-dependent PSF model may be needed. Finally, we characterize the detection efficiency function of each OpenUniverse Roman filter, which will inform future studies.
Editorial analysis
A structured set of objections, weighed in public.
Referee Report
Summary. The manuscript presents an initial benchmark characterization of stellar photometry on simulated Nancy Grace Roman Space Telescope images from the OpenUniverse HLTDS. The authors construct a library of effective PSFs (ePSFs) and use it to recover stellar fluxes, reporting precisions between 0.6% and 1.2% (with redder bands performing better), up to 20% improvement when dividing each SCA into 8 sub-SCAs to capture spatial PSF variation, a non-linearity coefficient |s_NL| < 1.93e-3 per dex, color-dependent residuals (largest in R062), and detection efficiency functions for each filter. The work is positioned as relevant to achieving sub-1% photometric repeatability when sky noise is subdominant for HLTDS calibration requirements.
Significance. If the OpenUniverse HLTDS simulations accurately capture the real Roman instrument's spatially varying, undersampled PSF and detector response, the reported flux-recovery benchmarks and sub-SCA improvement provide a concrete starting point for photometric calibration planning. The explicit numerical results on precision, non-linearity, and detection efficiency, together with the focus on spatial variation, constitute a useful initial data point for the community. The paper does not include machine-checked proofs or parameter-free derivations, but the simulation-based approach allows direct testing of analysis choices.
major comments (3)
- [Abstract] Abstract: The headline claim of 0.6–1.2% photometric precision is stated without error bars, sample sizes, or an explicit definition of the precision metric (e.g., rms or median absolute deviation of flux residuals relative to truth), which is load-bearing for determining whether the sub-1% requirement is actually met and for assessing the statistical significance of the reported band dependence.
- [Abstract] Abstract and results on non-linearity: The measured |s_NL| < 1.93 × 10^{-3} per dex is noted to exceed stated detector requirements, yet no mitigation path, impact quantification on the central flux-recovery claims, or comparison to an independent truth table is provided; this directly affects the interpretation of the overall photometric repeatability.
- [Results on sub-SCAs] Section describing sub-SCA division (results): The reported up to 20% improvement in flux recovery when using 8 sub-SCAs per chip lacks details on the exact division algorithm, the number of stars or realizations used, and any statistical test confirming the improvement is not due to chance, which is central to the claim that spatial variation must be modeled at this granularity.
minor comments (2)
- [Abstract] The abstract introduces 'ePSFs' and 'SCA' without immediate expansion or reference to the first definition in the main text.
- [Figures] Figure captions and axis labels for the photometric residual plots should explicitly state the sample size and whether residuals are normalized by input flux or magnitude.
Simulated Author's Rebuttal
We thank the referee for their constructive and detailed comments, which have identified several areas where the manuscript can be clarified and strengthened. We address each major comment below and indicate the revisions we will make in the next version of the manuscript.
read point-by-point responses
-
Referee: [Abstract] Abstract: The headline claim of 0.6–1.2% photometric precision is stated without error bars, sample sizes, or an explicit definition of the precision metric (e.g., rms or median absolute deviation of flux residuals relative to truth), which is load-bearing for determining whether the sub-1% requirement is actually met and for assessing the statistical significance of the reported band dependence.
Authors: We agree that the abstract would benefit from greater specificity on this point. The precision values reported in the manuscript are computed as the root-mean-square (RMS) of the relative flux residuals ((F_recovered - F_true)/F_true) for stars in the regime where sky noise is subdominant. In the revised manuscript we will explicitly define this metric in the abstract, report the approximate number of stars per filter used in the calculation, and include uncertainty estimates on the 0.6–1.2% range. These additions will allow readers to evaluate both the sub-1% requirement and the significance of the band-to-band differences. revision: yes
-
Referee: [Abstract] Abstract and results on non-linearity: The measured |s_NL| < 1.93 × 10^{-3} per dex is noted to exceed stated detector requirements, yet no mitigation path, impact quantification on the central flux-recovery claims, or comparison to an independent truth table is provided; this directly affects the interpretation of the overall photometric repeatability.
Authors: We acknowledge that the non-linearity result requires additional context. In the revision we will add a short discussion of possible mitigation strategies (e.g., magnitude-dependent corrections or restricting calibration to a narrower magnitude range) and will estimate the contribution of this term to the overall flux-recovery error budget. Because the study is performed on simulations, the input catalog provides the truth table; we will clarify this point and note that independent cross-checks will be needed once real Roman data become available. revision: yes
-
Referee: [Results on sub-SCAs] Section describing sub-SCA division (results): The reported up to 20% improvement in flux recovery when using 8 sub-SCAs per chip lacks details on the exact division algorithm, the number of stars or realizations used, and any statistical test confirming the improvement is not due to chance, which is central to the claim that spatial variation must be modeled at this granularity.
Authors: We agree that these methodological details should be provided. The sub-SCA division consists of splitting each SCA into eight equal-area rectangular regions; the revised text will describe this partitioning explicitly, state the exact number of stars and independent simulation realizations entering the comparison, and include a statistical significance test (bootstrap resampling of the residual distributions) to demonstrate that the reported improvement is unlikely to arise from random fluctuations. revision: yes
Circularity Check
No circularity: photometric precision measured directly on external simulations
full rationale
The paper builds an ePSF library compatible with the OpenUniverse HLTDS simulations and reports flux recovery precision (0.6-1.2%) by direct comparison to the known input stellar fluxes in those simulations. This constitutes an empirical measurement on an external benchmark rather than any derivation, fit, or prediction that reduces to the paper's own inputs by construction. No equations, self-citations, or ansatzes are invoked that would make the reported precision equivalent to fitted parameters or prior author results. The simulations function as an independent testbed, satisfying the condition for a self-contained result against external benchmarks.
Axiom & Free-Parameter Ledger
free parameters (1)
- number of sub-SCAs
axioms (1)
- domain assumption OpenUniverse simulations accurately model Roman's undersampled and spatially varying PSF
Reference graph
Works this paper leans on
-
[1]
The Wide Field Infrared Survey Telescope: 100 Hubbles for the 2020s
Akeson, R., Armus, L., Bachelet, E., et al. 2019, arXiv e-prints, arXiv:1902.05569, doi: 10.48550/arXiv.1902.05569
work page internal anchor Pith review Pith/arXiv arXiv doi:10.48550/arxiv.1902.05569 2019
-
[2]
Report of the Dark Energy Task Force
Albrecht, A., Bernstein, G., Cahn, R., et al. 2006, arXiv e-prints, astro, doi: 10.48550/arXiv.astro-ph/0609591
work page internal anchor Pith review Pith/arXiv arXiv doi:10.48550/arxiv.astro-ph/0609591 2006
-
[3]
2016, Empirical Models for the WFC3/IR
Anderson, J. 2016, Empirical Models for the WFC3/IR
work page 2016
-
[4]
PSF, Instrument Science Report WFC3 2016-12, 42 pages
work page 2016
-
[5]
Anderson, J., & King, I. R. 2000, PASP, 112, 1360, doi: 10.1086/316632 Astropy Collaboration, Price-Whelan, A. M., Sip˝ ocz, B. M., et al. 2018, AJ, 156, 123, doi: 10.3847/1538-3881/aabc4f
-
[6]
2025, arXiv e-prints, arXiv:2505.00093, doi: 10.48550/arXiv.2505.00093
Berlfein, F., Mandelbaum, R., Li, X., et al. 2025, arXiv e-prints, arXiv:2505.00093, doi: 10.48550/arXiv.2505.00093
-
[7]
Bertin, E., & Arnouts, S. 1996, A&AS, 117, 393, doi: 10.1051/aas:1996164
-
[8]
2024, astropy/photutils: 1.13.0, 1.13.0, Zenodo, doi: 10.5281/zenodo.12585239
Bradley, L., Sip˝ ocz, B., Robitaille, T., et al. 2024, astropy/photutils: 1.13.0, 1.13.0, Zenodo, doi: 10.5281/zenodo.12585239
-
[9]
2021, Nancy Grace Roman Space Telescope On-Orbit Calibration Plan for the Wide Field Imager
Casertano, S., Appleton, P., Armus, L., et al. 2021, Nancy Grace Roman Space Telescope On-Orbit Calibration Plan for the Wide Field Imager
work page 2021
-
[10]
Harris, C. R., Millman, K. J., van der Walt, S. J., et al. 2020, Nature, 585, 357, doi: 10.1038/s41586-020-2649-2
-
[11]
Hounsell, R., Scolnic, D., Foley, R. J., et al. 2018, ApJ, 867, 23, doi: 10.3847/1538-4357/aac08b
-
[12]
Hunter, J. D. 2007, Computing in Science & Engineering, 9, 90, doi: 10.1109/MCSE.2007.55
-
[13]
Jarvis, M., Bernstein, G. M., Amon, A., et al. 2021b, MNRAS, 501, 1282, doi: 10.1093/mnras/staa3679
-
[14]
Lauer, T. R. 1999, PASP, 111, 1434, doi: 10.1086/316460
-
[15]
2025, arXiv e-prints, arXiv:2501.05632, doi: 10.48550/arXiv.2501.05632 pandas development team, T
Collaboration, The Roman HLIS Project Infrastructure Team, et al. 2025, arXiv e-prints, arXiv:2501.05632, doi: 10.48550/arXiv.2501.05632 pandas development team, T. 2020, pandas-dev/pandas: Pandas, latest, Zenodo, doi: 10.5281/zenodo.3509134
-
[16]
Rodney, S. A., Riess, A. G., Strolger, L.-G., et al. 2014, AJ, 148, 13, doi: 10.1088/0004-6256/148/1/13
-
[17]
Rose, B., Vincenzi, M., Hounsell, R., et al. 2025, submitted to ApJ
work page 2025
-
[18]
arXiv e-prints , archivePrefix =
Rose, B. M., Baltay, C., Hounsell, R., et al. 2021, arXiv e-prints, arXiv:2111.03081, doi: 10.48550/arXiv.2111.03081
-
[19]
2025, arXiv e-prints, arXiv:2501.05781, doi: 10.48550/arXiv.2501.05781
Schutt, T., Jarvis, M., Roodman, A., et al. 2025, arXiv e-prints, arXiv:2501.05781, doi: 10.48550/arXiv.2501.05781
-
[20]
WFIRST-2.4: What Every Astronomer Should Know
Spergel, D., Gehrels, N., Breckinridge, J., et al. 2013, arXiv e-prints, arXiv:1305.5425, doi: 10.48550/arXiv.1305.5425
work page internal anchor Pith review Pith/arXiv arXiv doi:10.48550/arxiv.1305.5425 2013
-
[21]
Wide-Field InfrarRed Survey Telescope-Astrophysics Focused Telescope Assets WFIRST-AFTA 2015 Report
Spergel, D., Gehrels, N., Baltay, C., et al. 2015, arXiv e-prints, arXiv:1503.03757, doi: 10.48550/arXiv.1503.03757
work page internal anchor Pith review Pith/arXiv arXiv doi:10.48550/arxiv.1503.03757 2015
-
[22]
Troxel, M. A., Lin, C., Park, A., et al. 2023, MNRAS, 522, 2801, doi: 10.1093/mnras/stad664
-
[23]
Virtanen, P., Gommers, R., Oliphant, T. E., et al. 2020, Nature Methods, 17, 261, doi: 10.1038/s41592-019-0686-2 Wes McKinney. 2010, in Proceedings of the 9th Python in Science Conference, ed. St´ efan van der Walt & Jarrod Millman, 56 – 61, doi: 10.25080/Majora-92bf1922-00a
discussion (0)
Sign in with ORCID, Apple, or X to comment. Anyone can read and Pith papers without signing in.