VESTA: Visual Exploration with Statistical Tool Agents
Pith reviewed 2026-06-28 21:56 UTC · model grok-4.3
The pith
VESTA lets vision-language models create and reuse their own diagnostic tools during statistical model fitting, outperforming fixed-tool agent systems especially on complex tasks.
A machine-rendered reading of the paper's core claim, the machinery that carries it, and where it could break.
Core claim
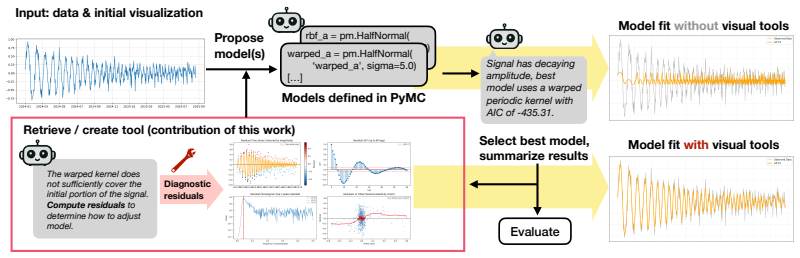
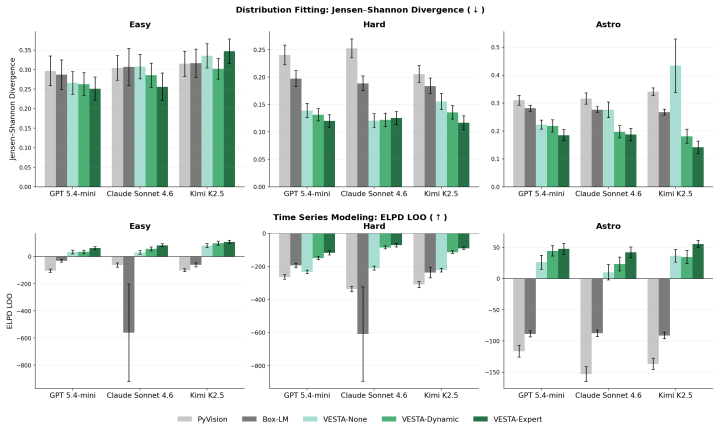
VESTA demonstrates that endowing VLMs with the ability to dynamically select or write diagnostic tools for data exploration and model refinement leads to better performance than prior agentic pipelines that use only critique loops or fixed tool sets. The largest improvements occur on complex and domain-specific tasks in the DAWN benchmark. Dynamically generated tools cover more diagnostic categories per function and show a strong preference for visual outputs that support direct reasoning by the VLM critic.
What carries the argument
The dynamic tool creation and accumulation mechanism, in which the VLM writes or selects new functions for transformations, visualizations, and tests that persist in context for reuse across refinement steps.
If this is right
- VESTA with dynamic tools outperforms no-tool and static-expert-tool baselines across the evaluated tasks.
- The performance gap widens on complex and domain-specific problems such as astronomy modeling.
- Dynamically generated tools are more sophisticated than those from existing visual tool-creation systems, spanning more diagnostic categories and favoring visual outputs.
- Tools accumulate in context and remain available for later reuse during iterative refinement.
Where Pith is reading between the lines
- If the tool-creation process scales, the same framework could be applied to other iterative scientific workflows that currently require extensive human-written diagnostics.
- The preference for visual outputs suggests the method may integrate naturally with existing vision-language capabilities rather than requiring separate text-only pipelines.
- Over repeated use on similar data types, the growing tool library might reduce the need for fresh tool invention on each new modeling problem.
Load-bearing premise
The specific modeling tasks in the DAWN benchmark, including the astronomy examples, represent the kinds of challenges where dynamic tools give a real advantage over static or no-tool approaches.
What would settle it
Running the same three toolkit configurations on a fresh collection of distribution-fitting or time-series tasks drawn from a different domain, such as particle physics or financial data, and finding that the dynamic-tool version loses its performance edge.
Figures
read the original abstract
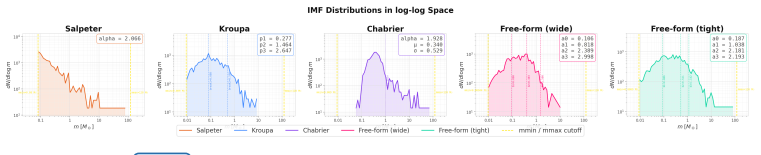
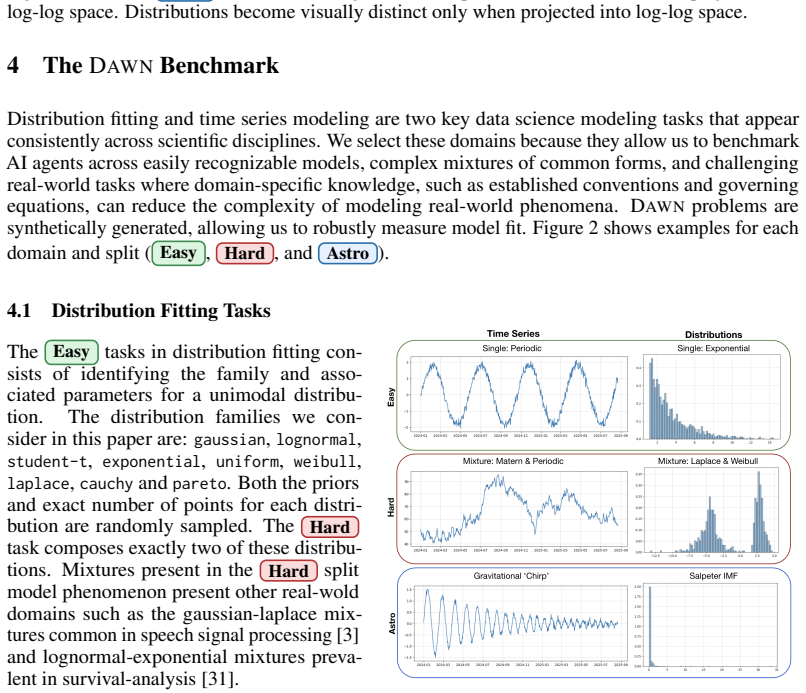
Fitting quantitative models to data is a central step in scientific workflows, yet it remains one of the least automated. Recent agent-based systems leverage language and vision-language models (VLMs) to iteratively propose and refine statistical models, but these systems struggle on more challenging modeling tasks. To address these limitations, we introduce VESTA: Visual Exploration with Statistical Tool Agents, a framework that equips VLMs with a dynamically growing exploration toolkit to guide model refinement through data transformations, hypothesis-driven visualizations, and robust statistical tests. Unlike prior systems that rely on iterative critique alone, VESTA actively explores data before and during refinement by selecting or creating diagnostic tools, which accumulate in the model's context and can be reused later. We evaluate VESTA against established baselines in three toolkit configurations: no tools, static expert-written tools, and dynamic model-written tools. To support this evaluation, we introduce DAWN (Dataset for Automated Workflows and Numerical Modeling), a benchmark targeting distribution fitting and time series modeling with varying difficulty tiers, and culminating in real-world astronomy tasks including modeling initial mass functions and gravitational-wave chirp signals. We find that VESTA's dynamic tool creation outperforms prior agentic pipelines, with the largest gains on complex and domain-specific tasks. We further show that dynamically generated tools are substantially more sophisticated than those produced by existing visual tool-creation systems, covering more diagnostic categories per function and strongly preferring visual outputs that the VLM critic can reason over directly.
Editorial analysis
A structured set of objections, weighed in public.
Referee Report
Summary. The manuscript introduces VESTA, a framework that augments vision-language models with a dynamically growing toolkit of statistical tools (data transformations, visualizations, and tests) for iterative model fitting and refinement. It introduces the DAWN benchmark covering distribution fitting, time series, and real-world astronomy tasks (initial mass functions, gravitational-wave signals), and reports results from three controlled configurations (no tools, static expert tools, dynamic model-written tools) showing that dynamic tool creation yields the largest gains on complex and domain-specific tasks while producing more sophisticated tools than prior visual tool-creation systems.
Significance. If the empirical results hold under full scrutiny of the methods and error analysis, the work would represent a meaningful step toward more adaptive agentic systems for scientific modeling. The introduction of a new benchmark with tiered difficulty and domain-specific astronomy examples, together with the explicit comparison of tool-creation strategies, provides a concrete testbed that future systems can build upon.
major comments (2)
- [Abstract (evaluation description)] The central empirical claim rests on the DAWN benchmark tasks being representative of the modeling challenges where static tools fail; however, the abstract provides no quantitative breakdown of task difficulty tiers or failure modes of baselines on the astronomy subset, making it difficult to assess whether the reported gains generalize beyond the chosen examples.
- [Abstract (tool sophistication result)] The claim that dynamically generated tools are 'substantially more sophisticated' is load-bearing for the contribution, yet the abstract does not specify the rubric or inter-rater protocol used to rate diagnostic categories and visual-output preference; without this, the comparison to existing visual tool-creation systems cannot be independently verified.
minor comments (1)
- [Abstract] The three toolkit configurations are described at a high level; adding a table that explicitly lists the tool inventory size, reuse frequency, and example tool signatures for each configuration would improve reproducibility.
Simulated Author's Rebuttal
We thank the referee for the constructive comments on the abstract. We address each major point below and will revise the abstract accordingly to improve clarity and verifiability while preserving its length.
read point-by-point responses
-
Referee: [Abstract (evaluation description)] The central empirical claim rests on the DAWN benchmark tasks being representative of the modeling challenges where static tools fail; however, the abstract provides no quantitative breakdown of task difficulty tiers or failure modes of baselines on the astronomy subset, making it difficult to assess whether the reported gains generalize beyond the chosen examples.
Authors: We agree that the abstract would benefit from a concise reference to the benchmark structure. The revised abstract will note the tiered design of DAWN (distribution fitting, time series, and domain-specific astronomy tasks) and state that dynamic tool creation yields the largest gains on the astronomy subset. Full quantitative results, including baseline failure rates and error analysis by tier, are already provided in Section 4 and Appendix B; we will ensure the abstract points readers to these sections. revision: yes
-
Referee: [Abstract (tool sophistication result)] The claim that dynamically generated tools are 'substantially more sophisticated' is load-bearing for the contribution, yet the abstract does not specify the rubric or inter-rater protocol used to rate diagnostic categories and visual-output preference; without this, the comparison to existing visual tool-creation systems cannot be independently verified.
Authors: The rubric (counting diagnostic categories such as distribution shape, outliers, and correlations, plus preference for visual outputs) and inter-rater protocol are described in Section 5.2. We will revise the abstract to briefly indicate that tool sophistication was assessed by human raters using these criteria. This addition will allow the claim to be evaluated from the abstract while directing readers to the full protocol in the main text. revision: yes
Circularity Check
No significant circularity; empirical evaluation on new benchmark
full rationale
The paper introduces VESTA as an empirical framework for agentic model fitting and evaluates it via controlled comparisons (no-tool, static tools, dynamic tools) on the newly introduced DAWN benchmark, including astronomy tasks. The abstract and described claims rest on direct performance reporting and tool-sophistication ratings rather than any derivation chain, equations, fitted parameters, or self-citation load-bearing premises. No load-bearing step reduces to its own inputs by construction, and the central results are externally falsifiable via the benchmark tasks.
Axiom & Free-Parameter Ledger
Reference graph
Works this paper leans on
-
[1]
Pymc: a modern, and comprehensive probabilistic programming framework in python.PeerJ Computer Science, 9:e1516, 2023
Oriol Abril-Pla, Virgile Andreani, Colin Carroll, Larry Dong, Christopher J Fonnesbeck, Maxim Kochurov, Ravin Kumar, Junpeng Lao, Christian C Luhmann, Osvaldo A Martin, et al. Pymc: a modern, and comprehensive probabilistic programming framework in python.PeerJ Computer Science, 9:e1516, 2023
2023
-
[2]
Evoskill: Automated skill discovery for multi-agent systems, 2026
Salaheddin Alzubi, Noah Provenzano, Jaydon Bingham, Weiyuan Chen, and Tu Vu. Evoskill: Automated skill discovery for multi-agent systems, 2026. URL https://arxiv.org/abs/ 2603.02766
Pith/arXiv arXiv 2026
-
[3]
Ali Aroudi, Hadi Veisi, Hossein Sameti, and Zahra Mafakheri. Speech signal modeling using multivariate distributions.EURASIP Journal on Audio Speech and Music Processing, 2015: 1–14, 12 2015. doi: 10.1186/s13636-015-0078-1
-
[4]
Nate Bastian, Kevin R. Covey, and Michael R. Meyer. A universal stellar initial mass function? a critical look at variations.Annual Review of Astronomy and Astro- physics, 48(V olume 48, 2010):339–389, 2010. ISSN 1545-4282. doi: https://doi.org/ 10 10.1146/annurev-astro-082708-101642. URL https://www.annualreviews.org/content/ journals/10.1146/annurev-ast...
-
[5]
Automated reverse engineering of nonlinear dynamical systems
Josh Bongard and Hod Lipson. Automated reverse engineering of nonlinear dynamical systems. Proceedings of the National Academy of Sciences of the United States of America, 104(24): 9943–9948, Jun 2007. doi: 10.1073/pnas.0609476104
-
[6]
Probabilistic grammars for equation discovery.CoRR, abs/2012.00428, 2020
Jure Brence, Ljupco Todorovski, and Saso Dzeroski. Probabilistic grammars for equation discovery.CoRR, abs/2012.00428, 2020. URLhttps://arxiv.org/abs/2012.00428
arXiv 2012
-
[7]
Large language models as tool makers, 2024
Tianle Cai, Xuezhi Wang, Tengyu Ma, Xinyun Chen, and Denny Zhou. Large language models as tool makers, 2024. URLhttps://arxiv.org/abs/2305.17126
arXiv 2024
-
[8]
Adaevolve: Adaptive llm driven zeroth-order optimization, 2026
Mert Cemri, Shubham Agrawal, Akshat Gupta, Shu Liu, Audrey Cheng, Qiuyang Mang, Ashwin Naren, Lutfi Eren Erdogan, Koushik Sen, Matei Zaharia, Alex Dimakis, and Ion Stoica. Adaevolve: Adaptive llm driven zeroth-order optimization, 2026. URL https://arxiv.org/ abs/2602.20133
arXiv 2026
-
[9]
2003, Publications of the Astronomical Society of the Pacific, 115, 763, doi: 10.1086/376392
Gilles Chabrier. Galactic stellar and substellar initial mass function.Publications of the Astronomical Society of the Pacific, 115(809):763–795, July 2003. ISSN 1538-3873. doi: 10.1086/376392. URLhttp://dx.doi.org/10.1086/376392
work page internal anchor Pith review doi:10.1086/376392 2003
-
[10]
Mle-bench: Evaluating machine learning agents on machine learning engineering, 2025
Jun Shern Chan, Neil Chowdhury, Oliver Jaffe, James Aung, Dane Sherburn, Evan Mays, Giulio Starace, Kevin Liu, Leon Maksin, Tejal Patwardhan, Lilian Weng, and Aleksander M ˛ adry. Mle-bench: Evaluating machine learning agents on machine learning engineering, 2025. URL https://arxiv.org/abs/2410.07095
Pith/arXiv arXiv 2025
-
[11]
Evoclaw: Evaluating ai agents on continuous software evolution, 2026
Gangda Deng, Zhaoling Chen, Zhongming Yu, Haoyang Fan, Yuhong Liu, Yuxin Yang, Dhruv Parikh, Rajgopal Kannan, Le Cong, Mengdi Wang, Qian Zhang, Viktor Prasanna, Xiangru Tang, and Xingyao Wang. Evoclaw: Evaluating ai agents on continuous software evolution, 2026. URLhttps://arxiv.org/abs/2603.13428
Pith/arXiv arXiv 2026
-
[12]
Tenenbaum, and Zoubin Ghahramani
David Duvenaud, James Robert Lloyd, Roger Grosse, Joshua B. Tenenbaum, and Zoubin Ghahramani. Structure discovery in nonparametric regression through compositional kernel search, 2013. URLhttps://arxiv.org/abs/1302.4922
Pith/arXiv arXiv 2013
-
[13]
Dabstep: Data agent benchmark for multi-step reasoning, 2025
Alex Egg, Martin Iglesias Goyanes, Friso Kingma, Andreu Mora, Leandro von Werra, and Thomas Wolf. Dabstep: Data agent benchmark for multi-step reasoning, 2025. URL https: //arxiv.org/abs/2506.23719
arXiv 2025
-
[14]
Yasaman Ensafi, Saman Hassanzadeh Amin, Guoqing Zhang, and Bharat Shah. Time-series fore- casting of seasonal items sales using machine learning – a comparative analysis.International Journal of Information Management Data Insights, 2(1):100058, 2022. ISSN 2667-0968. doi: 10.1016/j.jjimei.2022.100058. URL https://www.sciencedirect.com/science/article/ pii...
-
[15]
Li, Lyle Goodyear, Agam Bhatia, Louise Li, Aditi Bhaskar, Mohammed Zaman, and Noah D
Kanishk Gandhi, Michael Y . Li, Lyle Goodyear, Agam Bhatia, Louise Li, Aditi Bhaskar, Mohammed Zaman, and Noah D. Goodman. Boxinggym: Benchmarking progress in automated experimental design and model discovery, 2025. URL https://arxiv.org/abs/2501.01540
arXiv 2025
-
[16]
Large language models are zero-shot time series forecasters, 2024
Nate Gruver, Marc Finzi, Shikai Qiu, and Andrew Gordon Wilson. Large language models are zero-shot time series forecasters, 2024. URLhttps://arxiv.org/abs/2310.07820
arXiv 2024
-
[17]
Visual programming: Compositional visual reasoning without training, 2022
Tanmay Gupta and Aniruddha Kembhavi. Visual programming: Compositional visual reasoning without training, 2022. URLhttps://arxiv.org/abs/2211.11559
arXiv 2022
-
[18]
Deepeyesv2: Toward agentic multimodal model, 2026
Jack Hong, Chenxiao Zhao, ChengLin Zhu, Weiheng Lu, Guohai Xu, and Xing Yu. Deepeyesv2: Toward agentic multimodal model, 2026. URLhttps://arxiv.org/abs/2511.05271
Pith/arXiv arXiv 2026
-
[19]
Xinhai Hou, Shaoyuan Xu, Manan Biyani, Moyan Li, Jia Liu, Todd C. Hollon, and Bryan Wang. Codev: Code with images for faithful visual reasoning via tool-aware policy optimization, 2026. URLhttps://arxiv.org/abs/2511.19661. 11
arXiv 2026
-
[20]
Visual sketchpad: Sketching as a visual chain of thought for multimodal language models, 2024
Yushi Hu, Weijia Shi, Xingyu Fu, Dan Roth, Mari Ostendorf, Luke Zettlemoyer, Noah A Smith, and Ranjay Krishna. Visual sketchpad: Sketching as a visual chain of thought for multimodal language models, 2024. URLhttps://arxiv.org/abs/2406.09403
arXiv 2024
-
[21]
Toolace-dev: Self-improving tool learning via decomposition and evolution, 2025
Xu Huang, Weiwen Liu, Xingshan Zeng, Yuefeng Huang, Xinlong Hao, Yuxian Wang, Yirong Zeng, Chuhan Wu, Yasheng Wang, Ruiming Tang, and Defu Lian. Toolace-dev: Self-improving tool learning via decomposition and evolution, 2025. URL https://arxiv.org/abs/2505. 07512
2025
-
[22]
Jordan, Song Mei, Jason E Weston, Weijie J
Wenlong Ji, Weizhe Yuan, Emily Getzen, Kyunghyun Cho, Michael I. Jordan, Song Mei, Jason E Weston, Weijie J. Su, Jing Xu, and Linjun Zhang. An overview of large language models for statisticians, 2025. URLhttps://arxiv.org/abs/2502.17814
arXiv 2025
-
[23]
Sebastian Antony Joseph, Syed Murtaza Husain, Stella SR Offner, StÊphanie Juneau, Paul Torrey, Adam S Bolton, Juan P Farias, Niall Gaffney, Greg Durrett, and Junyi Jessy Li. Astro- visbench: A code benchmark for scientific computing and visualization in astronomy.arXiv preprint arXiv:2505.20538, 2025
arXiv 2025
-
[24]
Automated model discovery via multi-modal & multi-step pipeline, 2025
Lee Jung-Mok, Nam Hyeon-Woo, Moon Ye-Bin, Junhyun Nam, and Tae-Hyun Oh. Automated model discovery via multi-modal & multi-step pipeline, 2025. URL https://arxiv.org/abs/ 2509.25946
arXiv 2025
-
[25]
P. Kroupa. On the variation of the initial mass function.Monthly Notices of the Royal Astronomical Society, 322(2):231–246, April 2001. ISSN 1365-2966. doi: 10.1046/j.1365-8711. 2001.04022.x. URLhttp://dx.doi.org/10.1046/j.1365-8711.2001.04022.x
-
[26]
Opensage: Self-programming agent generation engine, 2026
Hongwei Li, Zhun Wang, Qinrun Dai, Yuzhou Nie, Jinjun Peng, Ruitong Liu, Jingyang Zhang, Kaijie Zhu, Jingxuan He, Lun Wang, Yangruibo Ding, Yueqi Chen, Wenbo Guo, and Dawn Song. Opensage: Self-programming agent generation engine, 2026. URL https: //arxiv.org/abs/2602.16891
arXiv 2026
-
[27]
Michael Y . Li, Emily B. Fox, and Noah D. Goodman. Automated statistical model discovery with language models, 2024. URLhttps://arxiv.org/abs/2402.17879
arXiv 2024
-
[28]
Michael Y . Li, Vivek Vajipey, Noah D. Goodman, and Emily B. Fox. Critical: Critic automation with language models, 2024. URLhttps://arxiv.org/abs/2411.06590
arXiv 2024
-
[29]
Tenenbaum, and Zoubin Ghahramani
James Robert Lloyd, David Duvenaud, Roger Grosse, Joshua B. Tenenbaum, and Zoubin Ghahramani. Automatic construction and natural-language description of nonparametric regres- sion models, 2014. URLhttps://arxiv.org/abs/1402.4304
Pith/arXiv arXiv 2014
-
[30]
Beyond static tools: Test-time tool evolution for scientific reasoning, 2026
Jiaxuan Lu, Ziyu Kong, Yemin Wang, Rong Fu, Haiyuan Wan, Cheng Yang, Wenjie Lou, Haoran Sun, Lilong Wang, Yankai Jiang, Xiaosong Wang, Xiao Sun, and Dongzhan Zhou. Beyond static tools: Test-time tool evolution for scientific reasoning, 2026. URL https: //arxiv.org/abs/2601.07641
arXiv 2026
-
[31]
Ross Maller, Sidney Resnick, Soudabeh Shemehsavar, and Muzhi Zhao. Mixture cure model methodology in survival analysis: Some recent results for the one-sample case.Statistics Surveys, 18, 01 2024. doi: 10.1214/24-SS147
-
[32]
Vesta: In depth
NASA Science. Vesta: In depth. https://science.nasa.gov/solar-system/asteroids/ 4-vesta/, . Accessed: May 2, 2026
2026
-
[33]
Dawn mission overview
NASA Science. Dawn mission overview. https://science.nasa.gov/mission/dawn/, . Accessed: May 2, 2026
2026
-
[34]
Harnessing vision models for time series analysis: A survey, 2025
Jingchao Ni, Ziming Zhao, ChengAo Shen, Hanghang Tong, Dongjin Song, Wei Cheng, Dongsheng Luo, and Haifeng Chen. Harnessing vision models for time series analysis: A survey, 2025. URLhttps://arxiv.org/abs/2502.08869
arXiv 2025
-
[35]
S. S. R. Offner, P. C. Clark, P. Hennebelle, N. Bastian, M. R. Bate, P. F. Hopkins, E. Moreaux, and A. P. Whitworth.The Origin and Universality of the Stellar Initial Mass Function. University of Arizona Press, 2014. ISBN 9780816531240. doi: 10.2458/azu_uapress_9780816531240-ch003. URLhttp://dx.doi.org/10.2458/azu_uapress_9780816531240-ch003. 12
-
[36]
Fung, Yujia Qin, Zhiyuan Liu, and Heng Ji
Cheng Qian, Chi Han, Yi R. Fung, Yujia Qin, Zhiyuan Liu, and Heng Ji. Creator: Tool creation for disentangling abstract and concrete reasoning of large language models, 2024. URL https://arxiv.org/abs/2305.14318
arXiv 2024
-
[37]
James Requeima, John Bronskill, Dami Choi, Richard E. Turner, and David Duvenaud. Llm processes: Numerical predictive distributions conditioned on natural language, 2024. URL https://arxiv.org/abs/2405.12856
arXiv 2024
-
[38]
Forgotten polygons: Multimodal large language models are shape-blind
William Rudman, Michal Golovanevsky, Amir Bar, Vedant Palit, Yann LeCun, Carsten Eickhoff, and Ritambhara Singh. Forgotten polygons: Multimodal large language models are shape-blind. In Wanxiang Che, Joyce Nabende, Ekaterina Shutova, and Mohammad Taher Pilehvar, editors, Findings of the Association for Computational Linguistics: ACL 2025, pages 11983–1199...
-
[39]
ApJ , year = 1955, month = jan, volume =
Edwin E. Salpeter. The Luminosity Function and Stellar Evolution.apj, 121:161, January 1955. doi: 10.1086/145971
-
[40]
Towards execution-grounded automated ai research, 2026
Chenglei Si, Zitong Yang, Yejin Choi, Emmanuel Candès, Diyi Yang, and Tatsunori Hashimoto. Towards execution-grounded automated ai research, 2026. URL https://arxiv.org/abs/ 2601.14525
arXiv 2026
-
[41]
Restgpt: Connecting large language models with real-world restful apis, 2023
Yifan Song, Weimin Xiong, Dawei Zhu, Wenhao Wu, Han Qian, Mingbo Song, Hailiang Huang, Cheng Li, Ke Wang, Rong Yao, Ye Tian, and Sujian Li. Restgpt: Connecting large language models with real-world restful apis, 2023. URLhttps://arxiv.org/abs/2306.06624
arXiv 2023
-
[42]
Maojun Sun, Ruijian Han, Binyan Jiang, Houduo Qi, Defeng Sun, Yancheng Yuan, and Jian Huang. A survey on large language model-based agents for statistics and data science.The American Statistician, page 1–14, October 2025. ISSN 1537-2731. doi: 10.1080/00031305. 2025.2561140. URLhttp://dx.doi.org/10.1080/00031305.2025.2561140
-
[43]
Seagent: Self-evolving computer use agent with autonomous learning from experience,
Zeyi Sun, Ziyu Liu, Yuhang Zang, Yuhang Cao, Xiaoyi Dong, Tong Wu, Dahua Lin, and Jiaqi Wang. Seagent: Self-evolving computer use agent with autonomous learning from experience,
-
[44]
URLhttps://arxiv.org/abs/2508.04700
-
[45]
Vipergpt: Visual inference via python execution for reasoning, 2023
Dídac Surís, Sachit Menon, and Carl V ondrick. Vipergpt: Visual inference via python execution for reasoning, 2023. URLhttps://arxiv.org/abs/2303.08128
Pith/arXiv arXiv 2023
-
[46]
Eyes wide shut? exploring the visual shortcomings of multimodal llms, 2024
Shengbang Tong, Zhuang Liu, Yuexiang Zhai, Yi Ma, Yann LeCun, and Saining Xie. Eyes wide shut? exploring the visual shortcomings of multimodal llms, 2024. URL https://arxiv. org/abs/2401.06209
arXiv 2024
-
[47]
V oyager: An open-ended embodied agent with large language models,
Guanzhi Wang, Yuqi Xie, Yunfan Jiang, Ajay Mandlekar, Chaowei Xiao, Yuke Zhu, Linxi Fan, and Anima Anandkumar. V oyager: An open-ended embodied agent with large language models,
-
[48]
URLhttps://arxiv.org/abs/2305.16291
-
[49]
Transformers in time series: A survey, 2023
Qingsong Wen, Tian Zhou, Chaoli Zhang, Weiqi Chen, Ziqing Ma, Junchi Yan, and Liang Sun. Transformers in time series: A survey, 2023. URLhttps://arxiv.org/abs/2202.07125
arXiv 2023
-
[50]
Visual chatgpt: Talking, drawing and editing with visual foundation models, 2023
Chenfei Wu, Shengming Yin, Weizhen Qi, Xiaodong Wang, Zecheng Tang, and Nan Duan. Visual chatgpt: Talking, drawing and editing with visual foundation models, 2023. URL https://arxiv.org/abs/2303.04671
Pith/arXiv arXiv 2023
-
[51]
Llm agents making agent tools, 2025
Georg Wölflein, Dyke Ferber, Daniel Truhn, Ognjen Arandjelovi´c, and Jakob Nikolas Kather. Llm agents making agent tools, 2025. URLhttps://arxiv.org/abs/2502.11705
arXiv 2025
-
[52]
Act wisely: Cultivating meta-cognitive tool use in agentic multimodal models, 2026
Shilin Yan, Jintao Tong, Hongwei Xue, Xiaojun Tang, Yangyang Wang, Kunyu Shi, Guannan Zhang, Ruixuan Li, and Yixiong Zou. Act wisely: Cultivating meta-cognitive tool use in agentic multimodal models, 2026. URLhttps://arxiv.org/abs/2604.08545
Pith/arXiv arXiv 2026
-
[53]
Vismem: Latent vision memory unlocks potential of vision-language models, 2026
Xinlei Yu, Chengming Xu, Guibin Zhang, Zhangquan Chen, Yudong Zhang, Yongbo He, Peng-Tao Jiang, Jiangning Zhang, Xiaobin Hu, and Shuicheng Yan. Vismem: Latent vision memory unlocks potential of vision-language models, 2026. URL https://arxiv.org/abs/ 2511.11007. 13
arXiv 2026
-
[54]
A transformer-based framework for multivariate time series representation learning,
George Zerveas, Srideepika Jayaraman, Dhaval Patel, Anuradha Bhamidipaty, and Carsten Eickhoff. A transformer-based framework for multivariate time series representation learning,
-
[55]
URLhttps://arxiv.org/abs/2010.02803
arXiv 2010
-
[56]
Yifan Zhang, Liang Hu, Haofeng Sun, Peiyu Wang, Yichen Wei, Shukang Yin, Jiangbo Pei, Wei Shen, Peng Xia, Yi Peng, Tianyidan Xie, Eric Li, Yang Liu, Xuchen Song, and Yahui Zhou. Skywork-r1v4: Toward agentic multimodal intelligence through interleaved thinking with images and deepresearch, 2025. URLhttps://arxiv.org/abs/2512.02395
arXiv 2025
-
[57]
Vipact: Visual-perception enhancement via specialized vlm agent collaboration and tool-use, 2025
Zhehao Zhang, Ryan Rossi, Tong Yu, Franck Dernoncourt, Ruiyi Zhang, Jiuxiang Gu, Sungchul Kim, Xiang Chen, Zichao Wang, and Nedim Lipka. Vipact: Visual-perception enhancement via specialized vlm agent collaboration and tool-use, 2025. URL https://arxiv.org/abs/2410. 16400
2025
-
[58]
Pyvision: Agentic vision with dynamic tooling, 2025
Shitian Zhao, Haoquan Zhang, Shaoheng Lin, Ming Li, Qilong Wu, Kaipeng Zhang, and Chen Wei. Pyvision: Agentic vision with dynamic tooling, 2025. URL https://arxiv.org/abs/ 2507.07998
arXiv 2025
-
[59]
Time-vlm: Exploring multimodal vision-language models for augmented time series forecasting, 2025
Siru Zhong, Weilin Ruan, Ming Jin, Huan Li, Qingsong Wen, and Yuxuan Liang. Time-vlm: Exploring multimodal vision-language models for augmented time series forecasting, 2025. URLhttps://arxiv.org/abs/2502.04395
arXiv 2025
-
[60]
Qiji Zhou, Ruochen Zhou, Zike Hu, Panzhong Lu, Siyang Gao, and Yue Zhang. Image-of- thought prompting for visual reasoning refinement in multimodal large language models, 2024. URLhttps://arxiv.org/abs/2405.13872
arXiv 2024
-
[61]
Reinforced visual perception with tools, 2025
Zetong Zhou, Dongping Chen, Zixian Ma, Zhihan Hu, Mingyang Fu, Sinan Wang, Yao Wan, Zhou Zhao, and Ranjay Krishna. Reinforced visual perception with tools, 2025. URL https: //arxiv.org/abs/2509.01656
arXiv 2025
-
[62]
Yizhang Zhu, Shiyin Du, Boyan Li, Yuyu Luo, and Nan Tang. Are large language models good statisticians?, 2024. URLhttps://arxiv.org/abs/2406.07815. 14 AVESTADetails Algorithm 2Visual Exploration Agents (Detailed) Require: Data D, iteration limit N, proposals per iteration p, metric R, registry E (initial state: generate_new_toolonly) Ensure:M best, θbest ...
arXiv 2024
-
[63]
CalculateMoments: Computes the mean, variance, skewness, and excess kurtosis of the input data. Returns a JSON artifact with a plain-language interpretation to guide distribution selection, including symmetry hints (e.g., right-skewed data suggests Gamma, Lognormal, or Weibull families) and tail-weight hints (e.g., leptokurtic data suggests Student-t, Cau...
-
[64]
Handles both single distributions and mixtures by summing component PDFs weighted by their mixture weights
Histogram: Plots a histogram of the empirical data with the fitted distribution’s probability density function (PDF) overlaid. Handles both single distributions and mixtures by summing component PDFs weighted by their mixture weights. Provides an immediate visual check of whether the model captures the overall shape, modality, and spread of the data. When...
-
[65]
Produces both a segmentation image with a total mixture overlay and a JSON summary of per-component statistics with distribution family hints
SegmentDistributionsAndCalculateMoments: Segments the data into a specified number of mixture components using a Gaussian Mixture Model (GMM), then computes per- component moments (mean, variance, skewness, kurtosis). Produces both a segmentation image with a total mixture overlay and a JSON summary of per-component statistics with distribution family hin...
-
[66]
QQPlot: Generates a Quantile-Quantile (Q-Q) plot comparing empirical data quantiles to theoretical quantiles from the currently fitted distribution. Linearity indicates a good fit; S-shaped curvature signals tail mismatch; one-sided curvature suggests skew; and sharp tail departures may indicate outliers or heavier tails than the model captures
-
[67]
A straight line on the log-log plot indicates power-law or Pareto-type heavy tails, while a straight line on the semi-log plot indicates exponential decay
PlotTailsTransform: Produces log-log and semi-log complementary CDF (CCDF) plots to diagnose tail behavior. A straight line on the log-log plot indicates power-law or Pareto-type heavy tails, while a straight line on the semi-log plot indicates exponential decay. Useful for distinguishing heavy-tailed from light-tailed distributions when the histogram alo...
-
[68]
A consistent horizontal shift indicates a mis-specified location parameter; a slope mismatch indicates a scale misfit; and systematic tail deviations suggest distributional misfit
ProbabilityPlot: Generates a probability plot comparing the empirical CDF to the fitted distribution’s theoretical CDF. A consistent horizontal shift indicates a mis-specified location parameter; a slope mismatch indicates a scale misfit; and systematic tail deviations suggest distributional misfit. Also reports a Kolmogorov-Smirnov (KS) statistic for qua...
-
[69]
Returns a plain-text summary of the detected period
GetDominantPeriod: Extracts the dominant period from the time series using Fast Fourier Transform (FFT) analysis. Returns a plain-text summary of the detected period. Most useful when Periodic or PeriodicComplex kernels are under consideration and the period has not yet been numerically determined. The result is available in the subsequent feedback iteration
-
[70]
Essential for visually assessing whether the model adequately captures the underlying trend and seasonality while appropriately discounting noise
FitVsActuals: Produces a visual overlay of the Gaussian Process (GP) fit on the raw time series data. Essential for visually assessing whether the model adequately captures the underlying trend and seasonality while appropriately discounting noise. Falls back to a raw series plot if no model has been fitted yet
-
[71]
Used to assess whether residuals resemble white noise; a broadly normal residual distribution is indicative of a well-specified model
FitVsActualsWithResidualsDistribution: Generates a combined plot showing the GP fit overlaid on the observed time series alongside the distribution of residuals. Used to assess whether residuals resemble white noise; a broadly normal residual distribution is indicative of a well-specified model. Falls back to a raw series plot if no model has been fitted yet
-
[72]
Significant spikes above the confidence band indicate that the model is failing to capture some latent structure in the data
ResidualsAutoCorrelationPlot: Produces an Autocorrelation Function (ACF) plot of the model residuals to check for temporal independence. Significant spikes above the confidence band indicate that the model is failing to capture some latent structure in the data. Falls back to a raw series plot if no model has been fitted yet. 5.ResidualsAutoCorrelationSco...
-
[73]
Each family encodes different assumptions
diagnostic_fit_checks:Naming a concrete model family (gaussian, gamma, lognormal, Pareto, Weibull, etc.) and trying it on the data. Each family encodes different assumptions. These tools allow for typically allow for a visual comparison of multiple model families at once. Occasionally, we observe some single use model fitting
-
[74]
Beyond simply fitting and visualizing models, AIC and BIC provide quantitative fit metrics
information_criteria:Numerical scores that rank competing fits while penalizing model complexity. Beyond simply fitting and visualizing models, AIC and BIC provide quantitative fit metrics
-
[75]
) that maximize the probability of observing the data under the chosen family
mle_fitting:Maximum likelihood estimation: choosing the parameter values ( µ, σ, shape, scale, . . . ) that maximize the probability of observing the data under the chosen family. This is the how you actually of fit models, distinct from what models we want to test in diagnostic_fit_checks. MLE gives you the canonical “best” parameters under a given famil...
-
[76]
extreme regime
mean_excess_plotPlots the conditional expectation E[X−u|X > u] against threshold u. For the Generalized Pareto distribution this function is linear in u, so a straight line in the upper tail signals a GPD-like tail and tells you where the “extreme regime” begins. This is a tail-diagnostic that complementsdiagnostic_fit_checks. These test help it VESTAdeci...
-
[77]
how heavy
hill_estimatorEstimates the tail index α of a heavy-tailed distribution from the largest k order statistics, giving a concrete number for “how heavy” the tail is. A Hill plot ( ˆαvs. k) lets you check stability and pick a sensible threshold. This refines a Pareto/power-law fit by pinning down its single most important parameter, and serves as a sanity che...
-
[78]
If Shapiro-Wilk rejects normality strongly, that rules out the normal family in diagnostic_fit_checks
shapiro_wilkA formal hypothesis test for whether data come from a normal distribu- tion. If Shapiro-Wilk rejects normality strongly, that rules out the normal family in diagnostic_fit_checks
-
[79]
F.2 Time Series
box_coxA parametric family of power transforms y= (x λ −1)/λ that searches for the λ making the transformed data closest to normal and can be useful when working with exotic, heavy-tailed distributions. F.2 Time Series
-
[80]
This is typically 22 Table 11: Analysis of functions in VESTA-generated tools that are not contained in the expert toolkit for Distribution Fitting
density_visualization:Overlays a histogram with a kernel density estimate (KDE) to give a non-parametric picture of the marginal distribution of a time series. This is typically 22 Table 11: Analysis of functions in VESTA-generated tools that are not contained in the expert toolkit for Distribution Fitting. Function Easy Hard Astro All Diagnostic Fit Chec...
discussion (0)
Sign in with ORCID, Apple, or X to comment. Anyone can read and Pith papers without signing in.