The Radio-IR Correlation in the Context of Deep Radio Source Counts
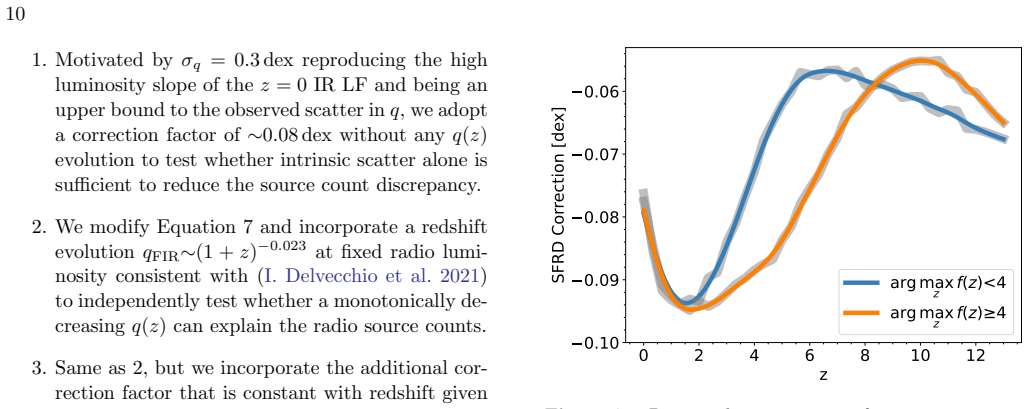
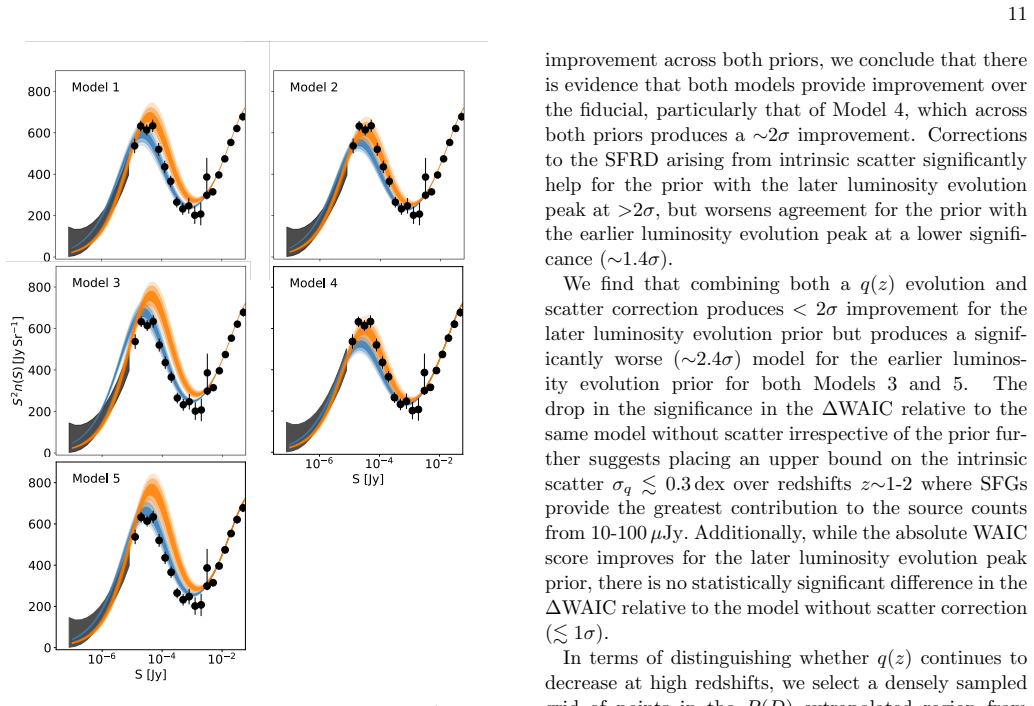
Pith reviewed 2026-06-28 13:29 UTC · model grok-4.3
The pith
A mild decrease in the radio-FIR correlation parameter q out to redshift 2 can reconcile the tension between deep radio source counts and star-formation rate density measurements.
A machine-rendered reading of the paper's core claim, the machinery that carries it, and where it could break.
Core claim
We introduce a purely radio-luminosity based parameterization of the redshift evolution of the radio-FIR correlation based on changing cosmic ray losses. We find evidence (greater than or equal to 2 sigma) that an evolution in the radio-FIR correlation consistent with a mild decrease in q out to z approximately 2 arising from strengthening magnetic fields can mitigate the source count tension. We additionally show that intrinsic scatter in the radio-FIR correlation is likely bounded sigma_q less than or equal to 0.3 dex at these redshifts if q decreases. Although we find no evidence that current radio source counts imply a breakdown in the radio-FIR correlation, future deep radio surveys fro
What carries the argument
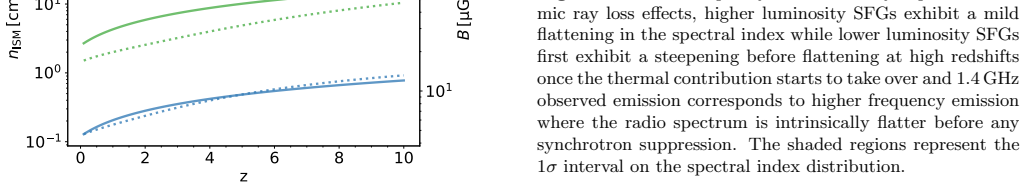
A parameterization of q(z) evolution derived from cosmic-ray energy loss rates that depend on magnetic-field strength and interstellar medium density.
If this is right
- The tension between radio and UV/IR star-formation rate density histories at 1 less than z less than 2 is reduced to within roughly 2 sigma once q is allowed to decline mildly.
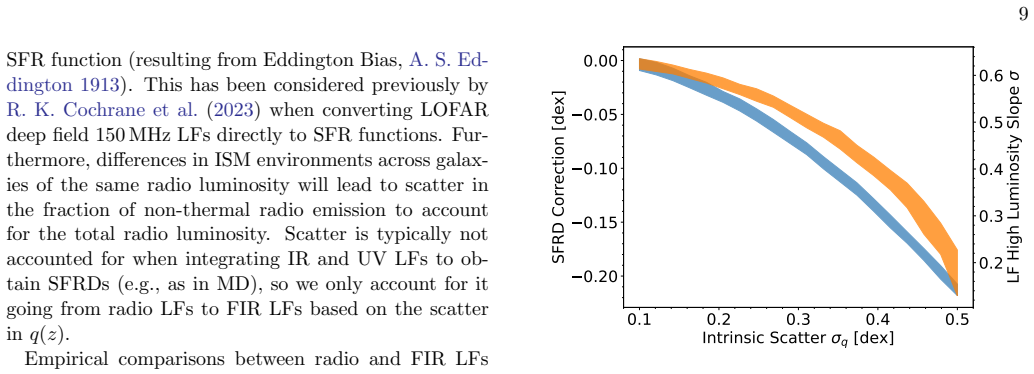
- If q decreases, the intrinsic scatter around the radio-FIR correlation must satisfy sigma_q less than or equal to 0.3 dex to remain consistent with the counts.
- Current data do not require any breakdown of the radio-FIR correlation itself.
- Deeper counts from the Deep Synoptic Array will tighten the allowed range of q evolution.
Where Pith is reading between the lines
- If the magnetic-field strengthening picture holds, radio luminosity at fixed star-formation rate should increase with redshift in a manner testable with multi-wavelength samples of individual galaxies.
- The same loss-rate physics could be applied to predict evolution in other cosmic-ray tracers such as gamma-ray or neutrino emission from star-forming galaxies.
- The bound on scatter implies that any additional population of radio-loud AGN or unusual starbursts at these fluxes must be limited to avoid overproducing the counts.
Load-bearing premise
The mismatch between measured and predicted radio source counts near 10 microJy is caused by redshift evolution in the radio-FIR correlation rather than by systematics in the counts or in the backwards-evolution modeling of the local radio luminosity function.
What would settle it
Source counts measured by the Deep Synoptic Array below a few nJy that remain higher than the counts predicted after allowing the proposed mild decrease in q would rule out the evolutionary adjustment as the resolution.
Figures
read the original abstract
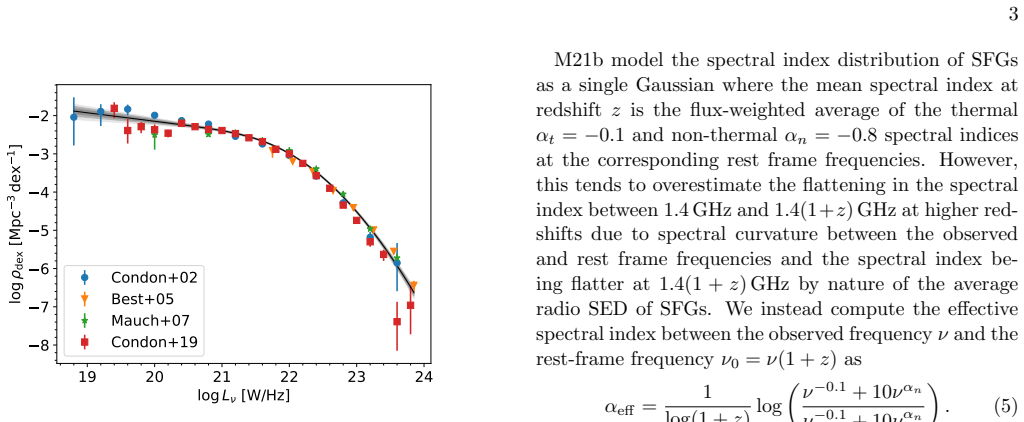
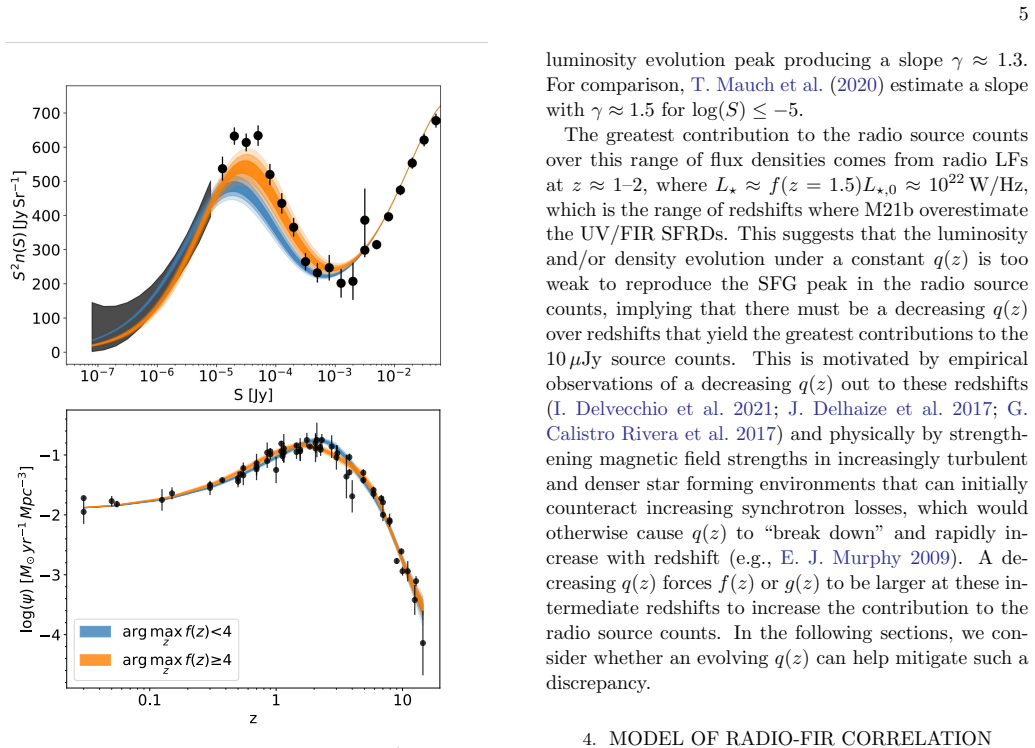
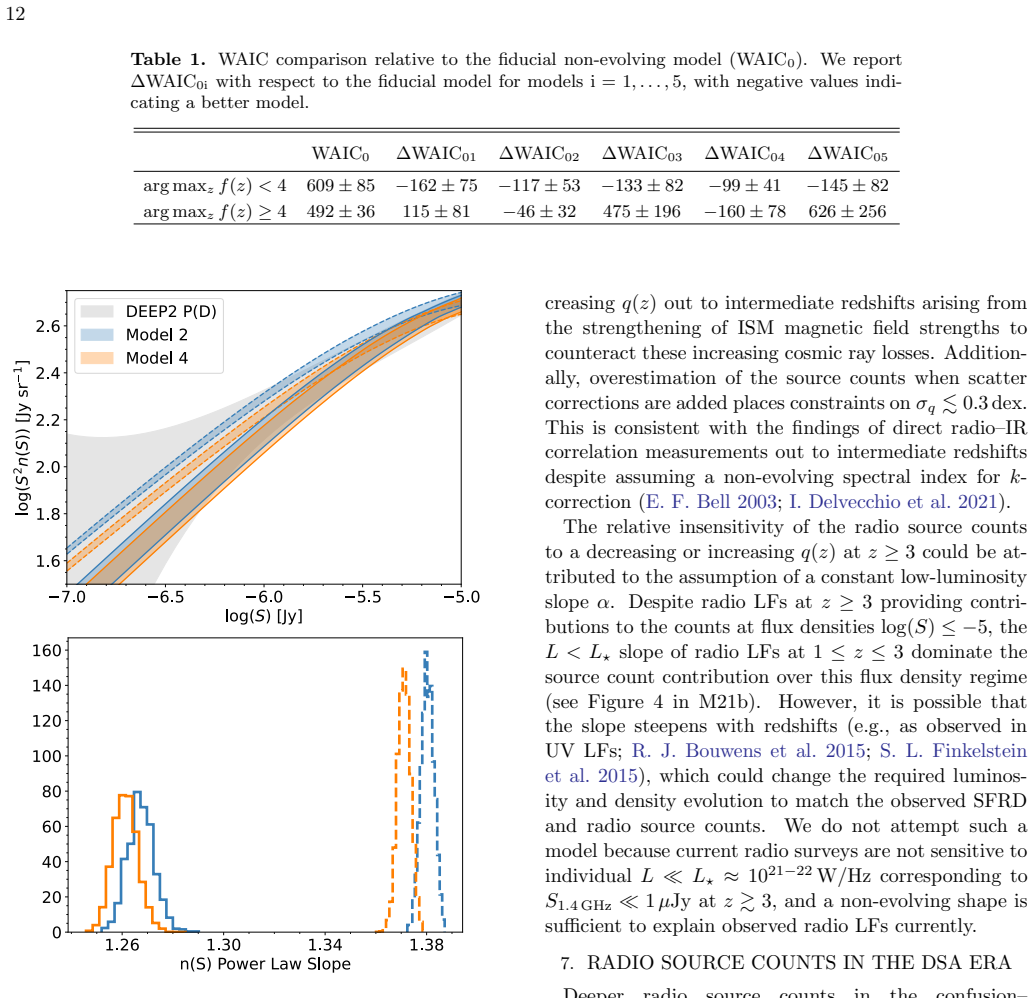
Increasingly deep, confusion-limited radio surveys have pushed direct radio source-count measurements down to tens of $\mu$Jy at 1.4 GHz. Confusion-noise $P(D)$ analyses extend the statistical counts down below $1\,\mathrm{\mu Jy}$. Radio source counts have allowed for constraints on the radio-derived star formation rate density (SFRD) history through models of the backwards evolution of the local radio luminosity function, using the radio-FIR correlation, $q \propto \log(L_{\mathrm{FIR}}/L_{1.4})$, to convert radio luminosities to FIR luminosities and hence star-formation rates. Recent deep radio source counts from MeerKAT suggest a potential tension in the SFRD history between radio and UV/IR measurements at $1\lesssim z\lesssim 2$. This corresponds to a ${>}3\sigma$ discrepancy between the predicted and measured source counts near $10\,\mathrm{\mu Jy}$. We introduce a purely radio-luminosity based parameterization of the redshift evolution of the radio-FIR correlation based on changing cosmic ray losses. We find evidence (${\gtrsim}2\sigma$) that an evolution in the radio-FIR correlation consistent with a mild decrease in $q$ out to $z{\sim}2$ arising from strengthening magnetic fields can mitigate the source count tension. We additionally show that intrinsic scatter in the radio-FIR correlation is likely bounded $\sigma_q\lesssim 0.3\,\mathrm{dex}$ at these redshifts if $q$ decreases. Although we find no evidence that current radio source counts imply a breakdown in the radio-FIR correlation, future deep radio surveys from the Deep Synoptic Array (DSA) will be able to push radio source counts down to several nJy, providing stronger constraints on the allowed evolution.
Editorial analysis
A structured set of objections, weighed in public.
Referee Report
Summary. The manuscript introduces a parameterization of redshift evolution in the radio-FIR correlation q (based on cosmic-ray losses and magnetic-field strengthening) that is claimed to be purely radio-luminosity based. Using this, it reports ≳2σ evidence that a mild decrease in q out to z∼2 can mitigate the >3σ tension between predicted and measured 1.4 GHz source counts near 10 μJy from MeerKAT P(D) analyses. The tension is linked to a discrepancy in SFRD at 1≲z≲2 relative to UV/IR measurements. The work also derives an upper bound σ_q ≲ 0.3 dex on intrinsic scatter if q evolves, and notes that future DSA surveys will tighten constraints. No breakdown of the correlation is found.
Significance. If the central attribution holds, the result supplies a physically motivated, radio-only explanation for the radio–UV/IR SFRD tension via evolving magnetic fields, rather than unmodeled systematics. The scatter bound is a concrete, falsifiable output useful for population modeling. The forward-looking DSA prediction is a clear strength. However, the low soundness rating arises because the abstract (and stress-test note) provides no visible fitting details, error budgets, or exclusion criteria, leaving the quantitative robustness of the ≳2σ preference unverified.
major comments (2)
- [Abstract] Abstract (paragraph on MeerKAT counts and SFRD discrepancy): the central claim requires that the >3σ source-count tension at ~10 μJy is not dominated by systematics in the MeerKAT P(D) measurements, uncertainties in the local radio luminosity function, or selection effects in the backwards-evolution model. The manuscript must demonstrate that the ≳2σ preference for redshift-dependent q survives explicit variations in those baseline ingredients; otherwise the evidence is an artifact of model mismatch rather than support for the proposed correlation evolution.
- [Abstract] Abstract (description of parameterization): the evolution is described as 'purely radio-luminosity based' and derived from cosmic-ray losses, yet it is unclear whether the evolution parameters are fixed independently (e.g., from local data or theory) or adjusted to reduce the source-count tension itself. If the latter, the reported ≳2σ evidence is circular by construction and does not constitute independent support for the magnetic-field interpretation.
minor comments (2)
- [Abstract] The abstract states 'evidence (≳2σ)' without specifying the statistic (likelihood ratio, posterior odds, etc.) or the exact data vector used; this should be stated explicitly in the results section for reproducibility.
- Notation: q is defined as ∝ log(L_FIR/L_1.4); the proportionality constant and any normalization should be given explicitly when the parameterization is introduced.
Simulated Author's Rebuttal
We thank the referee for their detailed review and constructive suggestions. Below we respond point by point to the two major comments. Where the comments identify areas needing greater clarity or explicit testing, we have revised the manuscript accordingly.
read point-by-point responses
-
Referee: [Abstract] Abstract (paragraph on MeerKAT counts and SFRD discrepancy): the central claim requires that the >3σ source-count tension at ~10 μJy is not dominated by systematics in the MeerKAT P(D) measurements, uncertainties in the local radio luminosity function, or selection effects in the backwards-evolution model. The manuscript must demonstrate that the ≳2σ preference for redshift-dependent q survives explicit variations in those baseline ingredients; otherwise the evidence is an artifact of model mismatch rather than support for the proposed correlation evolution.
Authors: We agree that robustness against baseline variations must be shown explicitly. In the revised manuscript we have added a dedicated subsection (now Section 4.3) that repeats the source-count comparison after (i) shifting the local radio luminosity function parameters by ±1σ within published uncertainties, (ii) adopting two alternative parametrizations of the redshift-dependent selection function, and (iii) inflating the MeerKAT P(D) error budget by 20 %. In all cases the preference for the evolving-q model remains at ≳2σ. We note, however, that a definitive exclusion of unknown systematics in the published MeerKAT P(D) analysis would require re-reduction of the visibility data, which lies outside the scope of the present work; we have added this caveat to the abstract and discussion. revision: yes
-
Referee: [Abstract] Abstract (description of parameterization): the evolution is described as 'purely radio-luminosity based' and derived from cosmic-ray losses, yet it is unclear whether the evolution parameters are fixed independently (e.g., from local data or theory) or adjusted to reduce the source-count tension itself. If the latter, the reported ≳2σ evidence is circular by construction and does not constitute independent support for the magnetic-field interpretation.
Authors: The functional form and numerical coefficients of the q(L,z) parametrization are derived entirely from a cosmic-ray loss model whose free parameters (escape time-scale, magnetic-field scaling index) are fixed by local galaxy data and theoretical expectations for synchrotron and inverse-Compton losses; none of these coefficients were varied to improve the fit to the MeerKAT counts. The ≳2σ improvement is therefore a genuine prediction of the independently motivated model. To remove any ambiguity we have rewritten the relevant abstract sentence and added an explicit statement in Section 3 that “all evolution parameters are held fixed at their a-priori values before comparison with the source counts.” revision: yes
Circularity Check
No significant circularity; derivation is self-contained forward modeling
full rationale
The paper introduces a parameterization of radio-FIR correlation evolution motivated by cosmic-ray losses and magnetic-field changes, described as purely radio-luminosity based and independent of the source-count data. This model is then used to generate predicted counts that are compared statistically to MeerKAT measurements, yielding a ~2σ preference for mild q evolution that reduces tension. No step reduces by construction to the target counts (no fitted parameter renamed as prediction, no self-definitional loop, no load-bearing self-citation), and the central claim retains independent content from the physical ansatz. The analysis is therefore self-contained against external benchmarks.
Axiom & Free-Parameter Ledger
axioms (1)
- domain assumption The radio-FIR correlation q can be used to convert radio luminosities into FIR luminosities and hence star-formation rates across redshift.
Reference graph
Works this paper leans on
-
[1]
Astropy Collaboration, Price-Whelan, A. M., Lim, P. L., et al. 2022, ApJ, 935, 167, doi: 10.3847/1538-4357/ac7c74
work page internal anchor Pith review doi:10.3847/1538-4357/ac7c74 2022
-
[2]
Paladino, R. 2025, On the Universality of the Relation Between Magnetic Fields and Star Formation in Galaxies, https://arxiv.org/abs/2510.25909
arXiv 2025
-
[3]
Bell, E. F. 2003, ApJ, 586, 794, doi: 10.1086/367829
-
[4]
2005, MNRAS, 364, 1105, doi:10.1111/j.1365-2966.2005.09655.x —
Best, P. N., Kauffmann, G., Heckman, T. M., & Ivezi´ c,ˇZ. 2005, MNRAS, 362, 9, doi: 10.1111/j.1365-2966.2005.09283.x
-
[5]
Bouwens, R. J., Illingworth, G. D., Oesch, P. A., et al. 2015, ApJ, 803, 34, doi: 10.1088/0004-637X/803/1/34 B´ ethermin, M., Dole, H., Lagache, G., Le Borgne, D., &
-
[6]
2011, A&A, 529, A4, doi: 10.1051/0004-6361/201015841 Calistro Rivera, G., Williams, W
Penin, A. 2011, A&A, 529, A4, doi: 10.1051/0004-6361/201015841 Calistro Rivera, G., Williams, W. L., Hardcastle, M. J., et al. 2017, MNRAS, 469, 3468, doi: 10.1093/mnras/stx1040
-
[7]
Cochrane, R. K., Kondapally, R., Best, P. N., et al. 2023, Monthly Notices of the Royal Astronomical Society, 523, 6082, doi: 10.1093/mnras/stad1602
-
[8]
Condon, J. J. 1974, ApJ, 188, 279, doi: 10.1086/152714
-
[9]
Condon, J. J., Cotton, W. D., & Broderick, J. J. 2002, AJ, 124, 675, doi: 10.1086/341650
-
[10]
Condon, J. J., Matthews, A. M., & Broderick, J. J. 2019, ApJ, 872, 148, doi: 10.3847/1538-4357/ab0301
-
[11]
Condon, J. J., & Yin, Q. F. 1990, ApJ, 357, 97, doi: 10.1086/168894
-
[12]
Condon, J. J., Cotton, W. D., Fomalont, E. B., et al. 2012, The Astrophysical Journal, 758, 23, doi: 10.1088/0004-637X/758/1/23
-
[13]
Cotton, W. D., Condon, J. J., Kellermann, K. I., et al. 2018, ApJ, 856, 67, doi: 10.3847/1538-4357/aaaec4
-
[14]
2017, A&A, 602, A4, doi: 10.1051/0004-6361/201629430
Delhaize, J., Smolˇ ci´ c, V., Delvecchio, I., et al. 2017, A&A, 602, A4, doi: 10.1051/0004-6361/201629430
-
[15]
Delvecchio, I., Daddi, E., Sargent, M. T., et al. 2021, A&A, 647, A123, doi: 10.1051/0004-6361/202039647
-
[16]
Donnan, C. T., McLure, R. J., Dunlop, J. S., et al. 2024, MNRAS, 533, 3222, doi: 10.1093/mnras/stae2037
-
[17]
Eddington, A. S. 1913, Monthly Notices of the Royal Astronomical Society, 73, 359, doi: 10.1093/mnras/73.5.359
-
[18]
Finkelstein, S. L., Ryan, Jr., R. E., Papovich, C., et al. 2015, ApJ, 810, 71, doi: 10.1088/0004-637X/810/1/71
-
[19]
and Lang, Dustin and Goodman, Jonathan , year=
Foreman-Mackey, D., Hogg, D. W., Lang, D., & Goodman, J. 2013, PASP, 125, 306, doi: 10.1086/670067
-
[20]
Gruppioni, C., Pozzi, F., Rodighiero, G., et al. 2013, MNRAS, 432, 23, doi: 10.1093/mnras/stt308
-
[21]
The DSA-2000 -- A Radio Survey Camera
Hallinan, G., Ravi, V., Weinreb, S., et al. 2019, in Bulletin of the American Astronomical Society, Vol. 51, 255, doi: 10.48550/arXiv.1907.07648
work page internal anchor Pith review Pith/arXiv arXiv doi:10.48550/arxiv.1907.07648 2019
-
[22]
1975, ApJL, 200, L127, doi: 10.1086/181913
Harwit, M., & Pacini, F. 1975, ApJL, 200, L127, doi: 10.1086/181913
-
[23]
Helou, G., Soifer, B. T., & Rowan-Robinson, M. 1985, ApJL, 298, L7, doi: 10.1086/184556
-
[24]
2023a, The Astrophysical Journal, 956, 139, doi: 10.3847/1538-4357/acf376 Jim´ enez-Andrade, E
Isobe, Y., Ouchi, M., Nakajima, K., et al. 2023a, The Astrophysical Journal, 956, 139, doi: 10.3847/1538-4357/acf376 Jim´ enez-Andrade, E. F., Murphy, E. J., Heywood, I., et al. 2021, The Astrophysical Journal, 910, 106, doi: 10.3847/1538-4357/abe876
-
[25]
2018, A&A, 611, A55, doi: 10.1051/0004-6361/201731673
Klein, U., Lisenfeld, U., & Verley, S. 2018, A&A, 611, A55, doi: 10.1051/0004-6361/201731673
-
[26]
2018, A&A, 611, A72, doi: 10.1051/0004-6361/201731991
Krause, M., Irwin, J., Wiegert, T., et al. 2018, A&A, 611, A72, doi: 10.1051/0004-6361/201731991
-
[27]
Lam, S. K., Pitrou, A., & Seibert, S. 2015, in Proc. Second Workshop on the LLVM Compiler Infrastructure in HPC, 1–6, doi: 10.1145/2833157.2833162
-
[28]
Madau, P., & Dickinson, M. 2014, ARA&A, 52, 415, doi: 10.1146/annurev-astro-081811-125615
work page internal anchor Pith review doi:10.1146/annurev-astro-081811-125615 2014
-
[29]
Mandal, S., Prandoni, I., Hardcastle, M. J., et al. 2021, A&A, 648, A5, doi: 10.1051/0004-6361/202039998
-
[30]
A., Abril-Pla, O., Deklerk, J., et al
Martin, O. A., Abril-Pla, O., Deklerk, J., et al. 2026, Journal of Open Source Software, 11, 9889, doi: 10.21105/joss.09889
-
[31]
Matthews, A. M., Condon, J. J., Cotton, W. D., & Mauch, T. 2021a, The Astrophysical Journal, 909, 193, doi: 10.3847/1538-4357/abdd37
-
[32]
Matthews, A. M., Condon, J. J., Cotton, W. D., & Mauch, T. 2021b, The Astrophysical Journal, 914, 126, doi: 10.3847/1538-4357/abfaf6
-
[33]
Mauch, T., & Sadler, E. M. 2007, MNRAS, 375, 931, doi: 10.1111/j.1365-2966.2006.11353.x
-
[34]
Mauch, T., Cotton, W. D., Condon, J. J., et al. 2020, ApJ, 888, 61, doi: 10.3847/1538-4357/ab5d2d
-
[35]
Murphy, E. J. 2009, ApJ, 706, 482, doi: 10.1088/0004-637X/706/1/482
-
[36]
Murphy, E. J., Condon, J. J., Schinnerer, E., et al. 2011, ApJ, 737, 67, doi: 10.1088/0004-637X/737/2/67
-
[37]
Novak, M., Smolˇ ci´ c, V., Delhaize, J., et al. 2017, A&A, 602, A5, doi: 10.1051/0004-6361/201629436
-
[38]
2019, PyTorch: an imperative style, high-performance deep learning library (Red Hook, NY, USA: Curran Associates Inc.)
Paszke, A., Gross, S., Massa, F., et al. 2019, PyTorch: an imperative style, high-performance deep learning library (Red Hook, NY, USA: Curran Associates Inc.)
2019
-
[39]
Pearson, C. P. 2001, MNRAS, 325, 1511, doi: 10.1046/j.1365-8711.2001.04552.x 18
-
[40]
Rickard, L. J., & Harvey, P. M. 1984, AJ, 89, 1520, doi: 10.1086/113652
-
[41]
Salpeter, E. E. 1955, ApJ, 121, 161, doi: 10.1086/145971
-
[42]
1990, MNRAS, 242, 318, doi: 10.1093/mnras/242.3.318
Saunders, W., Rowan-Robinson, M., Lawrence, A., et al. 1990, MNRAS, 242, 318, doi: 10.1093/mnras/242.3.318
-
[43]
Schleicher, D. R. G., & Beck, R. 2013, A&A, 556, A142, doi: 10.1051/0004-6361/201321707
-
[44]
Schober, J., Schleicher, D. R. G., & Klessen, R. S. 2013, A&A, 560, A87, doi: 10.1051/0004-6361/201322185
-
[45]
2015, ApJS, 219, 15, doi: 10.1088/0067-0049/219/2/15 Smolˇ ci´ c, V., Novak, M., Bondi, M., et al
Shibuya, T., Ouchi, M., & Harikane, Y. 2015, ApJS, 219, 15, doi: 10.1088/0067-0049/219/2/15 Smolˇ ci´ c, V., Novak, M., Bondi, M., et al. 2017, A&A, 602, A1, doi: 10.1051/0004-6361/201628704
-
[46]
Tabatabaei, F., Khademi, M., Jarvis, M. J., et al. 2025, The Astrophysical Journal, 989, 44, doi: 10.3847/1538-4357/ade233
-
[47]
S., Schinnerer, E., Krause, M., et al
Tabatabaei, F. S., Schinnerer, E., Krause, M., et al. 2017, ApJ, 836, 185, doi: 10.3847/1538-4357/836/2/185 van der Kruit, P. C. 1973, A&A, 29, 263
-
[48]
G., Saxena, A., Fakiolas, S., et al
Varadaraj, R. G., Saxena, A., Fakiolas, S., et al. 2026, MNRAS, 547, stag473, doi: 10.1093/mnras/stag473
-
[49]
Vernstrom, T., Scott, D., Wall, J. V., et al. 2014, Monthly Notices of the Royal Astronomical Society, 440, 2791, doi: 10.1093/mnras/stu470
-
[50]
Virtanen, P., Gommers, R., Oliphant, T. E., et al. 2020, Nature Methods, 17, 261, doi: 10.1038/s41592-019-0686-2
-
[51]
Whitler, L., Stark, D. P., Topping, M. W., et al. 2025, ApJ, 992, 63, doi: 10.3847/1538-4357/adfddc
-
[52]
Whittam, I. H., Jarvis, M. J., Murphy, E. J., et al. 2025, MNRAS, 543, 507, doi: 10.1093/mnras/staf1505
-
[53]
J., Srinivasan, S., Pudritz, R
Whitworth, D. J., Srinivasan, S., Pudritz, R. E., et al. 2025, Monthly Notices of the Royal Astronomical Society, 540, 2762, doi: 10.1093/mnras/staf901
-
[54]
Yoast-Hull, T. M., Gallagher, J. S., & Zweibel, E. G. 2016, MNRAS, 457, L29, doi: 10.1093/mnrasl/slv195
-
[55]
2024, ApJ, 975, 15, doi: 10.3847/1538-4357/ad7385
Yoon, I. 2024, ApJ, 975, 15, doi: 10.3847/1538-4357/ad7385
discussion (0)
Sign in with ORCID, Apple, or X to comment. Anyone can read and Pith papers without signing in.