REVIEW 2 major objections 5 minor 33 references
With zero-noise unit labels, LLM confidence ranking largely fails at atomic resolution, and reasoning boosts accuracy while harming the ability to rank errors.
Reviewed by Pith at T0; open to challenge. T0 means a machine referee read the full paper against a public rubric. the ladder, T0–T4 →
T0 review · grok-4.5
2026-07-11 23:22 UTC pith:6YVIGAUV
load-bearing objection Clean zero-noise long-form uncertainty benchmark plus three solid empirical regularities; main limit is how far synthetic single-answer tasks travel. the 2 major comments →
Evaluating LLM Uncertainty in Long-Form Generation Using Deterministic Ground Truth
The pith
A machine-rendered reading of the paper's core claim, the machinery that carries it, and where it could break.
Core claim
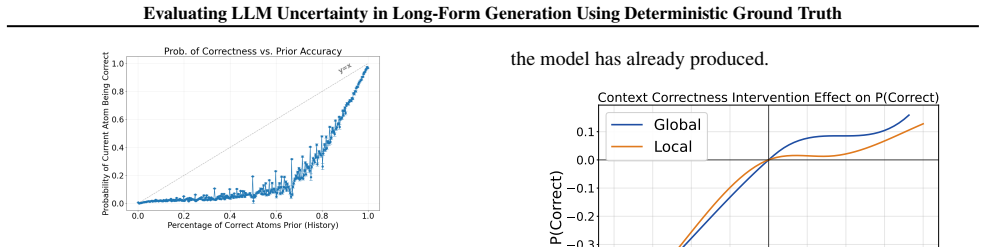
On a deterministic long-form benchmark with exact unit labels, confidence ranking largely collapses at atomic resolution for most models even when line-level ranking remains informative; controlled prefix interventions separate two drivers of later errors—propagation dominated by global context correctness and a bounded length effect—and reasoning (CoT or specialized training) improves accuracy while degrading ranking ability.
What carries the argument
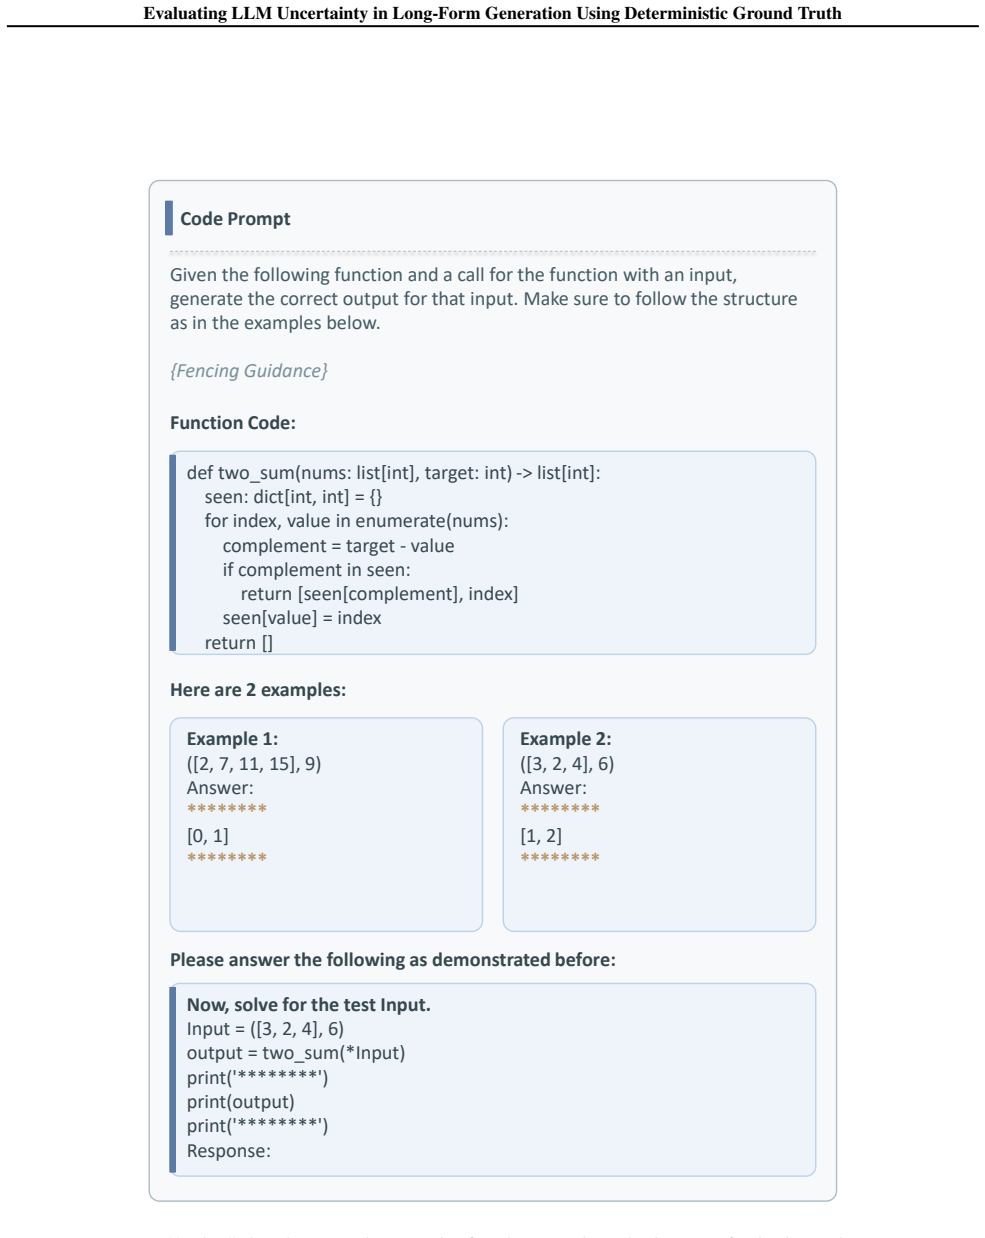
SALT (Single-answer Atomic Long-form Target): six procedurally generated tasks with one known long textual ground truth, enabling exact unit-level correctness labels, multi-granularity scoring, and controlled atom-level prefix interventions without judges or noisy decomposition.
Load-bearing premise
That the error dynamics, atomic ranking failure, and reasoning–ranking trade-off measured on these six single-answer structured tasks with strict index-aligned string matching transfer to open-ended long-form settings where multiple answers can be valid.
What would settle it
Re-run the same models and confidence functions on open-ended long-form tasks with high-quality multi-annotator atomic labels (or another zero-noise multi-valid setting) and check whether atomic AUROC remains near chance, the global-prefix propagation effect replicates, and the reasoning-induced AUROC drop still appears; if atomic ranking becomes strong or the trade-off vanishes, the central claims do not transfer.
Editorial analysis
A structured set of objections, weighed in public.
Referee Report
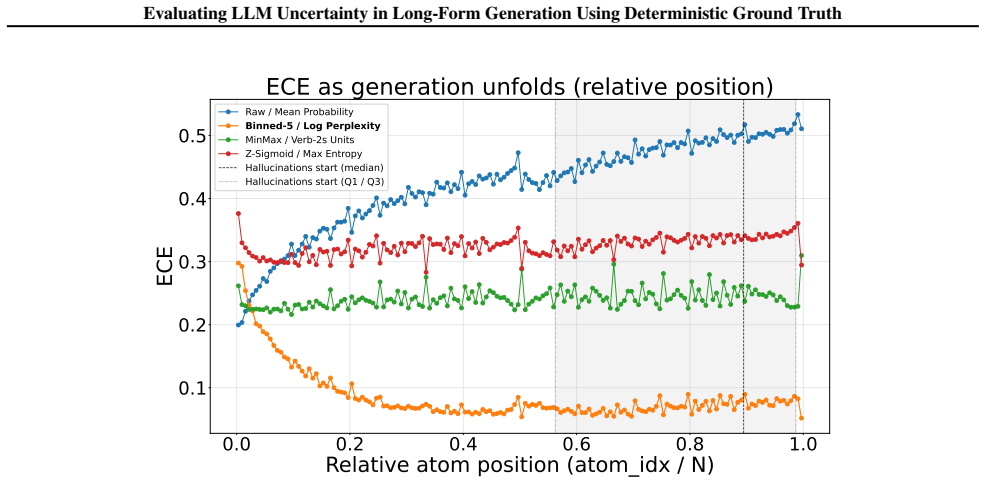
Summary. The paper introduces SALT, a procedurally generated long-form benchmark of six single-answer tasks (math, code, logic, DNA translation, multi-needle) with deterministic unit-level ground truth, enabling zero-noise evaluation of precision, ECE, and AUROC at atomic and line resolutions without external judges. Across 50+ LLMs it reports that (i) logits-based confidence functions dominate verbalized ones, with different functions best for calibration vs ranking; (ii) confidence ranking largely fails at atomic resolution while remaining informative at line level; (iii) controlled prefix interventions (mainly DNA) separate two drivers of future error—propagation from corrupted prefixes, with global correctness dominating local, and a bounded length-related degradation; and (iv) reasoning (CoT or trained reasoners) improves precision while systematically degrading AUROC. Code is released.
Significance. If the within-SALT results hold, the paper supplies a clean, contamination-resistant substrate for fine-grained uncertainty evaluation that prior long-form benchmarks lack because of judge noise. The atomic ranking failure, separable prefix vs length drivers, and reasoning–ranking trade-off are concrete, falsifiable findings with direct implications for selective generation and risk-critical deployment. Strengths include the large multi-model sweep, Wilcoxon dominance tests, mediation/ANM-style analysis of precision→ECE, and controlled interventions with mutual adjustment and saturation diagnostics (Appendix B). External representativeness remains the main limit on impact, which the paper itself flags via conditional AIME/MMLU-Pro transfer.
major comments (2)
- Section 5.1 and Appendix B.2: the causal claim that future correctness has two separable drivers (global prefix correctness dominating local, plus bounded length degradation) rests primarily on DNA interventions chosen for low inter-atom semantic dependence. Appendix K formalizes that other tasks (logic, multi-needle, matrix mult) have stronger input-span or logical-output dependence. Without analogous interventions on at least one higher-dependence task, the generality of the two-driver claim beyond DNA is under-supported for the main-text framing.
- Section 5.2 (reasoning trade-off) and Appendix G.5–G.6: the AUROC degradation under CoT/reasoning is a central claim, but the paired Instruct vs Reasoning comparisons and hybrid CoT+reasoning analysis are reported mainly in aggregate. Task-level and model-pair breakdowns (Figures 39–40) show substantial heterogeneity; the manuscript should state more clearly for which tasks/models the ranking degradation is robust versus precision-driven or task-specific, so the trade-off is not over-generalized from the median effect.
minor comments (5)
- Section 4.2 vs abstract/intro: the text mentions eight tasks then six with full coverage (ARC-AGI and Maze held out). Align the abstract and contribution list with the six-task main aggregate to avoid confusion.
- Figure 1 and Section 2.3: ECE and AUROC are illustrated at generation/line/atom levels; a short note that generation-level AUROC is often undefined or degenerate when entire generations are all-correct or all-incorrect would help readers interpret the granularity gap.
- Appendix H: the Needleman–Wunsch alignment ablation is useful; a one-sentence pointer in Section 4.3 to why strict indexing is preferred for precision (redundant units) would strengthen the main-text justification.
- Table 1 / task sizes: DNA contributes ~29k of ~55k atoms. Confirm that task-equal averaging (stated in Appendix A) is used for all main figures so DNA does not dominate aggregate AUROC/ECE.
- Typos and polish: e.g., 'Words Collection' prompt figure caption reused for Kronecker in one place; 'Maro-PRR' in a figure caption; minor notation consistency for U_gen vs U_gt.
Circularity Check
No significant circularity: empirical benchmark with independent deterministic labels, standard metrics, and external consistency checks.
full rationale
SALT is a procedurally generated benchmark whose ground-truth unit sequences are known a priori and independent of any model confidence scores; correctness is strict index-aligned string equality after fenced extraction. Precision, ECE, and AUROC are standard metrics applied to those labels. Confidence functions (perplexity, entropy, logprobs sum, verbalized probes) and post-hoc calibrations (Z-sigmoid, MinMax, binned) are compared empirically; selecting the best-performing function/scheme per metric for reporting is ordinary model-selection practice, not a fitted parameter renamed as a prediction of the same quantity. Prefix interventions are controlled counterfactuals on the model’s own answer context (primarily DNA), with paired baselines and spline regressions; they do not define the outcome by construction. Reasoning trade-off results come from paired Instruct/Reasoning and CoT comparisons plus mediation (DoWhy/ANM), not from self-definition. Self-citations (e.g., Galil/El-Yaniv selective-prediction background, Goren et al. 2026 motivational) are non-load-bearing. Consistency with MMLU-Pro, GPQA, Arena, and conditional transfer to AIME further anchors results outside the paper’s own fits. No self-definitional loop, no uniqueness theorem imported from the authors, no ansatz smuggled via self-citation, and no renaming of a known pattern as a first-principles derivation. The paper is self-contained empirical measurement; circularity score is zero.
Axiom & Free-Parameter Ledger
free parameters (5)
- ECE number of bins m =
15
- Binned calibration bin counts B =
B in {5,10,100}
- Cubic B-spline degrees of freedom for intervention curves =
df=5
- Problem size L and matrix dimension constraints =
task-dependent L
- Precision regime split threshold 0.6 for causal analysis =
0.6
axioms (5)
- domain assumption A generated unit is correct iff it exactly matches the corresponding ground-truth unit string (strict index alignment by default).
- domain assumption Token-level model probabilities (or verbalized probes) can be aggregated into unit-level confidence scores that are meaningful for calibration and ranking.
- ad hoc to paper Procedurally generated single-answer structured tasks are a valid substrate for studying long-form uncertainty dynamics relevant to deployment.
- standard math AUROC under 0/1 unit correctness equals the probability that a correct unit outranks an incorrect one (ranking risk specialization).
- domain assumption Final-answer fencing isolates the evaluated sequence from reasoning tokens without changing content semantics.
invented entities (3)
-
SALT (Single-answer Atomic Long-form Target) benchmark suite
independent evidence
-
Evaluation units (atomic-unit / line-unit partition of a generation)
no independent evidence
-
Redundant units (task-specific intrinsic hallucination subtype)
no independent evidence
read the original abstract
As LLMs generate increasingly long outputs, effective uncertainty estimation must identify errors at fine-grained levels rather than discard entire responses. While such methods exist, evaluating uncertainty at any resolution (token to an entire generation) is challenging and highly sensitive to label imperfections, making zero-noise benchmarks essential; yet, long-form generation benchmarks tend to rely on fallible labels rather than deterministic ground truth. We introduce Single-answer Atomic Long-form Target (SALT), a benchmark of six procedurally generated tasks with single deterministic long textual ground truths, enabling unit-level evaluation of correctness, calibration, and ranking without external judges. Equipped with SALT, our analysis of 50+ LLMs reveals key insights: We identify which confidence functions dominate each uncertainty aspect and show that confidence ranking largely breaks at atomic resolution, even when clearer separability emerges at coarser line-level units. SALT further enables controlled atom-level interventions throughout generation, revealing two separable drivers of future errors: propagation from corrupted prefixes, dominated by global context correctness, and bounded degradation from increasing answer-context length. Finally, we demonstrate that reasoning, via Chain-of-Thought prompting or internalized through training, introduces a trade-off, improving accuracy while degrading confidence ranking. These findings directly impact risk-critical applications requiring reliable error identification and mitigation.
Figures








Reference graph
Works this paper leans on
-
[1]
URL https://aclanthology.org/P04-3031/
Association for Computational Linguistics. URL https://aclanthology.org/P04-3031/. Bisk, Y ., Zellers, R., Bras, R. L., Gao, J., and Choi, Y . PIQA: reasoning about physical commonsense in nat- ural language. InThe Thirty-Fourth AAAI Conference on Artificial Intelligence, AAAI 2020, The Thirty-Second Innovative Applications of Artificial Intelligence Conf...
2020
- [2]
-
[3]
URL https://doi.org/10.1609/aaai. v34i05.6239. Bl¨obaum, P., G ¨otz, P., Budhathoki, K., Mastakouri, A. A., and Janzing, D. Dowhy-gcm: An extension of dowhy for causal inference in graphical causal mod- els.Journal of Machine Learning Research, 25(147):1– 7, 2024. URL http://jmlr.org/papers/v25/ 22-1258.html. Chen, C., Liu, K., Chen, Z., Gu, Y ., Wu, Y .,...
doi:10.1609/aaai 2024
-
[4]
Chen, L., de Melo, G., Suchanek, F
URL https://openreview.net/forum? id=Zj12nzlQbz. Chen, L., de Melo, G., Suchanek, F. M., and Varoquaux, G. Query-level uncertainty in large language models, 2026. URLhttps://arxiv.org/abs/2506.09669. Chernozhukov, V ., Chetverikov, D., Demirer, M., Du- flo, E., Hansen, C., Newey, W. K., and Robins, J. M. Double/debiased machine learning for treat- ment an...
arXiv 2026
-
[5]
URL https://api.semanticscholar. org/CorpusID:85528548. Chow, C. K. An optimum character recognition system using decision functions.IRE Trans. Electron. Com- put., 6(4):247–254, 1957. doi: 10.1109/TEC.1957. 5222035. URL https://doi.org/10.1109/TEC. 1957.5222035. Clark, P., Cowhey, I., Etzioni, O., Khot, T., Sabharwal, A., Schoenick, C., and Tafjord, O. T...
-
[6]
org/CorpusID:52816654
URL https://api.semanticscholar. org/CorpusID:52816654. Dawid, A. P. The well-calibrated bayesian.Journal of the American Statistical Association, 77(379):605–610,
-
[7]
ISSN 01621459, 1537274X. URL http://www. jstor.org/stable/2287720. 10 Evaluating LLM Uncertainty in Long-Form Generation Using Deterministic Ground Truth de Boor, C.A Practical Guide to Splines. Applied Math- ematical Sciences. Springer, 1978. ISBN 978-1-4612- 6333-3. doi: 10.1007/978-1-4612-6333-3. URL https: //doi.org/10.1007/978-1-4612-6333-3. DeepSeek...
-
[8]
Guo, C., Pleiss, G., Sun, Y ., and Weinberger, K
URL https://jmlr.org/papers/v6/ gretton05a.html. Guo, C., Pleiss, G., Sun, Y ., and Weinberger, K. Q. On cali- bration of modern neural networks. In Precup, D. and Teh, Y . W. (eds.),Proceedings of the 34th International Con- ference on Machine Learning, ICML 2017, Sydney, NSW, Australia, 6-11 August 2017, volume 70 ofProceedings of Machine Learning Resea...
2017
-
[9]
Hong, K., Troynikov, A., and Huber, J
URL http://proceedings.mlr.press/ v70/guo17a.html. Hong, K., Troynikov, A., and Huber, J. Context rot: How increasing input tokens impacts llm performance.URL https://research. trychroma. com/context-rot, retrieved October, 20:2025, 2025. Hoyer, P., Janzing, D., Mooij, J., Peters, J., and Sch¨olkopf, B. Nonlinear causal discovery with additive noise model...
2025
-
[10]
cc/paper_files/paper/2008/file/ f7664060cc52bc6f3d620bcedc94a4b6-Paper
URL https://proceedings.neurips. cc/paper_files/paper/2008/file/ f7664060cc52bc6f3d620bcedc94a4b6-Paper. pdf. Huang, L., Yu, W., Ma, W., Zhong, W., Feng, Z., Wang, H., Chen, Q., Peng, W., Feng, X., Qin, B., and Liu, T. A survey on hallucination in large language mod- els: Principles, taxonomy, challenges, and open ques- tions.ACM Trans. Inf. Syst., 43(2):...
doi:10.1145/3703155 2008
-
[12]
org/CorpusID:267200215
URL https://api.semanticscholar. org/CorpusID:267200215. Malinin, A. and Gales, M. J. F. Uncertainty estimation in autoregressive structured prediction. In9th International Conference on Learning Representations, ICLR 2021, Virtual Event, Austria, May 3-7, 2021. OpenReview.net,
2021
-
[13]
Manakul, P., Liusie, A., and Gales, M
URL https://openreview.net/forum? id=jN5y-zb5Q7m. Manakul, P., Liusie, A., and Gales, M. J. F. Selfcheck- gpt: Zero-resource black-box hallucination detection for generative large language models. In Bouamor, H., Pino, J., and Bali, K. (eds.),Proceedings of the 2023 Conference on Empirical Methods in Natural Lan- guage Processing, EMNLP 2023, Singapore, D...
doi:10.18653/v1/2023 2023
-
[14]
URL https://proceedings.mlr.press/ v202/shi23a.html. Tian, K., Mitchell, E., Zhou, A., Sharma, A., Rafailov, R., Yao, H., Finn, C., and Manning, C. D. Just ask for calibra- tion: Strategies for eliciting calibrated confidence scores from language models fine-tuned with human feedback. In Bouamor, H., Pino, J., and Bali, K. (eds.),Proceed- ings of the 2023...
work page internal anchor Pith review Pith/arXiv arXiv doi:10.18653/v1/ 2023
-
[15]
URL https://api.semanticscholar. org/CorpusID:235899031. Vashurin, R., Fadeeva, E., Vazhentsev, A., Rvanova, L., Vasilev, D., Tsvigun, A., Petrakov, S., Xing, R., Sadal- lah, A. B., Grishchenkov, K., Panchenko, A., Baldwin, T., Nakov, P., Panov, M., and Shelmanov, A. Bench- marking uncertainty quantification methods for large lan- guage models with lm-pol...
-
[16]
URL https://aclanthology.org/2025. emnlp-main.1543/. Ye, F., Yang, M., Pang, J., Wang, L., Wong, D. F., Yilmaz, E., Shi, S., and Tu, Z. Benchmarking llms via uncertainty quantification. In Globersons, A., Mackey, L., Belgrave, D., Fan, A., Paquet, U., Tomczak, J. M., and Zhang, C. (eds.),Advances in Neural Information Processing Systems 38: Annual Confere...
-
[17]
URL https://aclanthology.org/2024. emnlp-main.443/. Yoon, D., Kim, S., Yang, S., Kim, S., Kim, S., Kim, Y ., Choi, E., Kim, Y ., and Seo, M. Reasoning models better express their confidence.CoRR, abs/2505.14489, 2025. doi: 10.48550/ARXIV .2505.14489. URL https:// doi.org/10.48550/arXiv.2505.14489. Zablotskaia, P., Phan, D., Maynez, J., Narayan, S., Ren, J...
doi:10.48550/arxiv 2024
-
[18]
findings-emnlp.197/
URL https://aclanthology.org/2023. findings-emnlp.197/. Zadrozny, B. and Elkan, C. Transforming classifier scores into accurate multiclass probability estimates. InPro- ceedings of the Eighth ACM SIGKDD International Conference on Knowledge Discovery and Data Mining, July 23-26, 2002, Edmonton, Alberta, Canada, pp. 694–
2023
-
[19]
ACM, 2002. doi: 10.1145/775047.775151. URL https://doi.org/10.1145/775047.775151. Zellers, R., Holtzman, A., Bisk, Y ., Farhadi, A., and Choi, Y . Hellaswag: Can a machine really finish your sentence? In Korhonen, A., Traum, D. R., and M`arquez, L. (eds.), Proceedings of the 57th Conference of the Association for Computational Linguistics, ACL 2019, Flore...
-
[20]
doi: 10.18653/V1/P19-1472. URL https:// doi.org/10.18653/v1/p19-1472. Zhang, C., Liu, F., Basaldella, M., and Collier, N. LUQ: long-text uncertainty quantification for llms. In Al- Onaizan, Y ., Bansal, M., and Chen, Y . (eds.),Proceedings of the 2024 Conference on Empirical Methods in Natural Language Processing, EMNLP 2024, Miami, FL, USA, November 12-1...
-
[21]
Significance( Hsig 0 :β 1 =· · ·=β 5 = 0): F-test (OLS) / likelihood-ratio test (GLM) against the model with the spline basis removed.Rejects flatness, not linearity
-
[22]
correctness
Nonlinearity( Hnl 0 : the spline model reduces to a linear-in- T model). F-test (OLS) / LR test (GLM) between the spline model and ˜Y=α+δT+γ ⊤X+ε . We also report ∆AIC = AIC(linear)−AIC(spline) ; positive ⇒ spline preferred. Within-triple row correlation makes asymptotic row-level p-values overconfident; we cap reported p-values atp <0.001 and rely on∆AIC...
2025
-
[23]
Regime Stratification:Preliminary non-parametric analysis revealed a non-monotonic ”V-shaped” relationship between precision and calibration. To avoid confounding effects arising from this non-linearity (where opposite trends cancel each 40 Evaluating LLM Uncertainty in Long-Form Generation Using Deterministic Ground Truth Table 9.Causal analysis of the P...
-
[24]
Robustness to Confounding (Model Size) Partial Correlation Spearmanρ−0.90(p <0.001)+0.84(p <0.001) Conditional Independence HSIC Test RejectH 0 (p <0.001) RejectH 0 (p <0.001) Causal Effect (DML) Estimate−0.60(p <0.001)+0.62(p <0.001)
-
[25]
Causal Directionality (ANM) Forward ModelHSIC p-value0.990.07 (Precision→ECE) DecisionAcceptedAccepted (Ambiguous) Backward ModelHSIC p-value0.030.08 (ECE→Precision) DecisionRejectedAccepted (Ambiguous) other out), we stratified the analysis into two distinct regimes: aLow Precisionregime (Precision <0.6 , N= 34 ) and a High Precisionregime (Precision≥0.6,N= 16)
-
[26]
Confounding Assessment (Robustness to Model Scale):Within each regime, we tested whether the Precision-ECE link was spurious and driven simply by model capacity. We controlled forTotal ParametersandActive Parametersusing three complementary tests: •Partial Correlation (Spearman):Measures monotonic association while holding model size constant. • Condition...
2005
-
[27]
We modeled the functional relationship using Gaussian Process regression and tested independence between the predictor and the residuals using HSIC
Causal Directionality (ANM):To validate the direction of causality, we utilized the Additive Noise Model (ANM) framework (Hoyer et al., 2008). We modeled the functional relationship using Gaussian Process regression and tested independence between the predictor and the residuals using HSIC. A high p-value indicates that the residuals are independent noise...
2008
-
[28]
All three tests (Partial Correlation, HSIC, and DML) confirm that the link persists even after rigorously controlling for model scale
Robustness:In both regimes, the relationship between Precision and ECE is robust to confounding. All three tests (Partial Correlation, HSIC, and DML) confirm that the link persists even after rigorously controlling for model scale
-
[29]
The Low Precision Regime ( <0.6 ):We find a clear causal signal that improvements in precision drive better calibration. The ANM test decisively accepts the forward direction ( p= 0.99 ) and rejects the reverse ( p= 0.03 ), suggesting precision is the functional driver of calibration error in this phase
-
[30]
Higher precision causeshighercalibration error, with a positive causal effect of+0.62
The High Precision Regime (≥0.6 ):The relationship inverts significantly. Higher precision causeshighercalibration error, with a positive causal effect of+0.62. While the directionality tests are ambiguous, we hypothesize it is likely due to the small sample size,N= 16. G.5.3. RESIDUALANALYSIS We fit a linear regression ECE∼Precision on the 35 non-reasoni...
-
[31]
Fit: dECE=β 0 +β 1 ·Precision on non-reasoning models
-
[32]
For each reasoning modeli, compute residual:r i =ECE i − dECEi
-
[33]
Reasoning- Ranking Trade-off
Test whether{r i}are systematically different from zero using one-sided t-tests Results: • Mean residual:+0.039(slight positive deviation) • One-sided t-test (worse than expected):p= 0.052 • One-sided t-test (better than expected):p= 0.948 The residuals are not significantly different from zero in either direction, indicating reasoning models’ calibration...
2020
-
[34]
On average, this is E[Wk] =n 0A
Scenario 1 (xk ∈P→N ):We lose the wins xk contributed. On average, this is E[Wk] =n 0A. As a new Negative, xk is compared to remaining Positives. Assuming independence, a random sample is outscored by half the population, so it contributes≈n 1/2losses. 2.Scenario 2 (x k ∈N→P):Symmetric logic applies. The net change in the numerator for a single flip is th...
discussion (0)
Sign in with ORCID, Apple, or X to comment. Anyone can read and Pith papers without signing in.