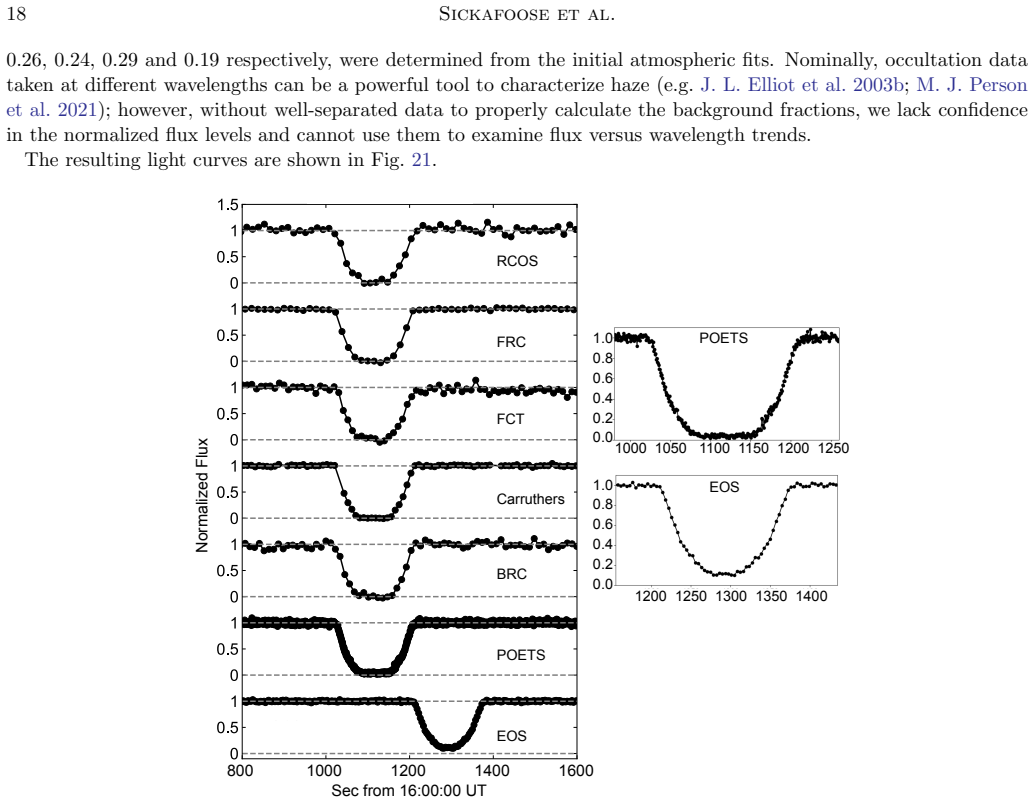
Changes in Pluto's Atmosphere Based on Stellar Occultation Data from 2017 to 2023
Pith reviewed 2026-06-25 20:07 UTC · model grok-4.3
The pith
Stellar occultations show Pluto's atmospheric pressure plateaued from 2015 to 2021 then began to drop.
A machine-rendered reading of the paper's core claim, the machinery that carries it, and where it could break.
Core claim
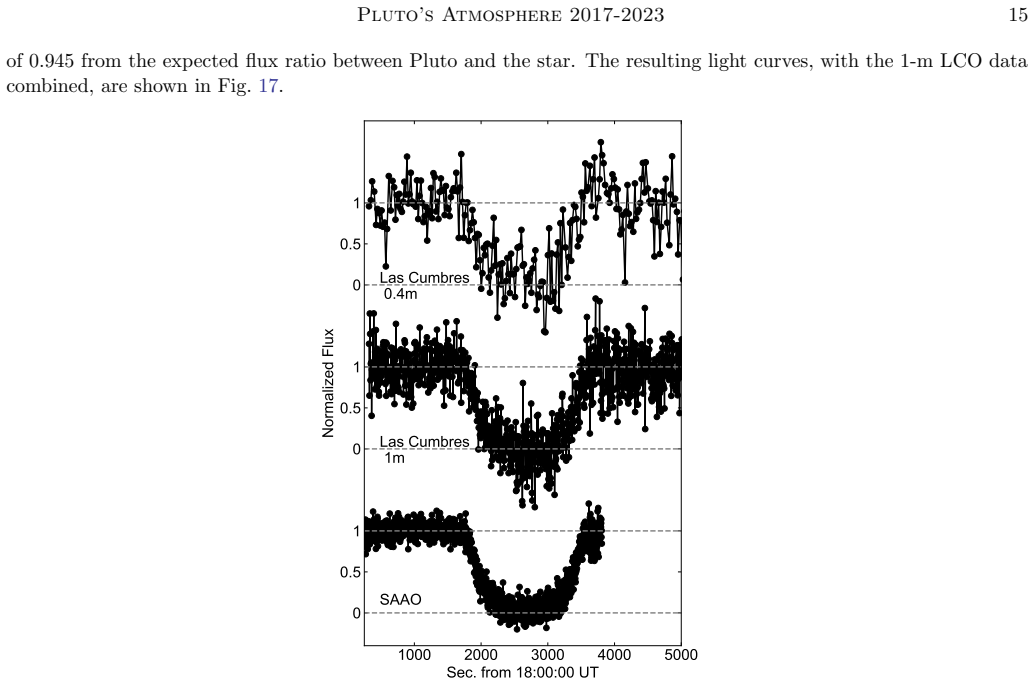
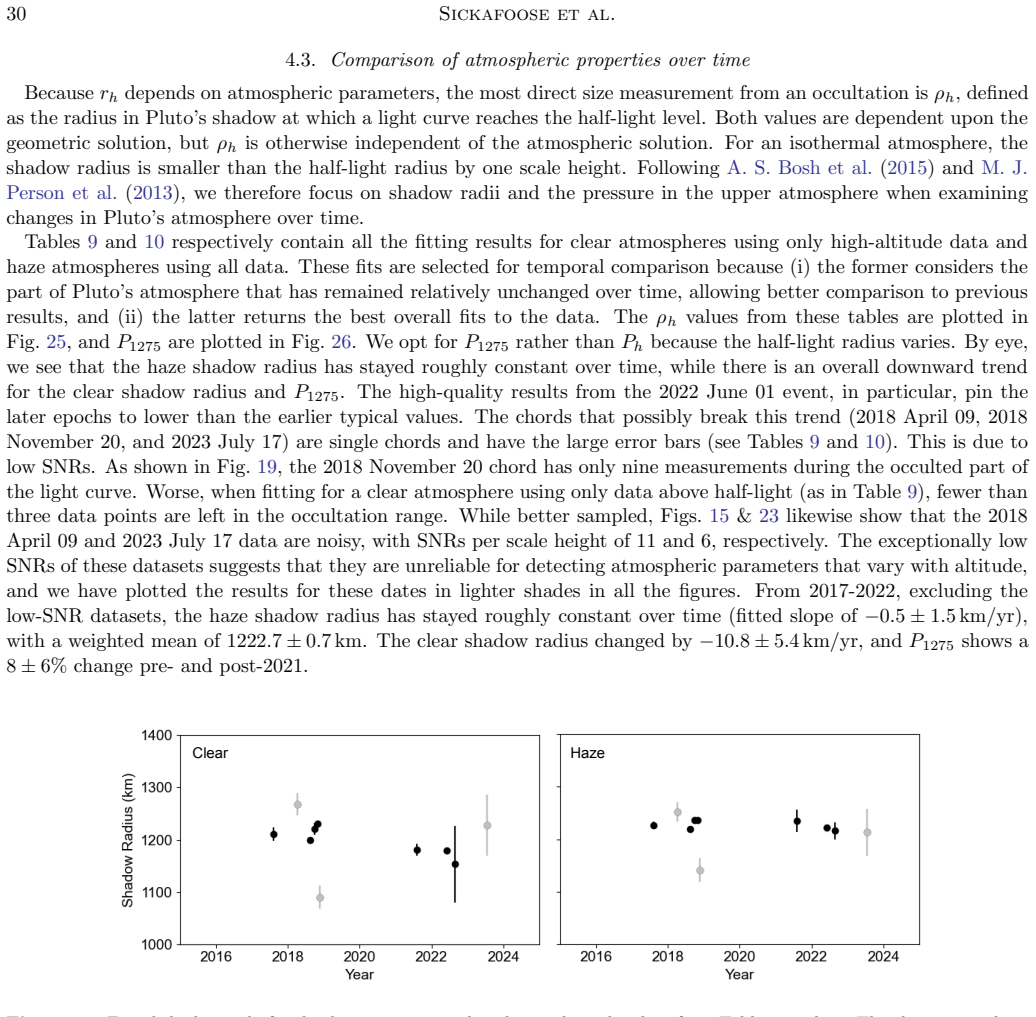
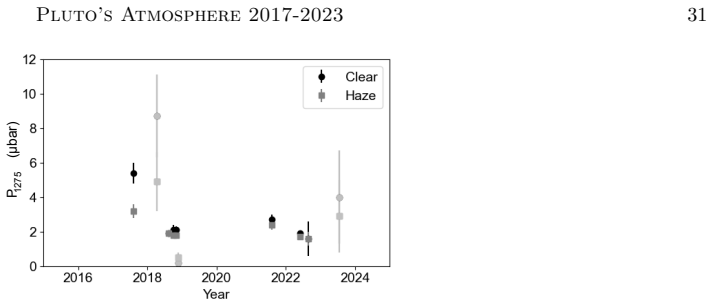
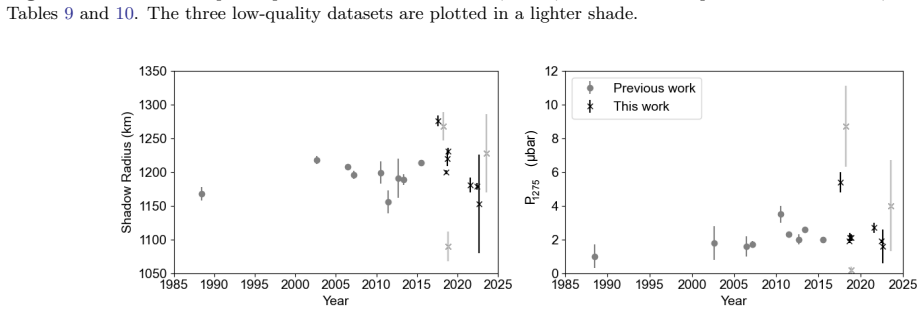
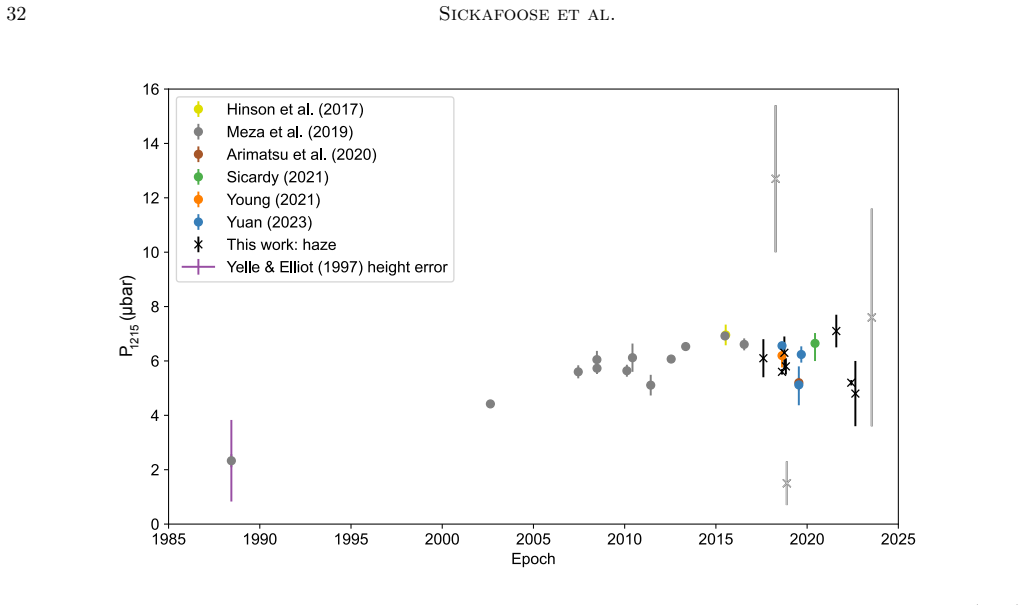
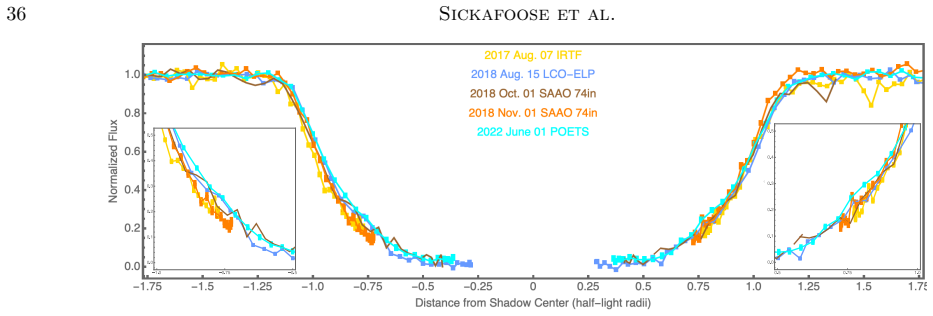
Analysis of multi-chord and single-site stellar occultations reveals a pressure plateau in Pluto's atmosphere between the 2015 New Horizons flyby and roughly 2021, followed by a decrease: clear-atmosphere pressure at 1275 km radius fell by 7±6% between 2015-2021 and 2022, while pressure at 1215 km including haze dropped 16±2%. The upper atmospheric structure remained consistent from 2017-2023, but light-curve slopes in the lower atmosphere changed in a manner consistent with haze particle settling on yearly or shorter timescales. Spikes in one light curve suggest intermittent buoyancy waves.
What carries the argument
Inversion of stellar occultation light curves to retrieve atmospheric pressure at fixed radii (1275 km clear and 1215 km with haze).
If this is right
- Atmospheric pressure remained stable from the 2015 New Horizons flyby through roughly 2021.
- Clear-atmosphere pressure at 1275 km decreased 7±6% by 2022 relative to the plateau.
- Pressure at 1215 km including haze decreased 16±2% over the same interval.
- Upper atmospheric structure stayed consistent from 2017 to 2023 while lower-atmosphere light-curve slopes changed consistent with haze settling.
- Spikes observed in one light curve indicate the presence of intermittent buoyancy waves.
Where Pith is reading between the lines
- The timing of the 2021 transition may mark when declining insolation began to outpace volatile resupply from the surface.
- Short-timescale haze settling implies particle dynamics operate faster than seasonal orbital changes.
- If the downward trend continues, it would favor volatile-transport models that predict eventual atmospheric collapse over decades rather than long-term stability.
- Simultaneous surface imaging during future occultations could test whether the pressure drop correlates with visible frost redistribution.
Load-bearing premise
The analysis assumes that stellar occultation light-curve inversions can accurately isolate atmospheric pressure at specific radii after accounting for haze contributions without significant systematic biases.
What would settle it
A 2024 or later stellar occultation yielding pressure at 1275 km that is higher than or equal to the 2015-2021 level would falsify the reported onset of decline.
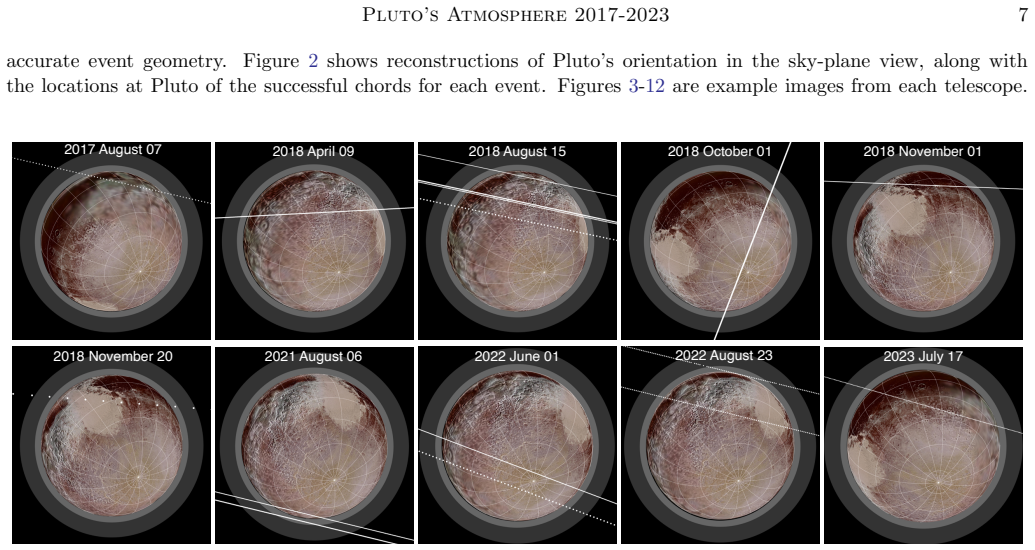
Figures
read the original abstract
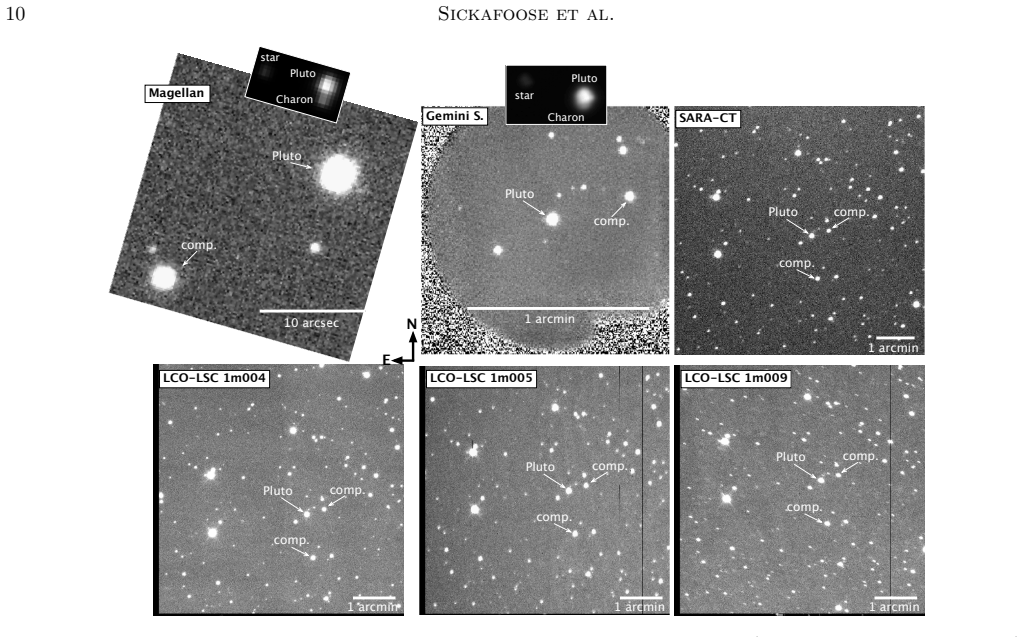
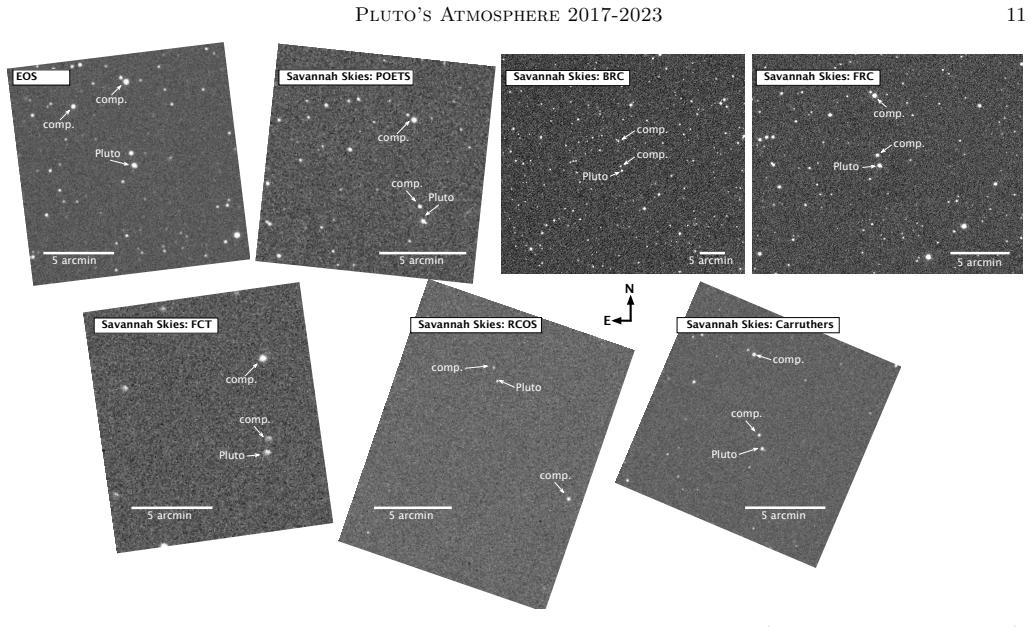
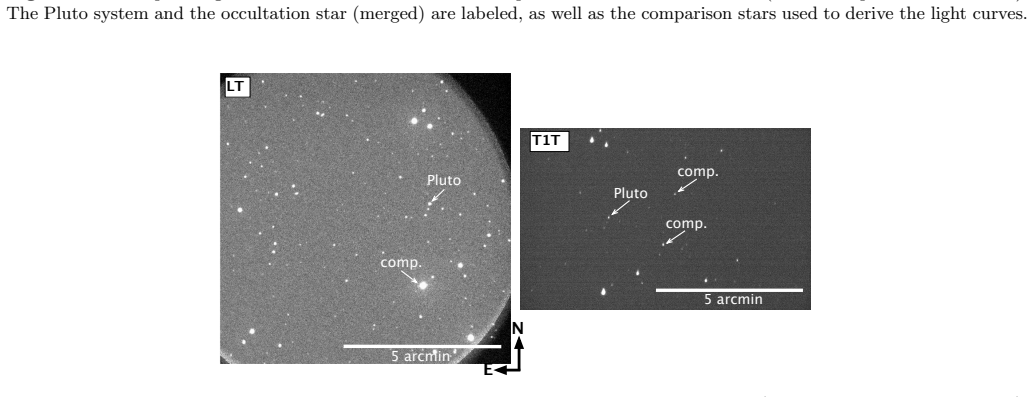
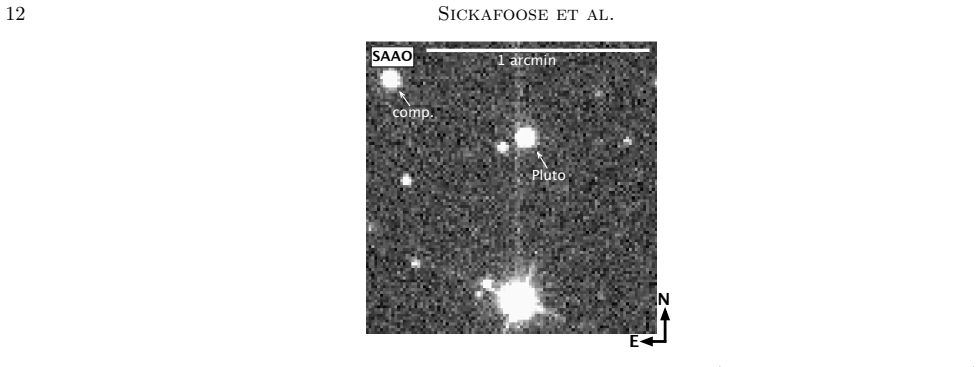
Pluto's tenuous atmosphere has $\mu$bar-level pressure and is composed primarily of ${\text{N}}_2$, with a variable haze. Its eccentric orbit combined with high obliquity leads to significant changes in solar insolation throughout the Plutonian year. The atmosphere is supported by vapor-pressure equilibrium with the surface ices, thus surface changes are coupled with the atmospheric properties. Volatile-transport models have anticipated Pluto's atmospheric evolution: predictions range from collapse over the coming decades to an atmosphere that remains. Previous work claims that Pluto's atmospheric pressure monotonically increased from 1988 through 2016, that the atmosphere began freezing out in 2018-2019, and that there was a plateau as of 2020. Here, we report results from ten stellar occultations by Pluto between 2017 August and 2023 July. Four events were multi-chord, while six were from single sites. Our results indicate a pressure plateau between the New Horizons flyby in 2015 through roughly 2021 and suggest that the atmospheric pressure has started to drop. Between 2015-2021 and 2022, the clear-atmosphere pressure at 1275 km decreased $7\pm6\%$, and it dropped $16\pm2\%$ for pressure at 1215 km when including haze. From 2017-2023, the upper atmospheric structure is consistent, while there is a change in light-curve slope in the lower atmosphere. This change-of-slope is consistent with haze particles settling over yearly or shorter timescales. Spikes in one light curve are indicative of intermittent buoyancy waves. More data are needed to confirm a recent pressure change.
Editorial analysis
A structured set of objections, weighed in public.
Referee Report
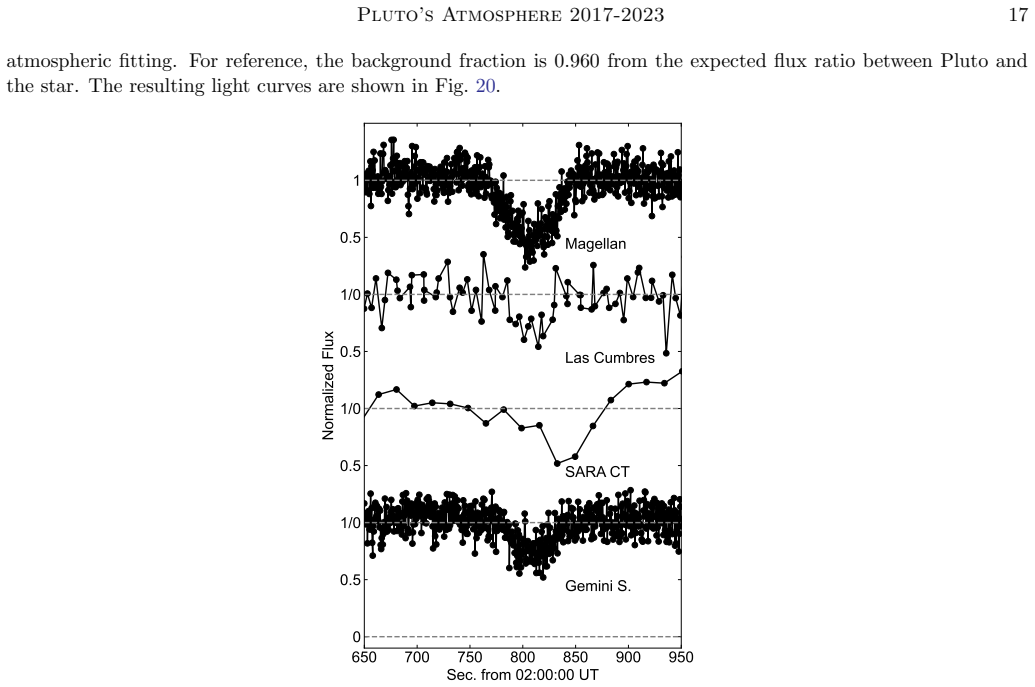
Summary. The manuscript analyzes ten stellar occultations by Pluto (four multi-chord, six single-site) observed 2017 August–2023 July. It reports a pressure plateau from the 2015 New Horizons flyby through ~2021, followed by a suggested drop: 7±6% in clear-atmosphere pressure at 1275 km and 16±2% at 1215 km (including haze) between the 2015–2021 baseline and 2022. Upper-atmosphere structure is described as consistent while lower-atmosphere light-curve slopes change in a manner attributed to haze settling; one light curve shows spikes interpreted as buoyancy waves. The authors state that more data are needed to confirm a recent pressure change.
Significance. If the reported pressure drop proves robust after accounting for systematics, the work would supply valuable new constraints on volatile-transport models for Pluto, helping discriminate between atmospheric-collapse and stability scenarios. The dataset extends the post-2015 observational record and links light-curve morphology to haze dynamics on yearly timescales.
major comments (3)
- [Abstract] Abstract: the headline claim of a post-2021 pressure drop rests on pressure retrievals at fixed radii (1275 km clear-atmosphere and 1215 km with haze). The manuscript must demonstrate that the inversion isolates refractivity at these exact levels without residual coupling to haze extinction, temperature assumptions, or chord geometry; only four of ten events are multi-chord, weakening geometric constraints for the remaining six.
- [Abstract] Abstract: the quoted uncertainties (7±6% and 16±2%) are presented as statistical; the text should quantify or bound potential systematic contributions from single-chord geometry, possible non-spherical effects, and the noted change in lower-atmosphere light-curve slope (which could arise from unmodeled temperature or wave structure rather than haze settling alone).
- [Abstract] The distinction between the two radii and the two haze treatments is load-bearing for the percentage changes; without explicit validation that the slope change is uniquely attributable to haze settling on yearly timescales, the 16±2% figure at 1215 km risks over-interpretation.
minor comments (2)
- A summary table listing all ten events (date, site(s), chord type, wavelength) would allow readers to assess data quality and selection directly.
- The statement that upper-atmospheric structure is 'consistent' would benefit from a quantitative metric (e.g., scale-height comparison or refractivity profile overlay) rather than qualitative description.
Simulated Author's Rebuttal
We thank the referee for their thorough and constructive review. The comments highlight important aspects of our analysis that require clarification and strengthening. We address each major comment below and indicate the revisions we will make.
read point-by-point responses
-
Referee: [Abstract] Abstract: the headline claim of a post-2021 pressure drop rests on pressure retrievals at fixed radii (1275 km clear-atmosphere and 1215 km with haze). The manuscript must demonstrate that the inversion isolates refractivity at these exact levels without residual coupling to haze extinction, temperature assumptions, or chord geometry; only four of ten events are multi-chord, weakening geometric constraints for the remaining six.
Authors: We agree that explicit demonstration of isolation at the fixed radii is essential. In revision we will add sensitivity tests in the methods section that vary haze extinction, temperature profiles, and chord geometry assumptions, showing that the retrieved refractivity at 1275 km and 1215 km remains stable within the quoted uncertainties for the four multi-chord events. For the six single-chord events we will add a dedicated paragraph quantifying the impact of the spherical-symmetry assumption and noting the reduced geometric constraints. revision: yes
-
Referee: [Abstract] Abstract: the quoted uncertainties (7±6% and 16±2%) are presented as statistical; the text should quantify or bound potential systematic contributions from single-chord geometry, possible non-spherical effects, and the noted change in lower-atmosphere light-curve slope (which could arise from unmodeled temperature or wave structure rather than haze settling alone).
Authors: The reported uncertainties are statistical only. We will revise the results and discussion sections to include order-of-magnitude bounds on the dominant systematics: single-chord geometry (estimated from the multi-chord subset), possible non-spherical effects, and alternative interpretations of the slope change. The 16±2% value will be presented with an explicit caveat that part of the change could arise from temperature or wave structure. revision: yes
-
Referee: [Abstract] The distinction between the two radii and the two haze treatments is load-bearing for the percentage changes; without explicit validation that the slope change is uniquely attributable to haze settling on yearly timescales, the 16±2% figure at 1215 km risks over-interpretation.
Authors: We accept that unique attribution of the slope change to haze settling cannot be demonstrated with the current dataset alone. In the revised manuscript we will present supporting arguments from the observed timescale and consistency with prior haze models, while explicitly stating that temperature or wave contributions cannot be ruled out. The 16±2% figure will be qualified accordingly and the abstract will be updated to reflect this nuance. revision: partial
Circularity Check
No circularity: results from direct inversion of new occultation light curves
full rationale
The paper reports atmospheric pressures retrieved via inversion of ten new stellar occultation light curves (2017-2023), four of them multi-chord. The central claims (pressure plateau through ~2021 followed by a drop) are stated as direct outputs of those inversions at fixed radii, with no equations, fitted parameters, or self-citations shown that would make any reported pressure value equivalent to its own input by construction. No ansatz, uniqueness theorem, or renaming of prior results is invoked in the supplied text. The derivation chain is therefore self-contained against external data.
Axiom & Free-Parameter Ledger
Reference graph
Works this paper leans on
-
[1]
L., Kagitani, M., et al
Arimatsu, K., Hashimoto, G. L., Kagitani, M., et al. 2020, Astronomy & Astrophysics, 638, L5
2020
-
[2]
2016, Nature, 540, 86, doi: 10.1038/nature19337
Bertrand, T., & Forget, F. 2016, Nature, 540, 86, doi: 10.1038/nature19337
-
[3]
M., et al
Bertrand, T., Forget, F., Umurhan, O. M., et al. 2018, Icarus, 309, 277
2018
-
[4]
2025, Nature Astronomy, 9, 1300, doi: 10.1038/s41550-025-02573-z
Bertrand, T., Lellouch, E., Holler, B., et al. 2025, Nature Astronomy, 9, 1300, doi: 10.1038/s41550-025-02573-z
-
[5]
S., Person, M
Bosh, A. S., Person, M. J., Levine, S. E., et al. 2015, Icarus, 246, 237
2015
-
[6]
2010, in Astronomical Society of the Pacific Conference Series, Vol
Boumis, P., Pollacco, D., Steele, I., et al. 2010, in Astronomical Society of the Pacific Conference Series, Vol. 424, 9th International Conference of the Hellenic Astronomical Society, ed. K. Tsinganos, D. Hatzidimitriou, & T. Matsakos, 426
2010
-
[7]
2021, Zenodo, doi: 10.5281/zenodo.4624996
Bradley, L., Sip˝ ocz, B., Robitaille, T., et al. 2021, Zenodo, doi: 10.5281/zenodo.4624996
-
[8]
1995, Monthly Notices of the Royal Astronomical Society, 276, 571
Brosch, N. 1995, Monthly Notices of the Royal Astronomical Society, 276, 571
1995
-
[9]
M., & Elliot, J
Chamberlain, D. M., & Elliot, J. L. 1997, Publications of the Astronomical Society of the Pacific, 109, 1170
1997
-
[10]
F., Summers, M
Cheng, A. F., Summers, M. E., Gladstone, G. R., et al. 2017, Icarus, 290
2017
-
[11]
Collaboration, A., Robitaille, T. P., Tollerud, E. J., et al. 2013, Astronomy and Astrophysics, 558, A33, doi: 10.1051/0004-6361/201322068
-
[12]
2013, Publications of the Astronomical Society of the Pacific, 125, 976
Coppejans, R., Gulbis, A., Kotze, M., et al. 2013, Publications of the Astronomical Society of the Pacific, 125, 976
2013
-
[13]
2019, A&A, 625, eid.A43, doi: 10.1051/0004-6361/201834958
Desmars, J., Meza, E., Sicardy, B., et al. 2019, A&A, 625, eid.A43, doi: 10.1051/0004-6361/201834958
-
[14]
2015, Astrophysical Journal, 811
Dias-Oliveira, A., Sicardy, B., Lellouch, E., et al. 2015, Astrophysical Journal, 811
2015
-
[15]
Earle, A., & Binzel, R. P. 2015, Icarus, 250, 405–412
2015
-
[16]
L., Dunham, E
Elliot, J. L., Dunham, E. W., Bosh, A. S., et al. 1989, Icarus, 77, 148
1989
-
[17]
Elliot, J. L., French, R. G., Dunham, E., et al. 1977, ApJ, 217, 661, doi: 10.1086/155612
-
[18]
Elliot, J. L., & Veverka, J. 1976, Icarus, 27, 359, doi: 10.1016/0019-1035(76)90015-4
-
[19]
L., & Young, L
Elliot, J. L., & Young, L. A. 1992, Astronomical Journal, 103, 991
1992
-
[20]
L., Bosh, A
Elliot, J. L., Bosh, A. S., Cooke, M. L., et al. 1993, Astronomical Journal, 106, 2544
1993
-
[21]
L., Person, M
Elliot, J. L., Person, M. J., Gulbis, A. A. S., et al. 2007, Astronomical Journal, 134, 1
2007
-
[22]
L., Person, M
Elliot, J. L., Person, M. J., Zuluaga, C. A., et al. 2010, Nature, 465, 897
2010
-
[23]
2022, Nature Communications, 13, 240, doi: 10.1038/s41467-021-27811-6 Gaia Collaboration et al
Fan, S., Gao, P., Zhang, X., et al. 2022, Nature Communications, 13, 240, doi: 10.1038/s41467-021-27811-6 Gaia Collaboration et al. 2016, Astronomy & Astrophysics, 595, id. A1 Gaia Collaboration et al. 2023, A&A, 674, A1, doi: 10.1051/0004-6361/202243940
-
[24]
Giorgini, J. D. 2015, in IAU General Assembly, Vol. 29, 2256293
2015
-
[25]
R., & Young, L
Gladstone, G. R., & Young, L. A. 2019, Annual Review of Earth and Planetary Sciences, 47, 119
2019
-
[26]
R., Stern, S
Gladstone, G. R., Stern, S. A., Ennico, K., et al. 2016, Science, 351, aad8866
2016
-
[27]
2015, Icarus, 246, 226
Gulbis, A., Emery, J., Person, M., et al. 2015, Icarus, 246, 226
2015
-
[28]
Gulbis, A. A. S., Bus, S., Elliot, J., et al. 2011, Publications of the Astronomical Society of the Pacific, 123, 461
2011
-
[29]
J., & Paige, D
Hansen, C. J., & Paige, D. A. 1996, Icarus, 120, 247
1996
-
[30]
J., Paige, D
Hansen, C. J., Paige, D. A., & Young, L. A. 2015, Icarus, 246, 183–191 Pluto’s Atmosphere 2017-202343
2015
-
[31]
Harris, C. R., Millman, K. J., van der Walt, S. J., et al. 2020, Nature, 585, 357, doi: 10.1038/s41586-020-2649-2
-
[32]
P., Linscott, I
Hinson, D. P., Linscott, I. R., Young, L. A., et al. 2017, Icarus, 290, 96–111
2017
-
[33]
B., Hunten, D
Hubbard, W. B., Hunten, D. M., Dieters, S. W., Hill, K. M., & Watson, R. D. 1988, Nature, 336, 452
1988
-
[34]
B., McCarthy, D
Hubbard, W. B., McCarthy, D. W., Kulesa, C. A., et al. 2009, Icarus, 204, 284
2009
-
[35]
Hubbard, W. B., McCarthy, D. W., Kulesa, C. A., et al. 2009, Icarus, 204, 284, doi: 10.1016/j.icarus.2009.06.022
-
[36]
Computing in Science and Engineering , keywords =
Hunter, J. 2007, Computing in Science & Engineering, 9, 90, doi: 10.1109/MCSE.2007.55
-
[37]
2021, Icarus, 356, id.114070
Johnson, P., Young, L., Protopapa, S., et al. 2021, Icarus, 356, id.114070
2021
-
[38]
Johnson, P. E., Keane, J. T., Young, L. A., & Matsuyama, I. 2021, PSJ, 2, 194, doi: 10.3847/PSJ/ac1d42
-
[39]
Knieling, B., Schindler, K., Sickafoose, A. A., et al. 2024, Planetary Science Journal, 5, 104, doi: 10.3847/PSJ/ad3819
-
[40]
2025, A&A, 696, A147, doi: 10.1051/0004-6361/202453619
Lellouch, E., Wong, I., Lavvas, P., et al. 2025, A&A, 696, A147, doi: 10.1051/0004-6361/202453619
-
[41]
2018, LCOGT/banzai: Initial Release, 0.9.4 Zenodo, doi: 10.5281/zenodo.1257560
McCully, C., Turner, M., Volgenau, N., et al. 2018, LCOGT/banzai: Initial Release, 0.9.4 Zenodo, doi: 10.5281/zenodo.1257560
-
[42]
2019, A&A, 625, id.A42
Meza, E., Sicardy, B., Assafin, M., et al. 2019, A&A, 625, id.A42
2019
-
[43]
B., Young, L
Olkin, C. B., Young, L. A., French, R. G., et al. 2014, Icarus, 239, 15
2014
-
[44]
L., Santos-Sanz, P., Sicardy, B., et al
Ortiz, J., Santos-Sanz, P., Sicardy, B., et al. 2017, Nature, 550, 219, doi: 10.1038/nature24051
-
[45]
Pasachoff, J. M., Babcock, B. A., Durst, R. F., et al. 2017, Icarus, 296, 305, doi: 10.1016/j.icarus.2017.05.012
-
[46]
J., Elliot, J
Person, M. J., Elliot, J. L., Gulbis, A. A. S., et al. 2008, Astronomical Journal, 136, 1510
2008
-
[47]
Person, M. J., Elliot, J. L., Gulbis, A. A. S., et al. 2008, AJ, 136, 1510, doi: 10.1088/0004-6256/136/4/1510
-
[48]
J., Elliot, J
Person, M. J., Elliot, J. L., Bosh, A. S., et al. 2010, Bulletin of the American Astronomical Society, 42, 983
2010
-
[49]
J., Dunham, E
Person, M. J., Dunham, E. W., Bosh, A. S., et al. 2013, Astronomical Journal, 146, 83
2013
-
[51]
Person, M. J., Bosh, A. S., Zuluaga, C. A., et al. 2021, Icarus, 356, 113572, doi: 10.1016/j.icarus.2019.113572
-
[52]
2021, A&A, 652, L7
Poro, A., Ahangarani Farahani, F., Bahraminasr, M., et al. 2021, A&A, 652, L7
2021
-
[53]
Saunders, W. R., Person, M. J., Withers, P., French, R. G., & Tubthong, C. 2024, PSJ, 5, 247, doi: 10.3847/PSJ/ad7c4d
-
[54]
L., & Brown, M
Schaller, E. L., & Brown, M. 2007, Astrophysical Journal Letters, 659, L61
2007
-
[55]
2026, PASP, submitted
Schindler, K., Wolf, J., & Krabbe, A. 2026, PASP, submitted
2026
-
[56]
J., Howell, S
Scott, N. J., Howell, S. B., Gnilka, C. L., et al. 2021, Frontiers in Astronomy and Space Sciences, 8, id. 138
2021
-
[57]
2003, Nature, 424, 168
Sicardy, B., Widemann, T., Lellouch, E., et al. 2003, Nature, 424, 168
2003
-
[58]
L., Assafin, M., et al
Sicardy, B., Ortiz, J. L., Assafin, M., et al. 2011, Nature, 478, 493
2011
-
[59]
2011, AJ, 141, 67, doi: 10.1088/0004-6256/141/2/67
Sicardy, B., Bolt, G., Broughton, J., et al. 2011, AJ, 141, 67, doi: 10.1088/0004-6256/141/2/67
-
[60]
2016, The Astrophysical Journal, 819, L38, doi: 10.3847/2041-8205/819/2/L38
Sicardy, B., Talbot, J., Meza, E., et al. 2016, The Astrophysical Journal, 819, L38, doi: 10.3847/2041-8205/819/2/L38
-
[61]
M., Tej, A., et al
Sicardy, B., Ashok, N. M., Tej, A., et al. 2021, Astrophysical Journal Letters, 923, L31
2021
-
[62]
Sickafoose, A. A., Bosh, A. S., Levine, S., et al. 2019, Icarus, 319, 657, doi: 10.1016/j.icarus.2018.10.016
-
[63]
2022, Monthly Notices of the Royal Astronomical Society, 551, 5550
Silva-Cabrera, J., Castro-Chac´ on, J., Reyes-Ruiz, M., et al. 2022, Monthly Notices of the Royal Astronomical Society, 551, 5550
2022
-
[64]
P., Babcock, B
Souza, S. P., Babcock, B. A., Pasachoff, J. M., et al. 2006, Publications of the Astronomical Society of the Pacific, 118, 1550
2006
-
[65]
J., Paegert, M., et al
Stassun, K., Oelkers, R. J., Paegert, M., et al. 2019, Astronomical Jounal, 158, article id. 138
2019
-
[66]
Steele, I. A., Bates, S. D., Gibson, N., et al. 2008, in Society of Photo-Optical Instrumentation Engineers (SPIE) Conference Series, Vol. 7014, Ground-based and Airborne Instrumentation for Astronomy II, ed. I. S. McLean & M. M. Casali, 70146J, doi: 10.1117/12.787889
-
[67]
2015, Science, 350, 249
Stern, S., Bagenal, F., Ennico, K., et al. 2015, Science, 350, 249
2015
-
[68]
A., Bagenal, F., Ennico, K., et al
Stern, S. A., Bagenal, F., Ennico, K., et al. 2015, Science, 350, aad1815, doi: 10.1126/science.aad1815
-
[69]
Toigo, A. D., Gierasch, P. J., Sicardy, B., & Lellouch, E. 2010, Icarus, 208, 402, doi: 10.1016/j.icarus.2010.01.027 van Belle, G. T. 1999, Publications of the Astronomical Society of the Pacific, 111, 1515
-
[70]
Virtanen, P., Gommers, R., Oliphant, T. E., et al. 2020, Nature Methods, 17, 261, doi: 10.1038/s41592-019-0686-2
-
[71]
2024, Mathematica,
Wolfram, I. 2024, Mathematica,
2024
-
[72]
V., & Elliot, J
Yelle, R. V., & Elliot, J. L. 1997, Atmospheric Structure and Composition: Pluto and Charon, ed. S. A. Stern & D. J. Tholen (Tucson: University of Arizona Press), 347–390
1997
-
[73]
2021, in AAS/Division for Planetary Sciences Meeting Abstracts, Vol
Young, E., Young, L., Johnson, P., & team, P. 2021, in AAS/Division for Planetary Sciences Meeting Abstracts, Vol. 53, id.307.06 44Sickafoose et al
2021
-
[74]
F., French, R
Young, E. F., French, R. G., Young, L. A., et al. 2008, Astronomical Journal, 136, 1757
2008
-
[75]
2013, Astrophysical Journal Letters, 766, L22
Young, L. 2013, Astrophysical Journal Letters, 766, L22
2013
-
[76]
Young, L. A. 2009, Astronomical Journal, 137, 3398
2009
-
[77]
Young, L. A. 2013, ApJL, 766, L22, doi: 10.1088/2041-8205/766/2/L22
-
[78]
2024, Comets III, 767, doi: 10.2458/azu{ }uapress{ }9780816553631-ch023
Young, L. A., Bertrand, T., Trafton, L. M., et al. 2021, in The Pluto System After New Horizons, ed. S. A. Stern, J. M. Moore, W. M. Grundy, L. A. Young, & R. P. Binzel (The University of Arizona Press), 321–361, doi: 10.2458/azu uapress 9780816540945-ch014
work page doi:10.2458/azu 2021
-
[79]
Young, L. A., & Person, M. J. 2025, PSJ, 6, 257, doi: 10.3847/PSJ/ae0e67
-
[80]
Young, L. A., Kammer, J. A., Steffl, A. J., et al. 2018, Icarus, 300, 174, doi: 10.1016/j.icarus.2017.09.006
-
[81]
2023, Astronomy and Astrophysics, 680, A9, doi: 10.1051/0004-6361/202347477
Yuan, Y., Li, F., Fu, Y., et al. 2023, Astronomy and Astrophysics, 680, A9, doi: 10.1051/0004-6361/202347477
discussion (0)
Sign in with ORCID, Apple, or X to comment. Anyone can read and Pith papers without signing in.