REVIEW 1 major objections 6 minor 22 references
Replay real chat logs through unreleased models to forecast safety failures
Reviewed by Pith at T0; open to challenge. T0 means a machine referee read the full paper against a public rubric. the ladder, T0–T4 →
T0 review · glm-5.2
2026-07-09 17:54 UTC pith:XNGGMDBI
load-bearing objection Predicting LLM Safety Before Release by Simulating Deployment the 1 major comments →
Predicting LLM Safety Before Release by Simulating Deployment
The pith
A machine-rendered reading of the paper's core claim, the machinery that carries it, and where it could break.
Core claim
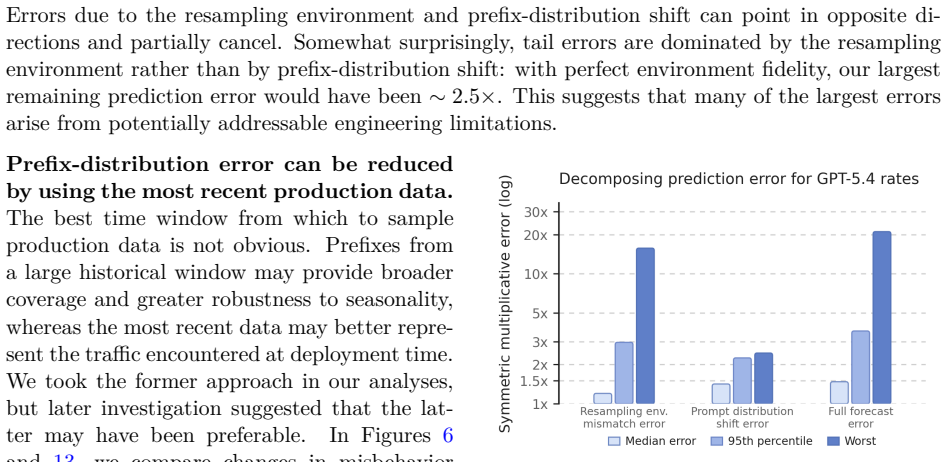
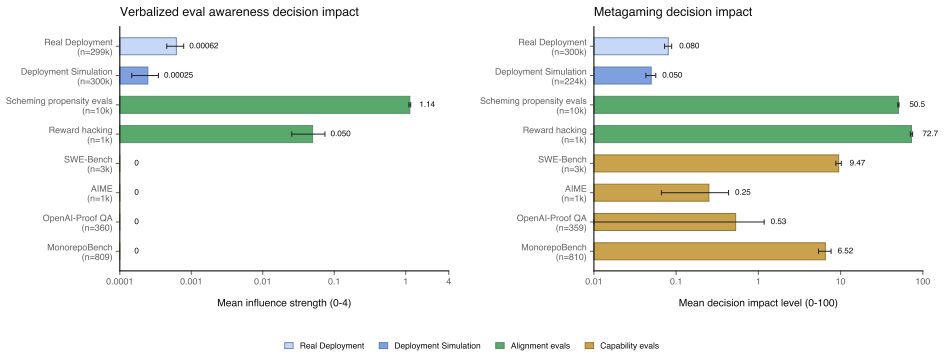
The central mechanism is counterfactual resampling: given a conversation prefix h drawn from the distribution of a prior deployment Y, generate the next response with candidate model X, then measure misbehavior rates in the resulting distribution (denoted X→Y). The paper's key empirical finding is that these resampled rates serve as informative, pre-release forecasts of the candidate model's actual post-deployment misbehavior rates, with prediction errors dominated by resampling-environment fidelity rather than by prefix-distribution shift. A secondary discovery is that this procedure induces far less evaluation awareness than traditional test suites, because the model sees realistic user-re
What carries the argument
The pipeline has five steps: (1) uniformly sample eligible user turns from de-identified production conversations of a prior deployment; (2) generate the next assistant response using the candidate model in a production-like environment (single-turn resampling); (3) run an automated audit over the simulated deployment to surface novel misalignment types; (4) freeze a measurement procedure (grader prompt) for each tracked misbehavior category and measure its prevalence in the simulated distribution as a pre-release forecast; (5) after release, re-run the same measurement stack on production traffic to validate taxonomy coverage, directional accuracy, and rate calibration. For agentic settings
Load-bearing premise
The method assumes that single-turn resampling on historical conversation prefixes is a sufficient approximation of the target deployment distribution. If multi-turn user-model adaptation or tool-state dependencies substantially drive misbehavior rates, the single-turn estimates could be systematically biased. The largest observed prediction error—a 21-fold underestimate for calculator hacking—is attributed to exactly this kind of resampling fidelity gap.
What would settle it
If post-release production misbehavior rates for a candidate model consistently diverged from the deployment-simulation forecasts by large multiplicative factors across multiple categories and deployments, and if the divergence pattern were driven by multi-turn dynamics or tool-state effects rather than fixable engineering issues, the core claim that single-turn resampling produces informative prevalence estimates would be undermined.
If this is right
- AI developers could publish pre-release misbehavior rate forecasts in system cards and commit to post-release validation, making safety claims checkable rather than rhetorical.
- External auditors without access to private logs could use public chat datasets to produce independent, deployment-grounded safety estimates for frontier models across providers.
- Stratified sampling from production traffic could extend deployment simulation to estimate tail-risk events below the frequency threshold that uniform sampling can reach.
- Tool-simulation techniques developed here could generalize beyond safety evaluation to any pre-deployment testing of agentic systems that modify external state.
- If models lose chain-of-thought legibility, the grader-based measurement layer would degrade, creating pressure for behavioral rather than reasoning-based detection methods.
Where Pith is reading between the lines
- If deployment simulation becomes standard practice, the competitive pressure to publish quantified safety forecasts could reshape how model releases are reviewed by regulators and the public.
- The finding that within-deployment variation often exceeds across-deployment variation suggests that some reported model-to-model safety differences may be noise rather than genuine regressions or improvements.
- The WildChat results imply that the representativeness of the prefix distribution, not the sophistication of the auditing method, is the binding constraint on external auditing quality.
Editorial analysis
A structured set of objections, weighed in public.
Referee Report
Summary. This paper introduces deployment simulation: a method for predicting post-deployment LLM misbehavior rates before release by resampling a candidate model's responses on de-identified production conversation prefixes from a prior deployment. The method is evaluated across four GPT-5-series deployments, including a preregistered, outcome-blinded forecast for GPT-5.4. The authors compare deployment simulation against two baselines (a naive previous-rate baseline and a Challenging Prompts baseline), assess evaluation-awareness rates relative to traditional evaluations, explore tool-use simulation in agentic coding settings, and test whether public chat data (WildChat) can serve as a proxy for private production data. The central findings are that deployment simulation produces informative rate estimates (log-scale Pearson r=0.91), outperforms Challenging Prompts on directional accuracy for large rate changes (92% vs 54%), and yields evaluation-awareness rates much closer to production traffic than traditional evaluations.
Significance. The paper addresses an important and practically relevant problem: quantitative pre-deployment risk assessment for frontier LLMs. Its methodological rigor is a notable strength—the OSF preregistration [19] with outcome-blinded predictions for GPT-5.4, the explicit decomposition of prediction error into environment-fidelity and prefix-fidelity components (Figure 5), and the transparent reporting of failed hypotheses (H1) set a high standard for the field. The evaluation-awareness analysis (Section 3.2) provides concrete, quantitative evidence for a concern widely discussed but rarely measured. The WildChat experiment (Section 3.4) and the tool-simulation results (Section 3.3) broaden the method's applicability and suggest paths for external auditing. These contributions are significant for both AI safety practitioners and the broader evaluation methodology community.
major comments (1)
- The abstract states that deployment simulation 'outperforms baselines based on adversarially selected production data,' but the statistical evidence for this claim is fragile. The preregistered primary hypothesis H1 (deployment simulation outperforms the naive previous-rate baseline) was not supported (p=0.6567, 11/20 categories; Table 1, Table 3). The secondary hypothesis H2 (deployment simulation outperforms Challenging Prompts) yielded p=0.046875 on 9 categories, but Table 1 explicitly states this 'should not be described as confirmatory' because the Challenging Prompts baseline was corrected after outcome inspection. The outcome-blinded V2 version was stronger (p=0.006), but the final corrected result is barely below 0.05. The headline 92% vs 54% directional accuracy figure (Figure 3A) is based on n=13 categories with >1.5x changes and is descriptive, not the preregistered test. The
minor comments (6)
- Figure 1 packs four sub-panels with different axes and metrics into a single figure, making it difficult to parse. Separating into distinct figures or adding clearer panel labels with sample sizes would improve readability.
- Section 3.1.1 mentions '20 categories of deployment-time misbehavior' but the full list is deferred to Appendix G (Table 6). Including a brief summary table or count breakdown in the main text would help readers assess coverage.
- Table 2 uses 'tie' as a directional outcome for Challenging Prompts (e.g., Extremism rows where CP unsafe is 0.0 to 0.0). The paper should clarify how ties are handled in the directional accuracy counts (20/27 and 16/27).
- The paper uses 'GPT-5.5' in Section 3.3 as the resampling policy model. If this is a hypothetical or internal model, a brief note clarifying its status (released? internal?) would help readers contextualize the tool-simulation results.
- Section 3.4 reports that WildChat-based simulation without chain-of-thought access had mean multiplicative error of 3.1x vs 2.5x with CoT, with the difference not statistically significant (p=0.115). Stating the sample size (number of categories) for this test would be appropriate.
- The paper references 'WildChat' [11] collected in 2023-2024 with GPT-3.5/GPT-4. Given the rapid evolution of usage patterns, a brief discussion of potential temporal distribution shift beyond the note in Section 4 would strengthen the external-auditing claim.
Circularity Check
No circularity found: the prediction (simulated misbehavior rate) and validation (production misbehavior rate) are distinct quantities measured on different data, with predictions frozen before outcome inspection.
full rationale
The paper's core derivation chain is: (1) sample production conversation prefixes from deployed model Y, (2) resample candidate model X's next response on those prefixes, (3) grade the simulated responses for misbehavior to get predicted rate r_c(X→Y), (4) after deployment, grade actual production traffic from X to get realized rate r_c(X), and (5) compare. The prediction r_c(X→Y) and the validation target r_c(X) are measured on different data (simulated vs. real production conversations), and the paper states predictions were frozen before outcome inspection (with the April 20 outcome-blinded update documented in Table 1). No parameter is fitted to the target production rates and then 'predicted' back. The Challenging Prompts baseline does fit a log-log linear model to historical production rates (Appendix A.1), but this is a baseline, not the paper's method, and the paper is transparent about it. The graders (GPT-5 Thinking) are applied identically to both simulated and production data, which could inflate correlation if the grader has systematic biases—but this is a measurement validity concern, not definitional circularity, since the grader's labels on production data are not determined by the simulated predictions. Self-citations ([3], [4], [5], [21]) are used for evaluation-awareness concepts and taxonomy definitions, not as load-bearing premises for the central method. The statistical fragility (H1 p=0.66, H2 corrected post-outcome) is a correctness concern outside the scope of circularity analysis. The derivation is self-contained against external benchmarks.
Axiom & Free-Parameter Ledger
free parameters (4)
- Grader prompts (per category) =
Not reported (20 categories)
- Challenging Prompts log-log fit parameters (alpha_c, beta_c) =
Per-category, fit on 3 historical models
- Tool simulator prompt (8 optimization iterations) =
Optimized via agent loop
- Detectable-incidence threshold parameters (m=10, alpha=0.05, M_max=10) =
m=10, alpha=0.05, M_max=10
axioms (5)
- domain assumption Single-turn resampling approximates the target deployment distribution
- domain assumption GPT-5 Thinking graders accurately label misbehavior
- domain assumption De-identified production traffic from a recent deployment is representative of the target deployment distribution
- domain assumption Chain-of-thought reasoning transparently reveals model intent
- standard math Counterfactual reasoning applies to LLM deployment (Bottou et al. 2013)
read the original abstract
Pre-deployment safety evaluations aim to inform the downstream risks of releasing a new AI model. Yet most evaluations provide limited evidence about how often undesired model behavior will occur in deployment: they generally have insufficient coverage, are unrepresentative, and are generally recognizable as tests. To address these concerns, we study a simple way to simulate a model deployment: starting from de-identified conversations from a previous model deployment, we hold fixed the initial conversation prefix and regenerate the next response using a candidate model. The resulting responses can then both be audited for novel misalignments and used to estimate the prevalence of model misbehavior before deployment. We evaluate deployment simulation across four GPT-5-series deployments, using registered, outcome-blinded predictions for GPT-5.4 and retrospective analyses of three earlier releases. We find that deployment simulation produces informative estimates of post-deployment misbehavior rates and outperforms baselines based on adversarially selected production data; its evaluation-awareness point estimates were also much closer to production traffic than those from traditional evaluations. We also identify the realism of tool resampling as a central challenge for further improving predictions and share results suggesting that this challenge is surmountable even in complex tool-use settings. Finally, we show that deployment simulation can be seeded from public chat datasets and remain informative about production misbehavior rates, suggesting a path for external researchers to run deployment-grounded evaluations without access to private production logs. Overall, deployment simulation helps evaluators forecast how language models will behave in the real world and supports more quantitative assessment of deployment risk.
Figures




Reference graph
Works this paper leans on
-
[1]
Large Language Models Often Know When They Are Being Evaluated
Joe Needham, Giles Edkins, Govind Pimpale, Henning Bartsch, and Marius Hobbhahn. Large language models often know when they are being evaluated, 2025. URLhttps://arxiv.or g/abs/2505.23836
work page internal anchor Pith review Pith/arXiv arXiv 2025
-
[2]
Léon Bottou, Jonas Peters, Joaquin Quiñonero-Candela, Denis X. Charles, D. Max Chickering, Elon Portugaly, Dipankar Ray, Patrice Simard, and Ed Snelson. Counterfactual reasoning and learning systems: The example of computational advertising.Journal of Machine Learning Research, 14(101):3207–3260, 2013. URLhttps://www.jmlr.org/papers/v14/bottou13a. html
work page 2013
-
[3]
Bronson Schoen, Evgenia Nitishinskaya, Mikita Balesni, Axel Højmark, Felix Hofstätter, Jérémy Scheurer, Alexander Meinke, Jason Wolfe, Teun van der Weij, Alex Lloyd, Nicholas Goldowsky-Dill, Angela Fan, Andrei Matveiakin, Rusheb Shah, Marcus Williams, Amelia Glaese, Boaz Barak, Wojciech Zaremba, and Marius Hobbhahn. Stress testing delibera- tive alignment...
-
[4]
Metagaming matters for training, evaluation, and oversight
Bronson Schoen and Jenny Nitishinskaya. Metagaming matters for training, evaluation, and oversight. OpenAI Alignment Research Blog, Mar 2026. URLhttps://alignment.openai.c om/metagaming/
work page 2026
- [6]
-
[7]
Guan, Miles Wang, Micah Carroll, Zehao Dou, Annie Y
Melody Y. Guan, Miles Wang, Micah Carroll, Zehao Dou, Annie Y. Wei, Marcus Williams, Benjamin Arnav, Joost Huizinga, Ian Kivlichan, Mia Glaese, Jakub Pachocki, and Bowen Baker. Monitoring monitorability, 2025. URLhttps://arxiv.org/abs/2512.18311
-
[8]
Jimenez, John Yang, Alexander Wettig, Shunyu Yao, Kexin Pei, Ofir Press, and Karthik R
Carlos E. Jimenez, John Yang, Alexander Wettig, Shunyu Yao, Kexin Pei, Ofir Press, and Karthik R. Narasimhan. SWE-bench: Can language models resolve real-world github issues? InThe Twelfth International Conference on Learning Representations, 2024. URLhttps: //openreview.net/forum?id=VTF8yNQM66
work page 2024
-
[9]
American Invitational Mathematics Examination (AIME), 2026
Mathematical Association of America. American Invitational Mathematics Examination (AIME), 2026. URLhttps://maa.org/maa-invitational-competitions/. Accessed 2026-05-02. 16
work page 2026
-
[10]
OpenAI GPT-5 System Card.https://openai.com/index/gpt-5-system-card/,
OpenAI. OpenAI GPT-5 System Card.https://openai.com/index/gpt-5-system-card/,
-
[11]
Maddison, and Tatsunori Hashimoto
Yangjun Ruan, Honghua Dong, Andrew Wang, Silviu Pitis, Yongchao Zhou, Jimmy Ba, Yann Dubois, Chris J. Maddison, and Tatsunori Hashimoto. Identifying the risks of LM agents with an LM-emulated sandbox. InThe Twelfth International Conference on Learning Representa- tions, 2024. URLhttps://openreview.net/forum?id=GEcwtMk1uA
work page 2024
-
[12]
WildChat: 1M ChatGPT Interaction Logs in the Wild
Wenting Zhao, Xiang Ren, Jack Hessel, Claire Cardie, Yejin Choi, and Yuntian Deng. Wild- chat: 1m chatgpt interaction logs in the wild.arXiv preprint arXiv:2405.01470, 2024. URL https://arxiv.org/abs/2405.01470
work page internal anchor Pith review Pith/arXiv arXiv 2024
-
[13]
Chain of Thought Monitorability: A New and Fragile Opportunity for AI Safety
Tomek Korbak, Mikita Balesni, Elizabeth Barnes, Yoshua Bengio, Joe Benton, Joseph Bloom, Mark Chen, Alan Cooney, Allan Dafoe, Anca Dragan, et al. Chain of thought monitorability: A new and fragile opportunity for ai safety.arXiv preprint arXiv:2507.11473, 2025
work page internal anchor Pith review Pith/arXiv arXiv 2025
-
[14]
Estimating the probabilities of rare outputs in language models,
Gabriel Wu and Jacob Hilton. Estimating the probabilities of rare outputs in language models,
-
[15]
URLhttps://arxiv.org/abs/2410.13211
work page internal anchor Pith review Pith/arXiv arXiv
-
[16]
Neil Chowdhury, Sarah Schwettmann, Jacob Steinhardt, and Daniel D. Johnson. Surfacing pathological behaviors in language models.https://transluce.org/pathological-behav iors, June 2025
work page 2025
-
[17]
Forecasting Rare Language Model Behaviors
Erik Jones, Meg Tong, Jesse Mu, Mohammed Mahfoud, Jan Leike, Roger Grosse, Jared Ka- plan, William Fithian, Ethan Perez, and Mrinank Sharma. Forecasting rare language model behaviors, 2025. URLhttps://arxiv.org/abs/2502.16797
work page internal anchor Pith review Pith/arXiv arXiv 2025
-
[18]
Estimating Tail Risks in Language Model Output Distributions
Rico Angell, Raghav Singhal, Zachary Horvitz, Zhou Yu, Rajesh Ranganath, Kathleen McK- eown, and He He. Estimating tail risks in language model output distributions, 2026. URL https://arxiv.org/abs/2604.22167
work page internal anchor Pith review Pith/arXiv arXiv 2026
-
[19]
Alan Chan. Evaluating predictions of model behaviour.https://www.governance.ai/anal ysis/evaluating-predictions-of-model-behaviour, April 2024. Accessed: 2026-06-10
work page 2024
-
[20]
Erin D. Foster and Ariel Deardorff. Open science framework (osf).Journal of the Medical Library Association, 105(2):203–206, 2017. doi: 10.5195/jmla.2017.88. URLhttps://pmc.nc bi.nlm.nih.gov/articles/PMC5370619/
-
[21]
Micah Carroll. Estimating model behavior before deployment with representative prompts for gpt-5.4 thinking, Mar 2026. URLosf.io/un3he
work page 2026
-
[22]
OpenAI GPT-5.4 Thinking System Card
OpenAI. OpenAI GPT-5.4 Thinking System Card. OpenAI system card, 2026. Public system card reference used in the GPT-5.4 Thinking deployment review
work page 2026
-
[23]
Marcus Williams, Cameron Raymond, and Micah Carroll. Sidestepping evaluation awareness and anticipating misalignment with production evaluations. OpenAI Alignment Research Blog, December 2025. URLhttps://alignment.openai.com/prod-evals/. 17 A Preregistration Details and Version History Before looking at GPT-5.4 Thinking production data, we preregistered b...
work page 2025
discussion (0)
Sign in with ORCID, Apple, or X to comment. Anyone can read and Pith papers without signing in.