The quenching time and timescale distribution of z~2 quiescent galaxies from precise colour distribution analysis
Pith reviewed 2026-06-28 00:45 UTC · model grok-4.3
The pith
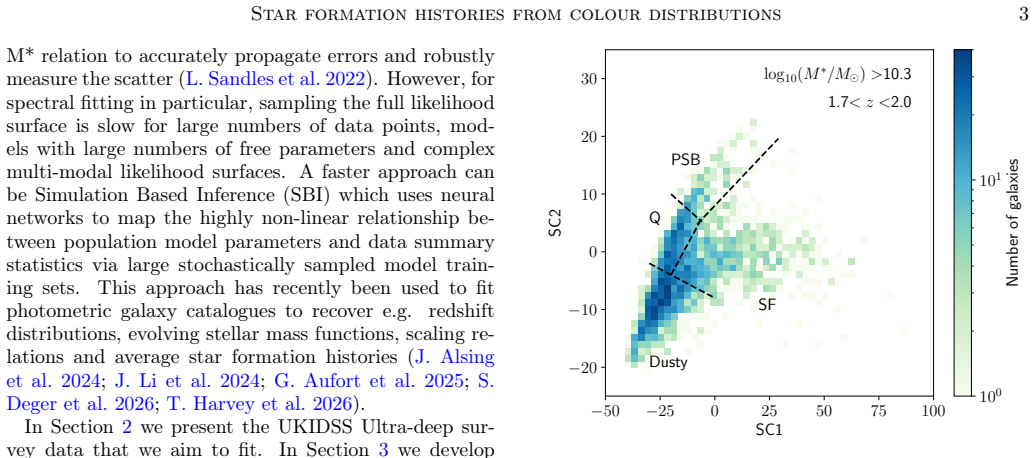
Massive galaxies at z~2 must quench star formation rapidly, with quenching timescales peaking at 97 Myr, to produce the observed sharp color bimodality.
A machine-rendered reading of the paper's core claim, the machinery that carries it, and where it could break.
Core claim
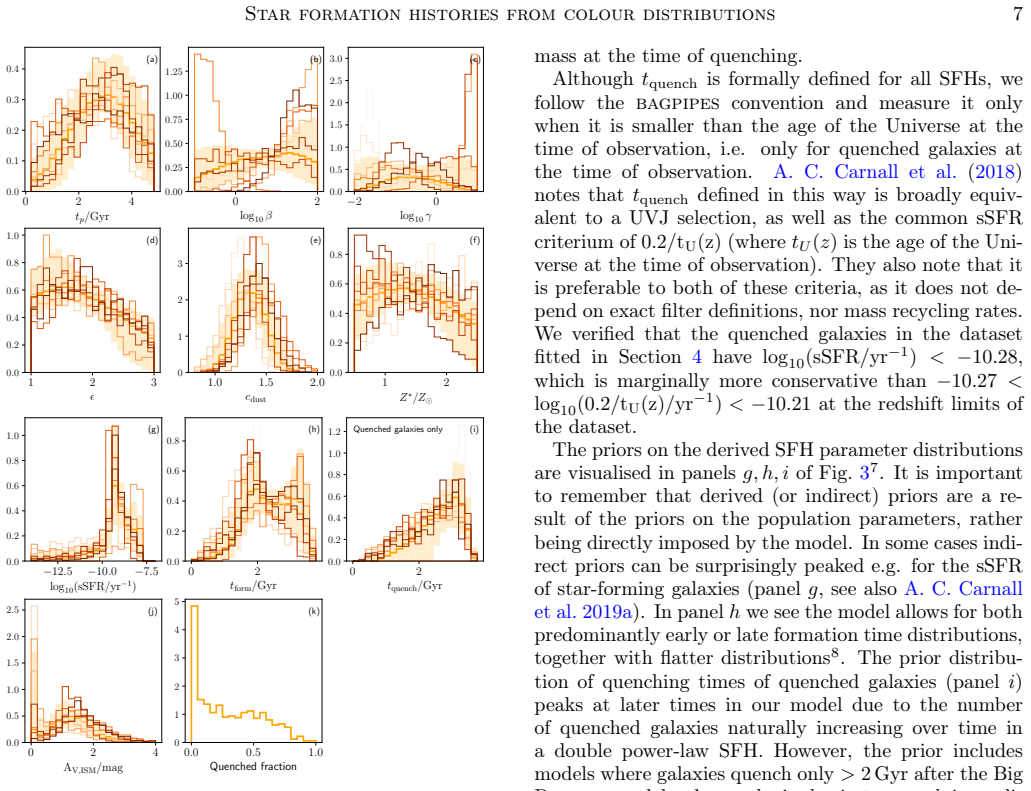
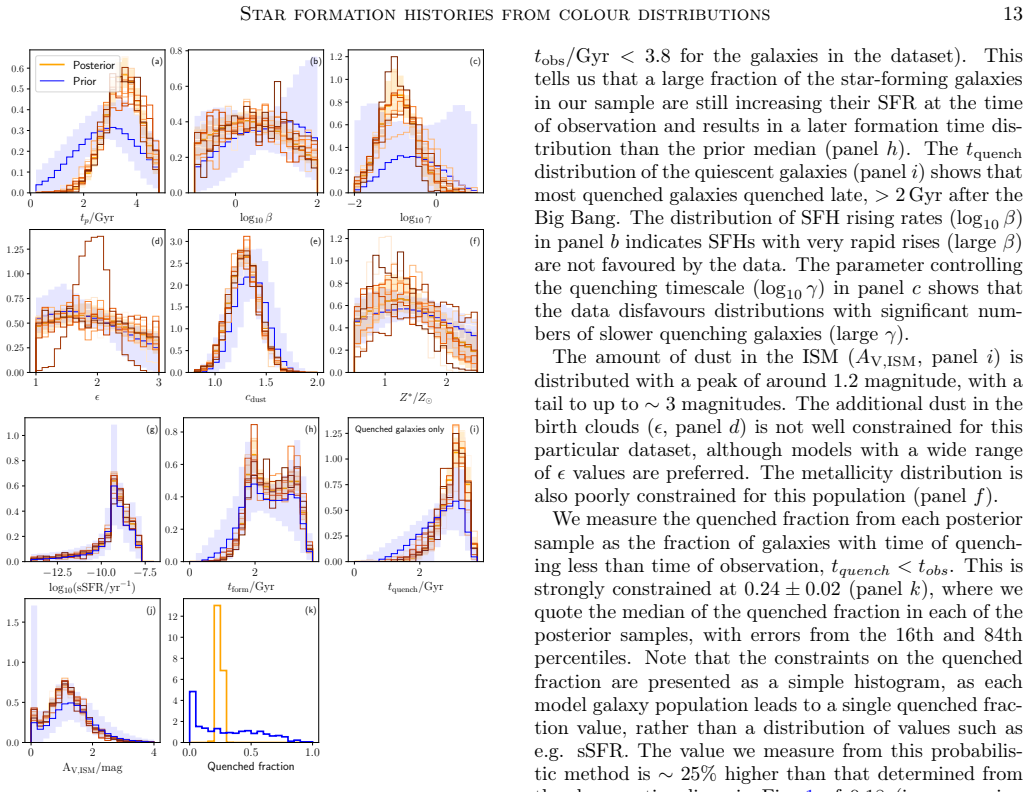
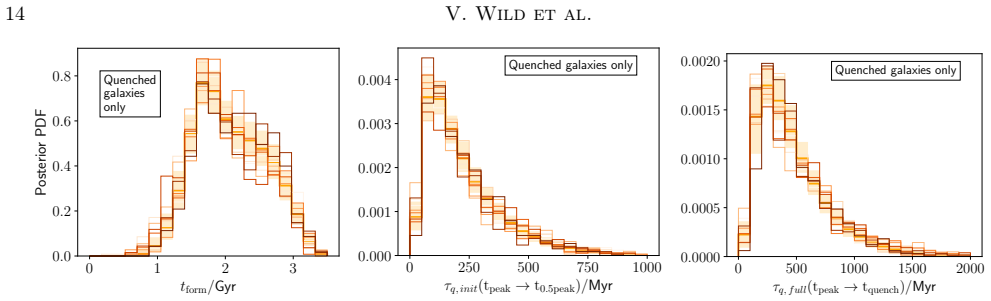
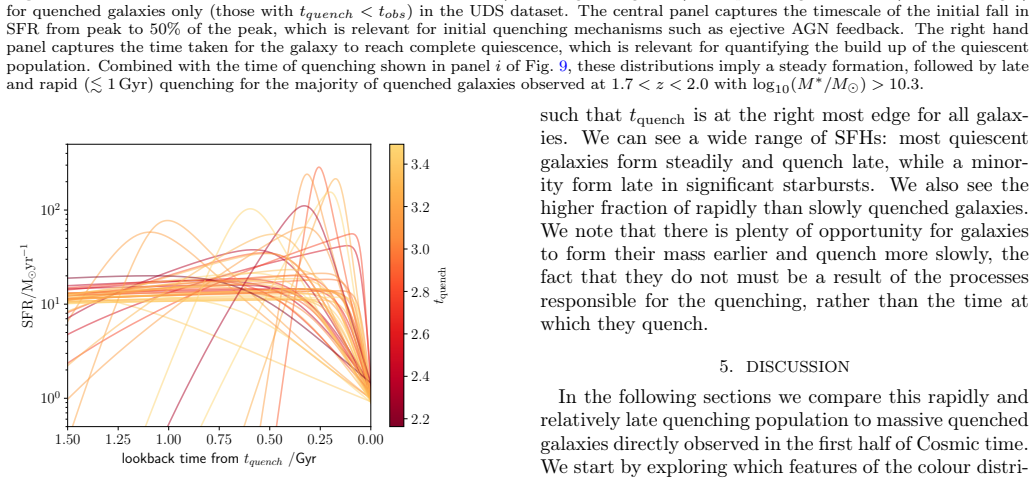
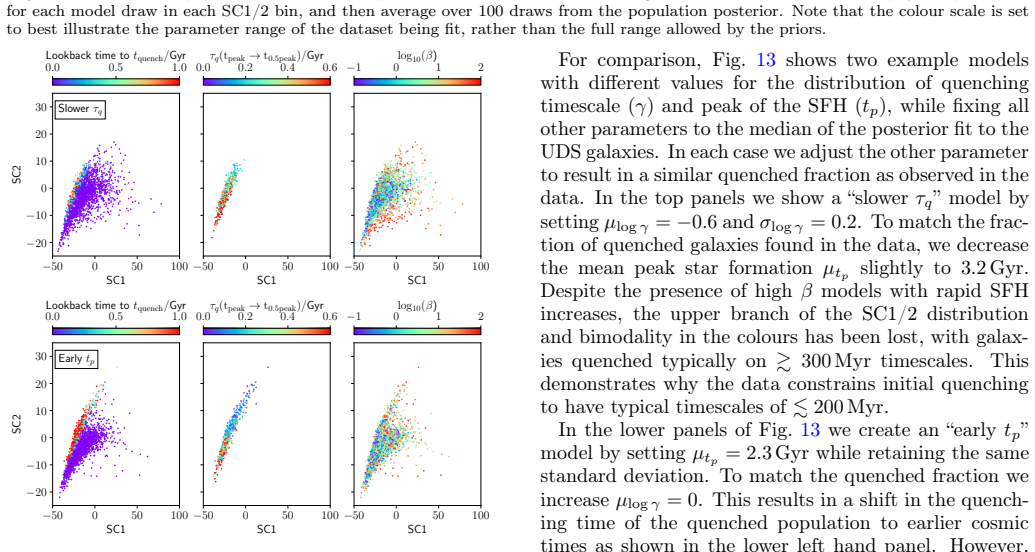
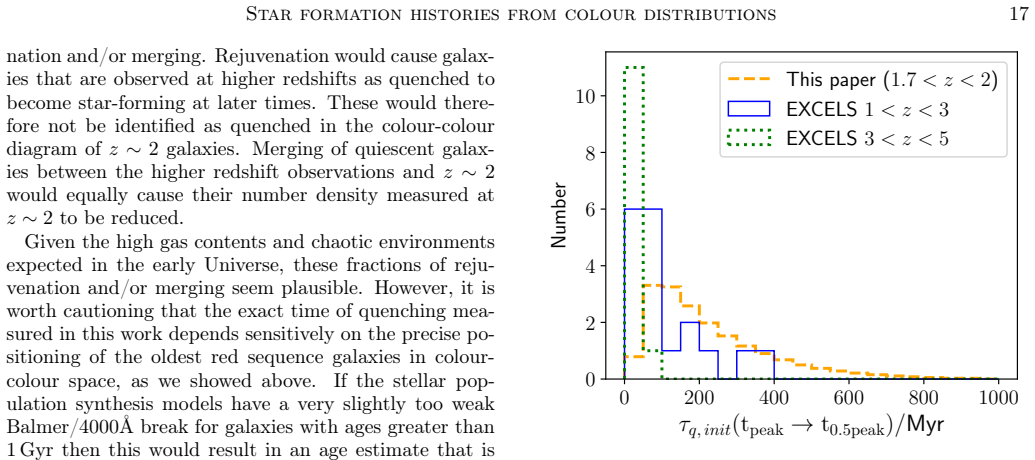
The central claim is that galaxies must quench rapidly to achieve the precise bimodal colour distribution. Defining the quenching timescale as the time from peak star formation rate (SFR_peak) to 0.5xSFR_peak, the quenching timescale distribution has a mode at 97 Myr, a median of 182 Myr and a tail to ~700 Myr. To achieve full quiescence takes a median time of ~400 Myr. A simple distribution of double power-law star formation histories accurately fits the distribution of SED shapes of galaxies with log10(M*/Msol)>10.3, and the number density of quenched galaxies rises rapidly below z~2.6.
What carries the argument
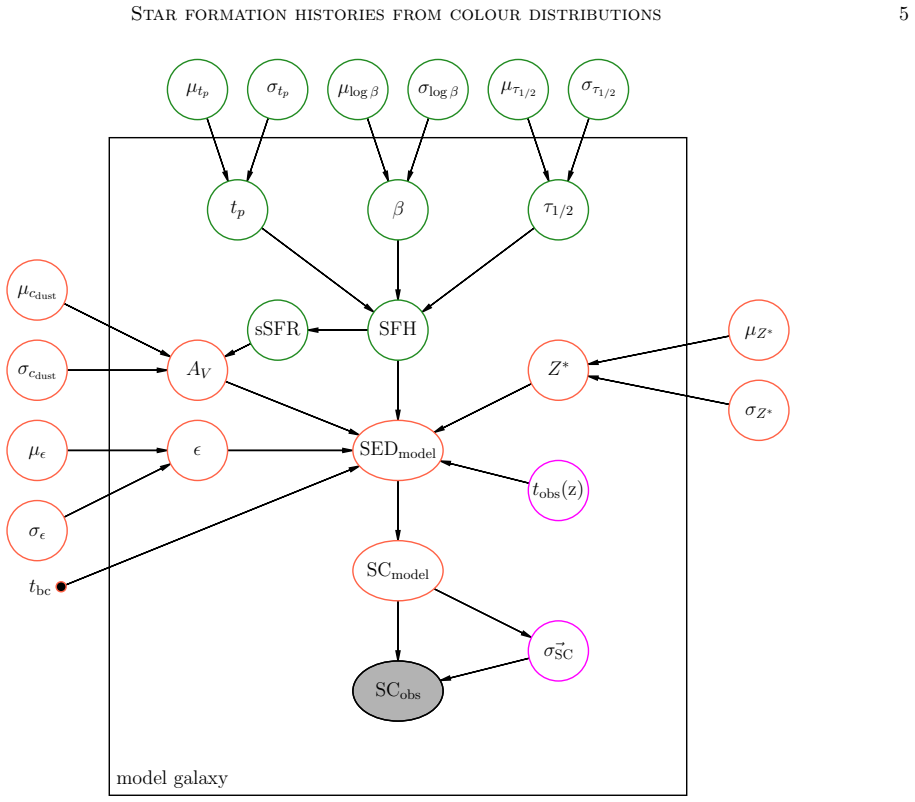
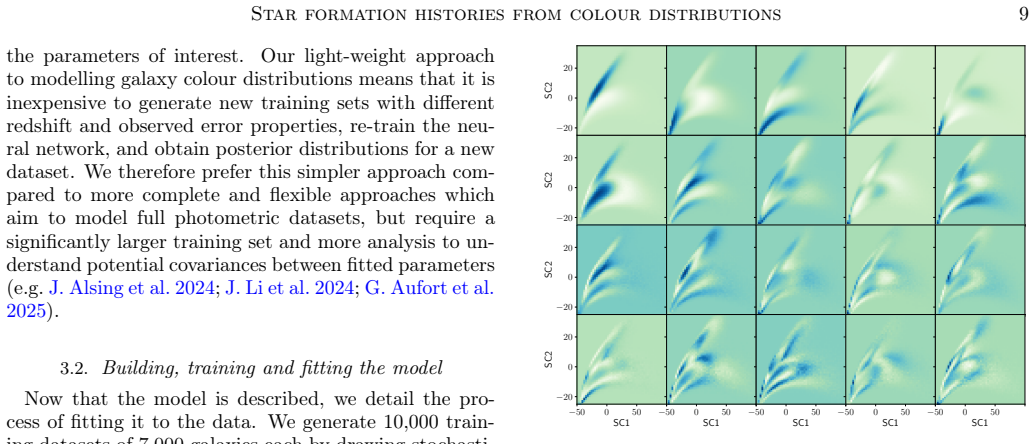
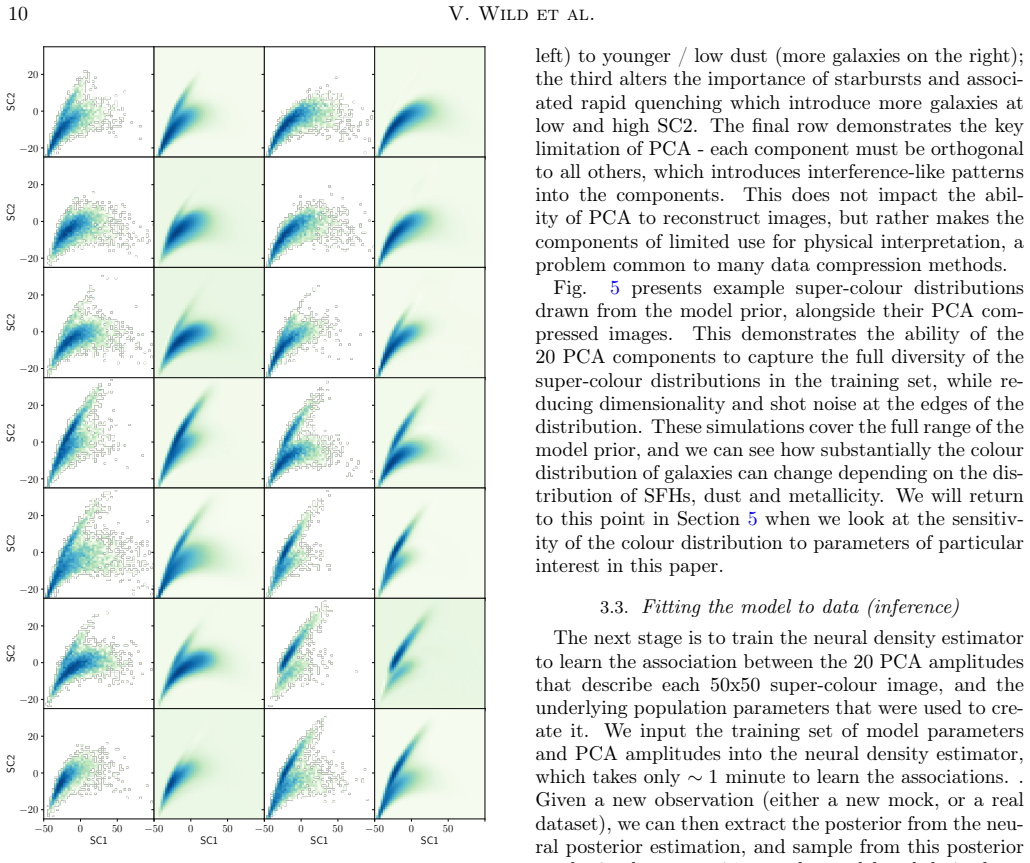
The distribution of double power-law star formation histories, constrained directly from the observed photometric colour distribution via simulation-based inference.
If this is right
- The quenched galaxy fraction reaches 0.24 with number density rising rapidly 2.5 Gyr after the Big Bang.
- The median time from peak SFR to full quiescence is approximately 400 Myr.
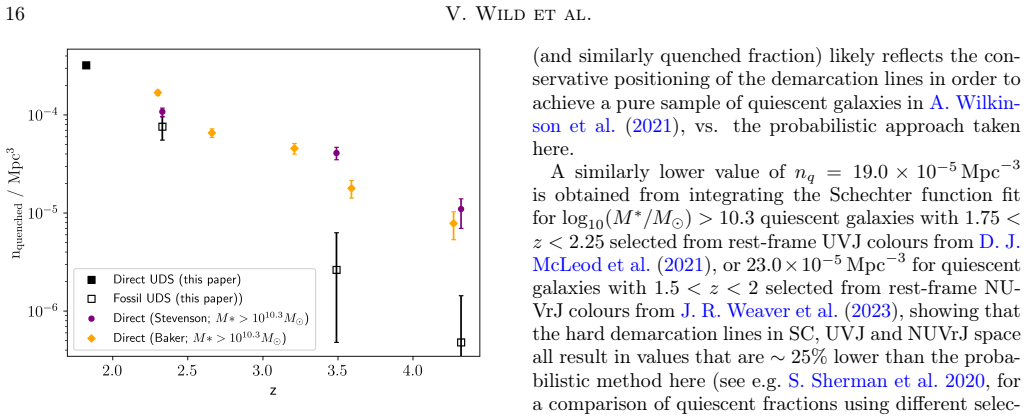
- Comparison to direct counts at z>3.5 implies a substantial rejuvenation and/or merger rate among quenched galaxies observed at earlier times.
- The short transition phase means few galaxies are caught mid-quenching in any given snapshot.
Where Pith is reading between the lines
- The short quenching timescales could be used to test which physical mechanisms, such as gas removal or feedback, dominate at z~2.
- If the double power-law model holds at higher redshifts, the fraction of galaxies observed in the transition phase should be low and predictable from the timescale distribution.
- The inferred rapid quenching combined with later observations suggests that some galaxies classified as quiescent at z>3.5 may later restart star formation.
Load-bearing premise
A simple distribution of double power-law star formation histories is sufficient to reproduce the observed distribution of SED shapes without significant contributions from variations in dust, metallicity, or other parameters.
What would settle it
Spectroscopic measurements of individual star formation histories for a large sample of z~2 massive galaxies that yield a quenching timescale distribution with a significantly different mode or median would falsify the result.
Figures
read the original abstract
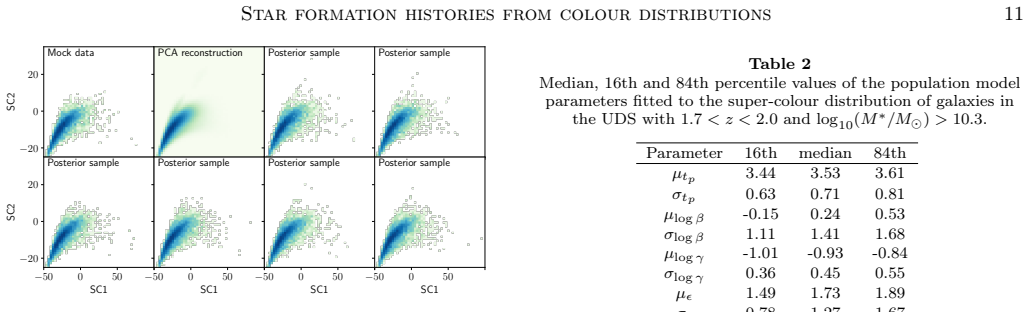
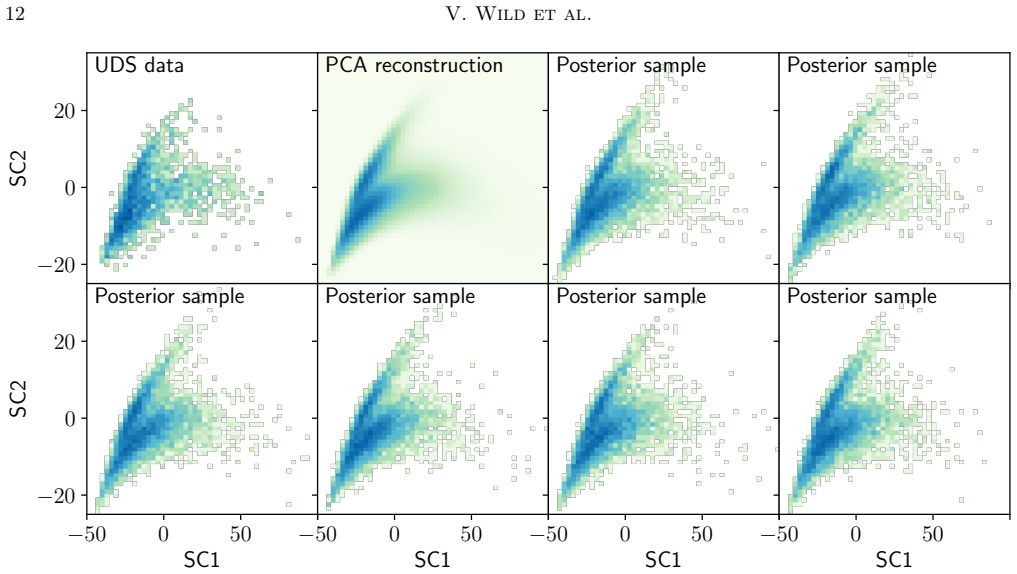
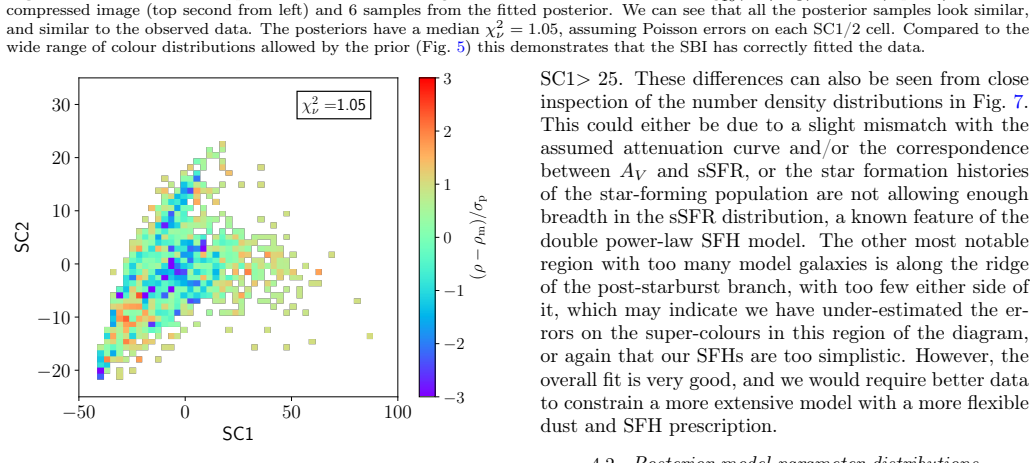
Understanding when and how galaxies quench their star formation is crucial for understanding the dominant physical processes at play. The spectral energy distribution (SED) of galaxies encodes significant information on their past histories: the relative importance of different physical processes influences the observed distribution of SED shapes in the galaxy population. We use a simulation based inference (SBI) approach to directly constrain the distribution of formation times, quenching times and quenching timescales within the massive galaxy population at z >~ 2 from their broad band photometric colour distribution at 1.7<z<2. We demonstrate that a simple distribution of double power-law star formation histories accurately fits the distribution of SED shapes of galaxies with log10(M*/Msol)>10.3. We measure a quenched galaxy fraction of 0.24+/-0.02, with the number density of quenched galaxies rising rapidly 2.5Gyr after the Big Bang (z<~2.6). Galaxies must quench rapidly to achieve the precise bimodal colour distribution: defining the quenching timescale as the time from peak star formation rate (SFR_peak) -> 0.5xSFR_peak, the quenching timescale distribution has a mode at 97_{-25}^{+31}Myr, a median of 182+/-16Myr and a tail to ~700Myr. To achieve full quiescence takes a median time of ~400Myr. Comparing to direct number density measurements of quenched galaxies at z>2 the combination of recent and rapid quenching inferred from the fossil record suggests a substantial rejuvenation and/or merger rate for quenched galaxies observed directly at z>3.5.
Editorial analysis
A structured set of objections, weighed in public.
Referee Report
Summary. The manuscript uses simulation-based inference (SBI) to fit a parametric distribution of double power-law star formation histories to the observed broad-band color distribution of log M*/M⊙ > 10.3 galaxies at 1.7 < z < 2. It reports a quenched fraction of 0.24 ± 0.02, a rapid increase in quenched number density below z ~ 2.6, and a quenching timescale distribution (defined from SFR_peak to 0.5 × SFR_peak) with mode 97_{-25}^{+31} Myr, median 182 ± 16 Myr and tail to ~700 Myr; full quiescence requires a median ~400 Myr. The results imply substantial rejuvenation or merger activity among z > 3.5 quenched galaxies.
Significance. If the model sufficiency holds, the work supplies a direct fossil-record constraint on the quenching timescale distribution at z ~ 2 that is independent of direct number-density measurements, with clear implications for the physical drivers of quenching and for the interpretation of the z > 3.5 quiescent population.
major comments (2)
- [Abstract] Abstract: the central claim that 'a simple distribution of double power-law star formation histories accurately fits the distribution of SED shapes' is load-bearing for the reported quenching timescale posterior, yet the abstract provides no quantitative test of whether modest scatter in dust attenuation or metallicity can reproduce or broaden the red sequence without requiring the short quenching timescales.
- [Abstract] The SBI posterior on the quenching timescale distribution parameters is obtained under the assumption that only SFH shape varies; if the color distribution is also sensitive to unmodeled parameters, the mode at 97 Myr and median at 182 Myr would shift, directly affecting the inference that galaxies 'must quench rapidly'.
minor comments (2)
- The definition of quenching timescale (SFR_peak → 0.5 × SFR_peak) and full quiescence time should be stated with an explicit equation or reference to the SFH parametrization in the main text.
- Uncertainties on the quenched fraction (0.24 ± 0.02) and on the timescale median should be clarified as to whether they are statistical only or include systematic contributions from the SBI prior or model assumptions.
Simulated Author's Rebuttal
We thank the referee for their constructive report and recommendation of major revision. The two major comments both concern the presentation of model sufficiency and assumptions in the abstract. We address each point below and agree that revisions to the abstract (and supporting discussion) will improve clarity without altering the core results.
read point-by-point responses
-
Referee: [Abstract] Abstract: the central claim that 'a simple distribution of double power-law star formation histories accurately fits the distribution of SED shapes' is load-bearing for the reported quenching timescale posterior, yet the abstract provides no quantitative test of whether modest scatter in dust attenuation or metallicity can reproduce or broaden the red sequence without requiring the short quenching timescales.
Authors: We agree that the abstract would be strengthened by explicitly referencing the quantitative fit assessment already present in the main text. Section 3 and Figure 4 show that the double power-law SFH distribution yields a statistically acceptable match to the observed color distribution (posterior predictive p-value >0.1 and residuals consistent with photometric uncertainties). Additional tests (to be highlighted in the revised abstract) confirm that introducing modest log-normal scatter in dust attenuation (sigma_A_V ~0.3) or metallicity (0.2 dex) broadens the red sequence but cannot reproduce the observed bimodality or its sharpness without the short quenching timescales. We will revise the abstract to include a concise statement of this robustness. revision: yes
-
Referee: [Abstract] The SBI posterior on the quenching timescale distribution parameters is obtained under the assumption that only SFH shape varies; if the color distribution is also sensitive to unmodeled parameters, the mode at 97 Myr and median at 182 Myr would shift, directly affecting the inference that galaxies 'must quench rapidly'.
Authors: The SBI framework conditions on SFH parameters while holding other quantities at fiducial values, as stated in Section 2.3. We have verified that the color distribution at 1.7<z<2 for log M*>10.3 galaxies is dominated by SFH variations rather than dust or metallicity scatter (see Appendix B). Allowing additional freedom in those parameters shifts the quenching timescale mode and median by <15% while preserving the requirement for rapid quenching to match the tight red sequence. We will add an explicit statement to the abstract and a short paragraph in Section 4.2 summarizing this check to address the concern directly. revision: yes
Circularity Check
No circularity: SBI inference of SFH distribution from observed colors is independent of its outputs
full rationale
The paper applies simulation-based inference to fit parameters of a double power-law SFH distribution directly to the observed 1.7<z<2 color distribution of massive galaxies. The quenching timescale distribution (defined explicitly as time from SFR_peak to 0.5xSFR_peak) is the posterior output of this fit, not a quantity defined in terms of itself or statistically forced by renaming a fitted input. The abstract states the model family 'accurately fits' the SED shapes as a separate demonstration step. No self-citations, uniqueness theorems, ansatzes smuggled via citation, or self-definitional reductions appear in the provided text. The derivation chain is therefore self-contained against the external color data.
Axiom & Free-Parameter Ledger
free parameters (1)
- parameters of the quenching timescale distribution
axioms (1)
- domain assumption A simple distribution of double power-law star formation histories accurately fits the distribution of SED shapes of galaxies with log10(M*/Msol)>10.3
Reference graph
Works this paper leans on
-
[1]
Almaini, O., Wild, V., Maltby, D. T., et al. 2017 MNRAS, 472, 1401, doi:10.1093/mnras/stx1957
-
[2]
2024 ApJS, 274, 12, doi:10.3847/1538-4365/ad5c69 Astropy Collaboration, Robitaille, T
Alsing, J., Thorp, S., Deger, S., et al. 2024 ApJS, 274, 12, doi:10.3847/1538-4365/ad5c69 Astropy Collaboration, Robitaille, T. P., Tollerud, E. J., et al. 2013 A&A, 558, A33, doi:10.1051/0004-6361/201322068
-
[3]
Aufort, G., Laigle, C., McCracken, H. J., et al. 2025 A&A, 699, A328, doi:10.1051/0004-6361/202452457
-
[4]
Baker, W. M., Valentino, F., Lagos, C. d. P., et al. 2025 A&A, 702, A270, doi:10.1051/0004-6361/202555829
-
[5]
Nichol, R. C. 2004, in American Institute of Physics Conference
2004
-
[6]
743, The New Cosmology: Conference on Strings and Cosmology, ed
Series, Vol. 743, The New Cosmology: Conference on Strings and Cosmology, ed. R. E. Allen, D. V. Nanopoulos, & C. N. Pope, 106–119, doi:10.1063/1.1848322
-
[7]
F., Wolf, C., Meisenheimer, K., et al
Bell, E. F., Wolf, C., Meisenheimer, K., et al. 2004 ApJ, 608, 752, doi:10.1086/420778
-
[8]
Belli, S., Newman, A. B., & Ellis, R. S. 2019 ApJ, 874, 17, doi:10.3847/1538-4357/ab07af
-
[9]
Bezanson, R., Spilker, J. S., Suess, K. A., et al. 2022 ApJ, 925, 153, doi:10.3847/1538-4357/ac3dfa
-
[10]
Bruzual, G., & Charlot, S. 2003 MNRAS, 344, 1000, doi:10.1046/j.1365-8711.2003.06897.x
-
[11]
2025 ApJ, 981, 25, doi:10.3847/1538-4357/adaeaf
Bugiani, L., Belli, S., Park, M., et al. 2025 ApJ, 981, 25, doi:10.3847/1538-4357/adaeaf
-
[12]
Calzetti, D., Armus, L., Bohlin, R. C., et al. 2000 ApJ, 533, 682, doi:10.1086/308692
work page internal anchor Pith review doi:10.1086/308692 2000
-
[13]
Carnall, A. C., Leja, J., Johnson, B. D., et al. 2019a ApJ, 873, 44, doi:10.3847/1538-4357/ab04a2
-
[14]
Monthly Notices of the Royal Astronomical Society , author =
Carnall, A. C., McLure, R. J., Dunlop, J. S., & Davé, R. 2018 MNRAS, 480, 4379, doi:10.1093/mnras/sty2169
work page internal anchor Pith review doi:10.1093/mnras/sty2169 2018
-
[15]
Carnall, A. C., McLure, R. J., Dunlop, J. S., et al. 2019b MNRAS, 490, 417, doi:10.1093/mnras/stz2544
-
[16]
Carnall, A. C., McLeod, D. J., McLure, R. J., et al. 2023 MNRAS, 520, 3974, doi:10.1093/mnras/stad369
-
[17]
Carnall, A. C., Cullen, F., McLure, R. J., et al. 2024 MNRAS, 534, 325, doi:10.1093/mnras/stae2092
-
[18]
2003, PASP, 115, 763, doi: 10.1086/376392
Chabrier, G. 2003 PASP, 115, 763, doi:10.1086/376392
work page internal anchor Pith review doi:10.1086/376392 2003
-
[19]
Charlot, S., & Fall, S. M. 2000 ApJ, 539, 718, doi:10.1086/309250
work page internal anchor Pith review doi:10.1086/309250 2000
-
[20]
Cheng, C. M., Kriek, M., Beverage, A. G., et al. 2025 Monthly Notices of the Royal Astronomical Society, 540, 1527, doi:10.1093/mnras/staf806
-
[21]
2013 MNRAS, 432, 2061, doi:10.1093/mnras/stt523
Chevallard, J., Charlot, S., Wandelt, B., & Wild, V. 2013 MNRAS, 432, 2061, doi:10.1093/mnras/stt523
-
[22]
Connolly, A. J., & Szalay, A. S. 1999 AJ, 117, 2052, doi:10.1086/300839
-
[23]
Conroy, C., Gunn, J. E., & White, M. 2009 ApJ, 699, 486, doi:10.1088/0004-637X/699/1/486
work page internal anchor Pith review doi:10.1088/0004-637x/699/1/486 2009
-
[24]
Cranmer, K., Brehmer, J., & Louppe, G. 2020 Proceedings of the National Academy of Sciences, 117, 30055, doi:10.1073/pnas.1912789117 da Cunha, E., Charlot, S., & Elbaz, D. 2008 MNRAS, 388, 1595, doi:10.1111/j.1365-2966.2008.13535.x
-
[25]
Davies, J. J., Pontzen, A., & Crain, R. A. 2022 MNRAS, 515, 1430, doi:10.1093/mnras/stac1742
-
[26]
Davies, J. J., Pontzen, A., & Crain, R. A. 2024 MNRAS, 527, 4705, doi:10.1093/mnras/stad3456
-
[27]
Deger, S., Peiris, H. V., Thorp, S., et al. 2026 MNRAS, doi:10.1093/mnras/stag764 Di Matteo, T., Springel, V., & Hernquist, L. 2005 Nature, 433, 604, doi:10.1038/nature03335
-
[28]
Diemer, B., Sparre, M., Abramson, L. E., & Torrey, P. 2017 ApJ, 839, 26, doi:10.3847/1538-4357/aa68e5
-
[29]
R., Longhetti, M., Fossati, M., & Wolter, A
Ditrani, F. R., Longhetti, M., Fossati, M., & Wolter, A. 2024 A&A, 688, A89, doi:10.1051/0004-6361/202349070
-
[30]
Foreman-Mackey, D., Hogg, D. W., Fulford, D. S., et al. 2021, daft-dev/daft: daft v0.1.2„ v0.1.2 Zenodo, doi:10.5281/zenodo.4615289
-
[31]
2025 A&A, 704, A244, doi:10.1051/0004-6361/202556480
Fu, H., Shankar, F., Yuan, F., et al. 2025 A&A, 704, A244, doi:10.1051/0004-6361/202556480
-
[32]
2008 ApJS, 176, 1, doi:10.1086/527321
Furusawa, H., Kosugi, G., Akiyama, M., et al. 2008 ApJS, 176, 1, doi:10.1086/527321
-
[33]
Gould, K. M. L., Brammer, G., Valentino, F., et al. 2023 AJ, 165, 248, doi:10.3847/1538-3881/accadc
-
[34]
Gountanis, N. M., Weinberg, D. H., Beverage, A. G., et al. 2025 ApJ, 985, 184, doi:10.3847/1538-4357/adc4e6
-
[35]
Gunasekera, C. M., van Hoof, P. A. M., Dehghanian, M., et al. 2025 Rev. Mexicana Astron. Astrofis., 61, 120, doi:10.22201/ia.01851101p.2025.61.03.01
-
[36]
Hahn, C., Tinker, J. L., & Wetzel, A. 2017 ApJ, 841, 6, doi:10.3847/1538-4357/aa6d6b
-
[37]
Hamadouche, M. L., Whitaker, K. E., Valentino, F., et al. 2026 arXiv e-prints, arXiv:2602.02485, doi:10.48550/arXiv.2602.02485
-
[38]
Harris, C. R., Millman, K. J., van der Walt, S. J., et al. 2020 Nature, 585, 357, doi:10.1038/s41586-020-2649-2
-
[39]
Harvey, T., Lovell, C. C., Newman, S., et al. 2026 MNRAS, 547, stag282, doi:10.1093/mnras/stag282
-
[40]
2008 ApJ, 679, 156, doi:10.1086/587544
Rothberg, B. 2008 ApJ, 679, 156, doi:10.1086/587544
-
[41]
Hunter, J. D. 2007 Computing in Science and Engineering, 9, 90, doi:10.1109/MCSE.2007.55
-
[42]
G., Tacchella, S., Genel, S., et al
Iyer, K. G., Tacchella, S., Genel, S., et al. 2020 MNRAS, 498, 430, doi:10.1093/mnras/staa2150
-
[43]
Iyer, K. G., Starkenburg, T. K., Bryan, G. L., et al. 2025 ApJ, 994, 174, doi:10.3847/1538-4357/ae0334
-
[44]
Ji, Z., Williams, C. C., Behroozi, P., et al. 2026 arXiv e-prints, arXiv:2604.05022, doi:10.48550/arXiv.2604.05022
work page internal anchor Pith review Pith/arXiv arXiv doi:10.48550/arxiv.2604.05022 2026
-
[45]
Kauffmann, G., Heckman, T. M., White, S. D. M., et al. 2003 MNRAS, 341, 54, doi:10.1046/j.1365-8711.2003.06292.x
-
[46]
H., Belli, S., Nipoti, C., et al
Khoram, A. H., Belli, S., Nipoti, C., et al. 2026 ApJ, 998, 59, doi:10.3847/1538-4357/ae23d0
-
[47]
Lawrence, A., Warren, S. J., Almaini, O., et al. 2007 MNRAS, 379, 1599, doi:10.1111/j.1365-2966.2007.12040.x
-
[48]
Leja, J., Carnall, A. C., Johnson, B. D., Conroy, C., & Speagle, J. S. 2019a ApJ, 876, 3, doi:10.3847/1538-4357/ab133c
work page internal anchor Pith review doi:10.3847/1538-4357/ab133c
-
[49]
2019b ApJL, 880, L9, doi:10.3847/2041-8213/ab2f8c
Leja, J., Tacchella, S., & Conroy, C. 2019b ApJL, 880, L9, doi:10.3847/2041-8213/ab2f8c
-
[50]
2024 MNRAS, 528, 4029, doi:10.1093/mnras/stae225
Leung, H.-H., Wild, V., Papathomas, M., et al. 2024 MNRAS, 528, 4029, doi:10.1093/mnras/stae225
-
[51]
2026a arXiv e-prints, arXiv:2602.13114, doi:10.48550/arXiv.2602.13114
Leung, H.-H., Wild, V., Papathomas, M., et al. 2026a arXiv e-prints, arXiv:2602.13114, doi:10.48550/arXiv.2602.13114
-
[52]
Leung, H.-H., Carnall, A. C., Taylor, E., et al. 2026b MNRAS, doi:10.1093/mnras/stag827
-
[53]
2024 AJ, 167, 16, doi:10.3847/1538-3881/ad0be4
Li, J., Melchior, P., Hahn, C., & Huang, S. 2024 AJ, 167, 16, doi:10.3847/1538-3881/ad0be4
-
[54]
2016 ApJ, 832, 29, doi:10.3847/0004-637X/832/1/29
Lian, J., Yan, R., Zhang, K., & Kong, X. 2016 ApJ, 832, 29, doi:10.3847/0004-637X/832/1/29
-
[55]
Lin, L., Wu, P.-F., Thorp, M. D., et al. 2026 ApJ, 999, 263, doi:10.3847/1538-4357/ae3b2b
-
[56]
T., Almaini, O., Wild, V., & et al
Maltby, D. T., Almaini, O., Wild, V., & et al. 2026 MNRASin print
2026
-
[57]
T., Almaini, O., Wild, V., et al
Maltby, D. T., Almaini, O., Wild, V., et al. 2016 MNRAS, 459, L114, doi:10.1093/mnrasl/slw057
-
[58]
McLeod, D. J., McLure, R. J., Dunlop, J. S., et al. 2021 MNRAS, 503, 4413, doi:10.1093/mnras/stab731
-
[59]
2025 ApJ, 983, 181, doi:10.3847/1538-4357/adc12e
Mosleh, M., Riahi-Zamin, M., & Tacchella, S. 2025 ApJ, 983, 181, doi:10.3847/1538-4357/adc12e
-
[60]
Naab, T., & Ostriker, J. P. 2017 ARA&A, 55, 59, doi:10.1146/annurev-astro-081913-040019
-
[61]
2024 ApJ, 961, 73, doi:10.3847/1538-4357/ad0966
Narayanan, D., Lower, S., Torrey, P., et al. 2024 ApJ, 961, 73, doi:10.3847/1538-4357/ad0966
-
[62]
First results from the IllustrisTNG simulations: the galaxy color bimodality
Nelson, D., Pillepich, A., Springel, V., et al. 2018 MNRAS, 475, 624, doi:10.1093/mnras/stx3040
work page internal anchor Pith review doi:10.1093/mnras/stx3040 2018
-
[63]
2026 A&A, 705, A153, doi:10.1051/0004-6361/202557293
Nersesian, A., Kaushal, Y., Martorano, M., et al. 2026 A&A, 705, A153, doi:10.1051/0004-6361/202557293
-
[64]
2025 ApJ, 990, 120, doi:10.3847/1538-4357/adf3a7 20V
Ni, Y., Chen, N., Zhou, Y., et al. 2025 ApJ, 990, 120, doi:10.3847/1538-4357/adf3a7 20V. Wild et al
-
[65]
Pacifici, C., Kassin, S. A., Weiner, B. J., et al. 2016 ApJ, 832, 79, doi:10.3847/0004-637X/832/1/79
-
[66]
2024 ApJ, 976, 72, doi:10.3847/1538-4357/ad7e15
Park, M., Belli, S., Conroy, C., et al. 2024 ApJ, 976, 72, doi:10.3847/1538-4357/ad7e15
-
[67]
2019 MNRAS, 490, 978, doi:10.1093/mnras/stz2616
Plat, A., Charlot, S., Bruzual, G., et al. 2019 MNRAS, 490, 978, doi:10.1093/mnras/stz2616
-
[68]
Price, S. H., Kriek, M., Brammer, G. B., et al. 2014 ApJ, 788, 86, doi:10.1088/0004-637X/788/1/86 Rodríguez Montero, F., Davé, R., Wild, V., Anglés-Alcázar, D., &
-
[69]
2019 MNRAS, 490, 2139, doi:10.1093/mnras/stz2580
Narayanan, D. 2019 MNRAS, 490, 2139, doi:10.1093/mnras/stz2580
-
[70]
2015 MNRAS, 448, 258, doi:10.1093/mnras/stu2714 Sánchez, S
Rowlands, K., Wild, V., Nesvadba, N., et al. 2015 MNRAS, 448, 258, doi:10.1093/mnras/stu2714 Sánchez, S. F., Barrera-Ballesteros, J. K., Lacerda, E., et al. 2022 ApJS, 262, 36, doi:10.3847/1538-4365/ac7b8f
-
[71]
2022 MNRAS, 515, 2951, doi:10.1093/mnras/stac1999
Maiolino, R. 2022 MNRAS, 515, 2951, doi:10.1093/mnras/stac1999
-
[72]
2021 A&A, 652, A30, doi:10.1051/0004-6361/202039738
Santini, P., Castellano, M., Merlin, E., et al. 2021 A&A, 652, A30, doi:10.1051/0004-6361/202039738
-
[73]
2018 A&A, 618, A85, doi:10.1051/0004-6361/201833070
Schreiber, C., Glazebrook, K., Nanayakkara, T., et al. 2018 A&A, 618, A85, doi:10.1051/0004-6361/201833070
-
[74]
J., Verrico, M., Bezanson, R., et al
Setton, D. J., Verrico, M., Bezanson, R., et al. 2022 ApJ, 931, 51, doi:10.3847/1538-4357/ac6096
-
[75]
2020 MNRAS, 499, 4239, doi:10.1093/mnras/staa3167
Sherman, S., Jogee, S., Florez, J., et al. 2020 MNRAS, 499, 4239, doi:10.1093/mnras/staa3167
-
[76]
2026 ApJ, 1000, 191, doi:10.3847/1538-4357/ae459d
Skarbinski, M., Rowlands, K., Alatalo, K., et al. 2026 ApJ, 1000, 191, doi:10.3847/1538-4357/ae459d
-
[77]
Skelton, R. E., Bell, E. F., & Somerville, R. S. 2012 ApJ, 753, 44, doi:10.1088/0004-637X/753/1/44
-
[78]
Slob, M., Kriek, M., Beverage, A. G., et al. 2024 ApJ, 973, 131, doi:10.3847/1538-4357/ad65ff
-
[79]
Stanway, E. R., & Eldridge, J. J. 2018 MNRAS, 479, 75, doi:10.1093/mnras/sty1353
-
[80]
Stevenson, S. D., Carnall, A. C., Leung, H.-H., et al. 2026 MNRAS, 545, staf2087, doi:10.1093/mnras/staf2087
discussion (0)
Sign in with ORCID, Apple, or X to comment. Anyone can read and Pith papers without signing in.