Earth and Planetary Astrophysics · arXiv:2609.20664 v1 · submitted 17 Sep 2026 · 82 references
Water Cloud and Chemical Modulations in the Coldest Brown Dwarf
The paper says
“We present high signal-to-noise, medium resolution (R 1000), time-series JWST/NIRSpec spectra of WISE 0855 (265K), the coldest known brown dwarf.”
more of the abstract
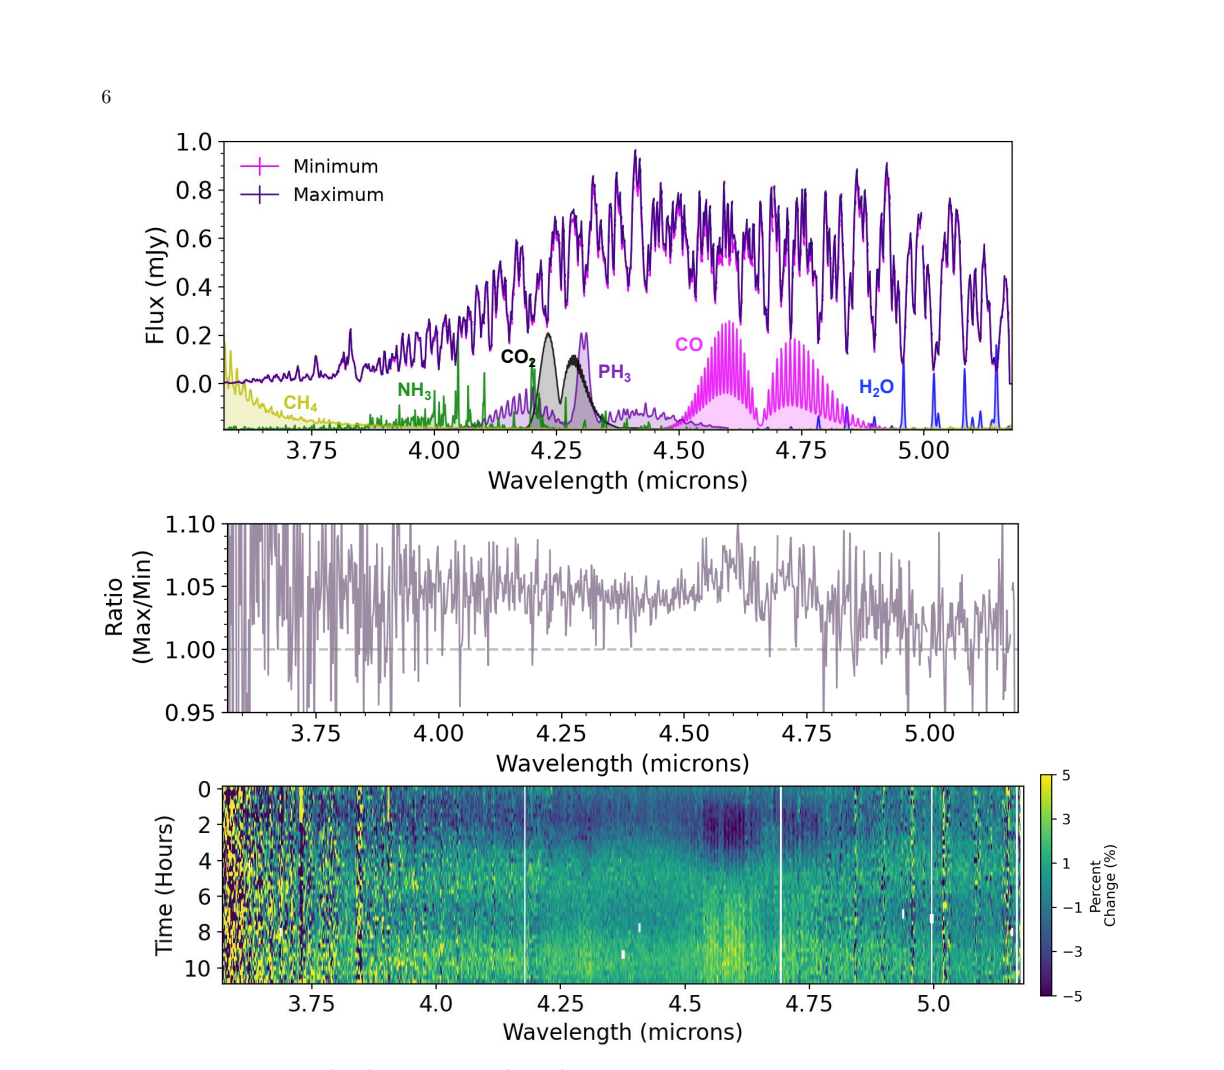
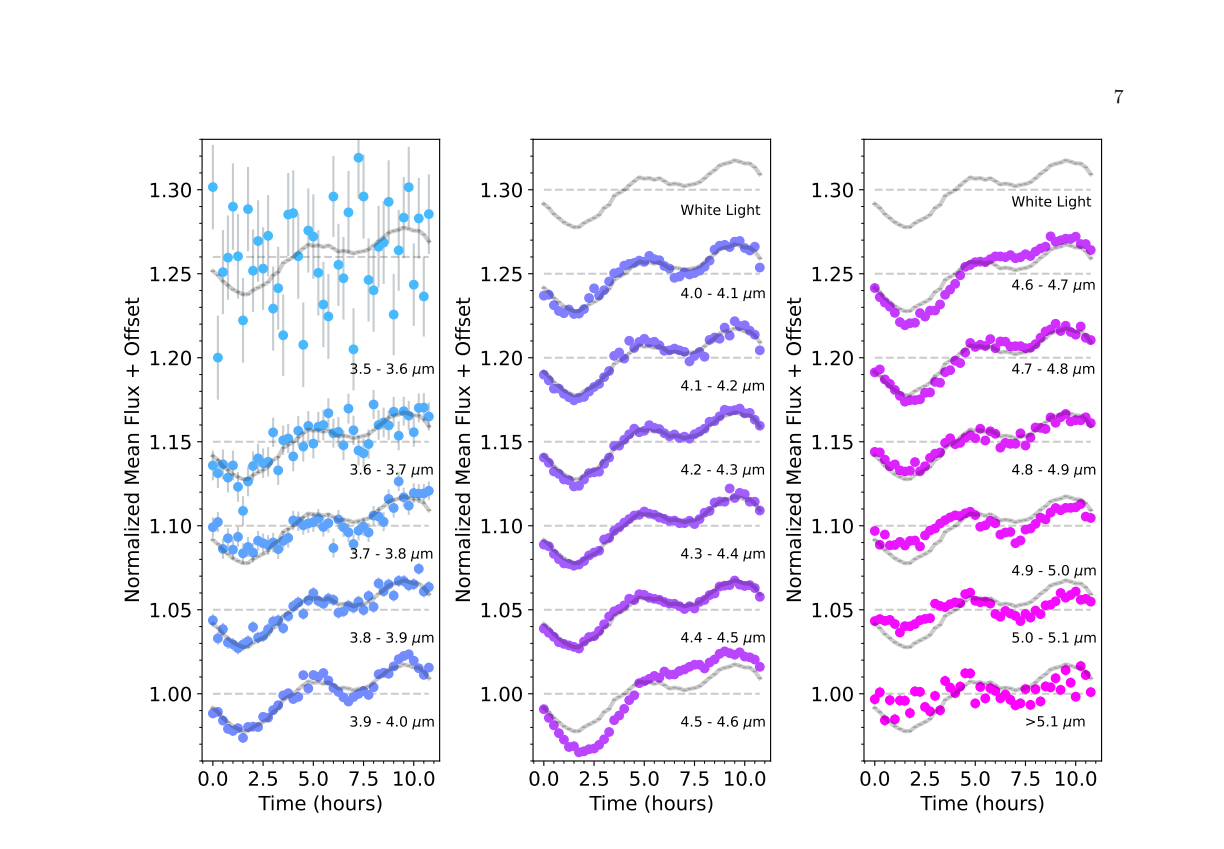
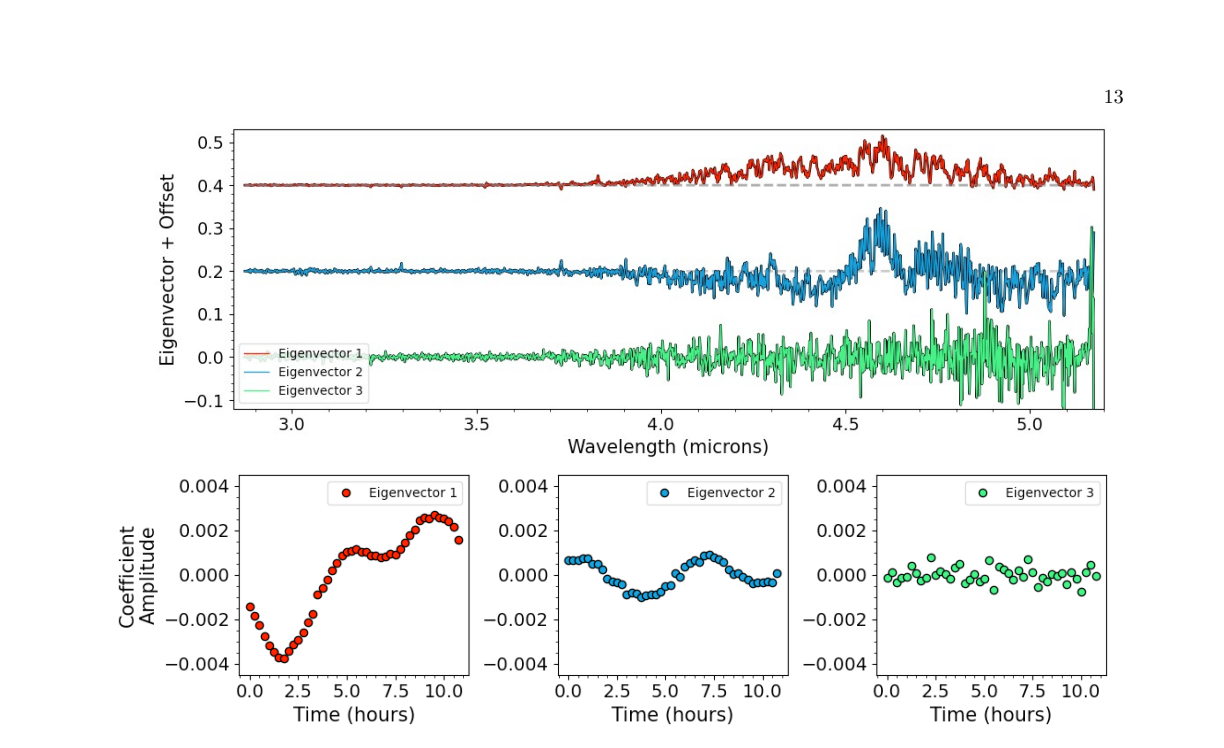
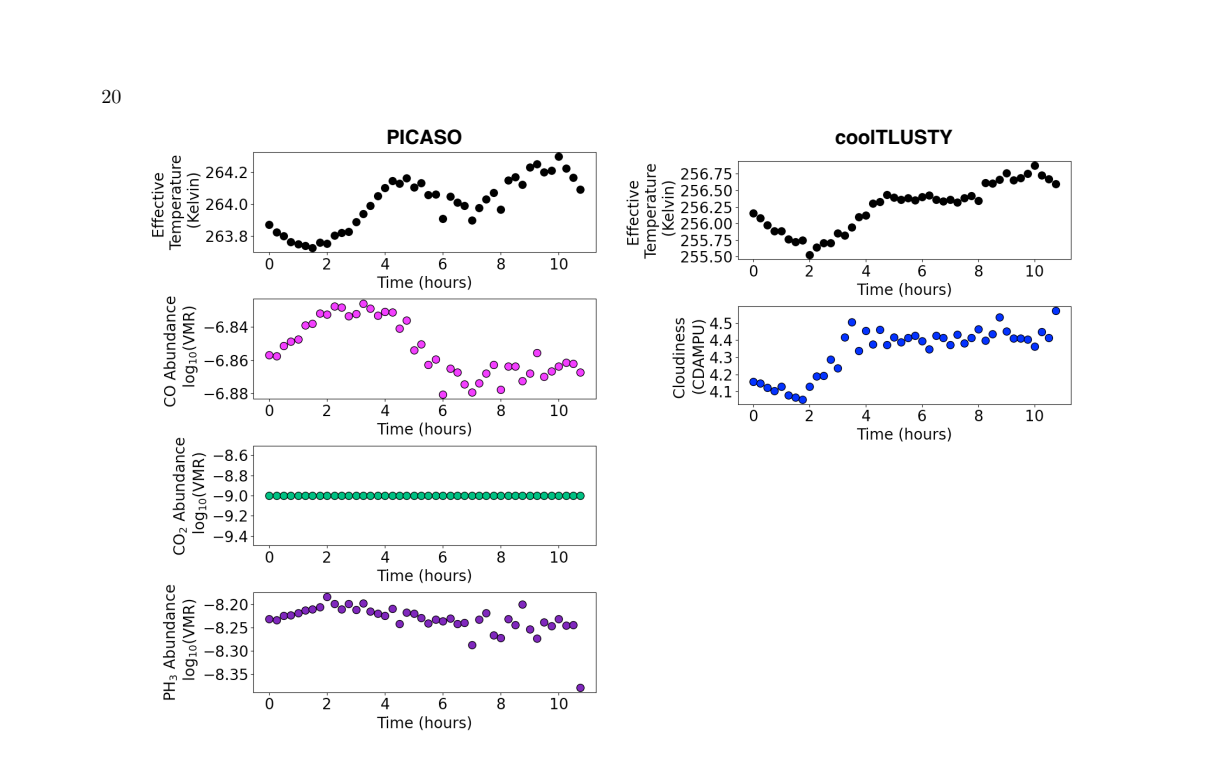
Medium resolution, time-series spectroscopy gives us the power to disentangle the effects of chemistry, temperature, and condensates on this cool world. Our observations span 11 hours with a 15 minute cadence covering 2.87 - 5.27 μm. The strongest time variable spectroscopic feature is carbon monoxide gas absorption producing modulations with a peak-to-peak amplitude up to 10% at some wavelengths. Using principal component analysis, we show that the variations in carbon monoxide and phosphine correlate with one another. By comparing our data to atmospheric and structure models we present evidence of patchy water clouds within the atmosphere of WISE 0855. We find that variations in CO and PH3 abundances must originate from quenched atmospheric pressures while variations in water cloud thickness occurs at lower pressures.
from the abstract
Pith says
Machine review · deepseek-v4-flash · 20 Sep 2026 · what was read was not recorded · not checked by a person
It can be wrong. Challenge this review or reply to it.
Holds up, with conditions. Good data and clean PCA, but the central chemical claim is undermined by order-of-magnitude inconsistencies in inferred mixing coefficients (Table 3). This line is wrong
2 major objections · 5 minor
How often objections from reviews like this one are right: not yet measured
Not checked: figures, code, what the 82 references say.
The paper says, at Table 3, Section 7.1
The review did not quote this passage.
Pith says: Objection 1 of 2 · major
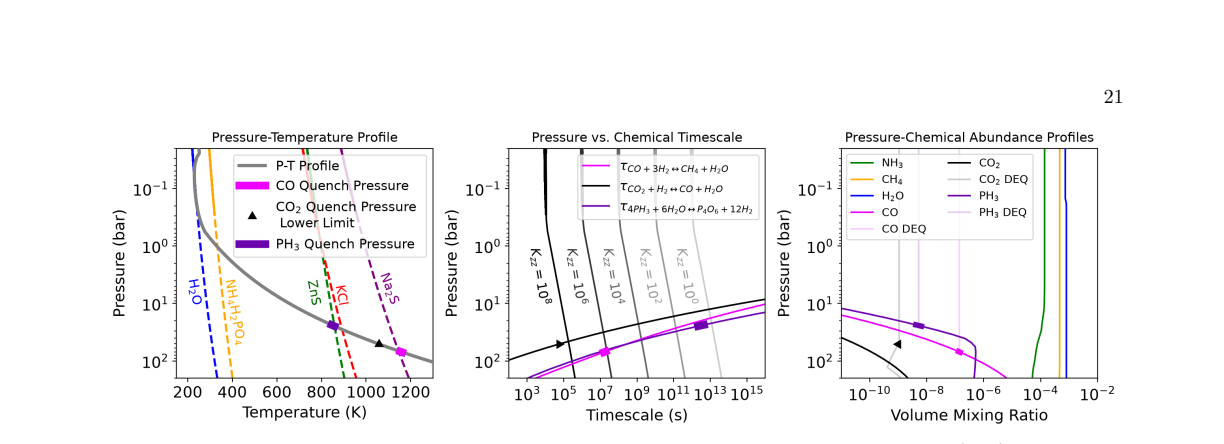
The inferred eddy diffusion coefficients for CO (Kzz ~ 10⁶ cm²/s), CO₂ (>10⁸ cm²/s), and PH₃ ( ~ 10¹ cm²/s) differ by seven orders of magnitude, yet all three molecules quench within the same pressure scale height (23–71 bars). This is a severe internal inconsistency in the quench-chemistry framework that the paper itself rests on.
more of objection 1
The authors acknowledge the discrepancy (Section 7.1) but do not resolve it. Without a compelling physical explanation (e.g., metallicity effects, missing PH₃ chemical pathways, or evidence that the 1D mixing assumption is inappropriate), the central conclusion that CO and PH₃ variations 'must originate from quenched atmospheric pressures' is not supported. The paper should either provide a mechanism that can reconcile these Kzz values or substantially weaken the claim (e.g., by stating that the variations are 'consistent with' rather than 'must originate from' quenched pressures).
The paper says, at Section 6, Table 2
The review did not quote this passage.
Pith says: Objection 2 of 2 · major
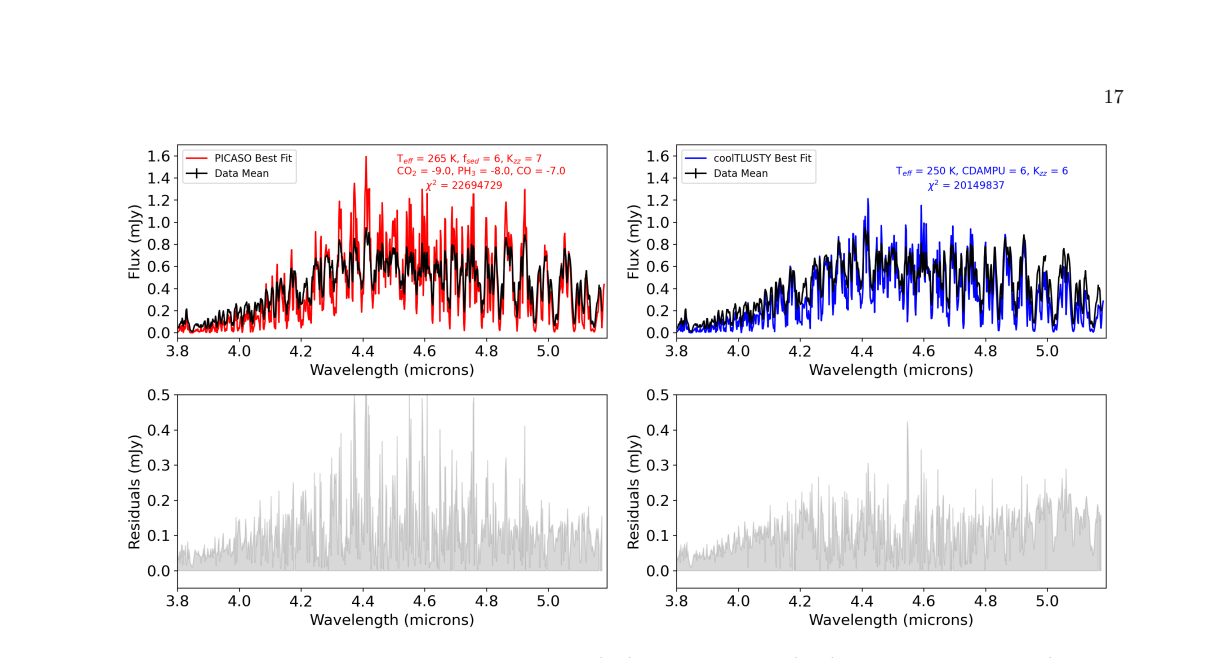
The reduced χ² values for the best-fit models are extremely large (e.g., 17884 for the best coolTLUSTY model, Table 2). While relative fits over time may be more informative than absolute χ², such high values imply that none of the forward model grids adequately reproduces the mean spectrum of WISE 0855.
more of objection 2
This raises concerns about whether the model parameters (Teff, cloud parameters, Kzz, molecular abundances) are reliably determined from these fits, and whether the time-variation interpretation (which relies on the same model grid) is robust. The paper should explicitly discuss the implications of these poor absolute fits for the reliability of the derived parameter variations, and consider whether systematic differences (e.g., missing opacity, 3D effects) could bias the inferred temporal trends.
5 minor objections
The paper says, at Table 1
Pith says: minor objection 1 of 5
In the 'DisEQ Parameter' column, the values 'Kzz = 7' and 'Kzz = 6' are ambiguous: do they refer to log₁₀(Kzz) or the actual value in cm²/s? The text (Sections 6.1, 6.2) reports Kzz = 10⁷ and 10⁶ cm²/s, so the table entries should be written as 'Kzz = 10⁷' or 'log Kzz = 7' for clarity.
The paper says, at Section 5.2, Figures 12, 13
Pith says: minor objection 2 of 5
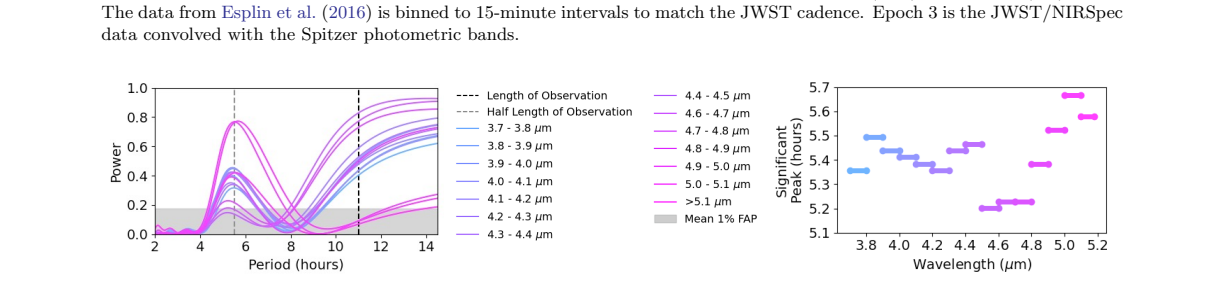
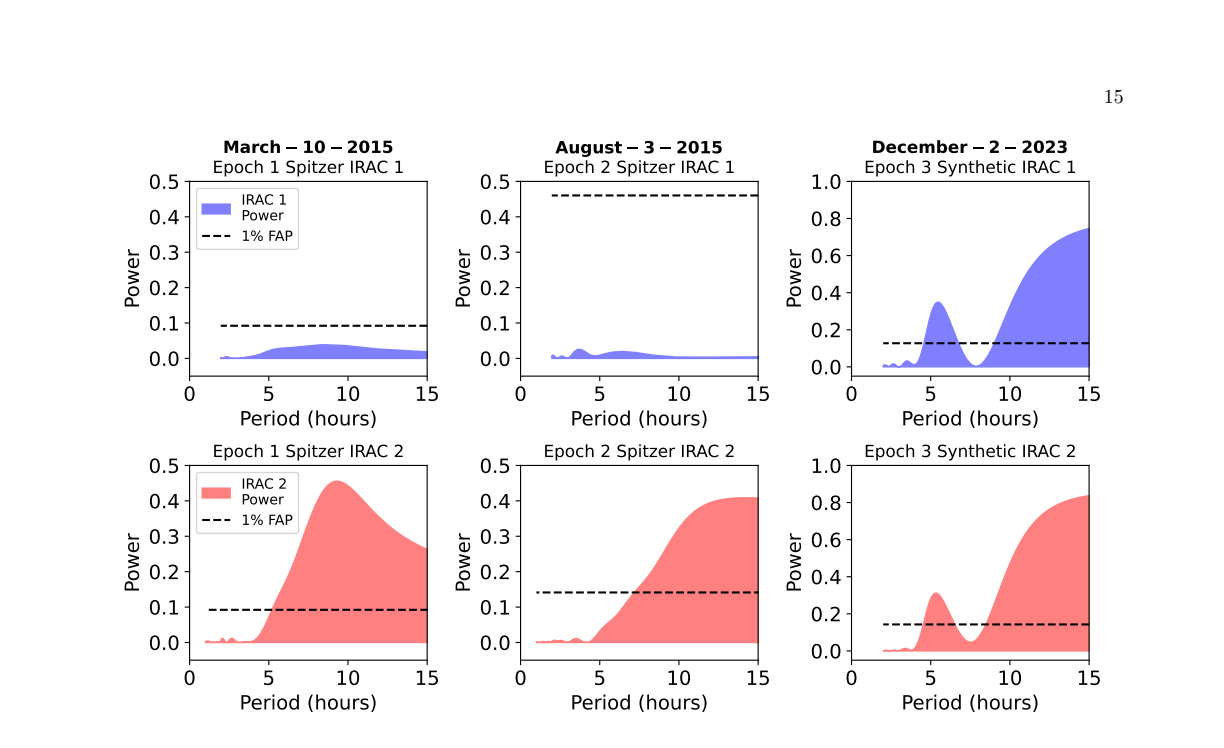
The periodogram analysis shows significant power near 5.4–5.6 hours and also at periods longer than the 11-hour baseline. The paper states the rotation period is unknown. This ambiguity should be explicitly connected to the interpretation of the two PCA components: if the true period is >11 hours, the rotational phase coverage is less than one full rotation, which could affect the robustness of the component separation.
show 3 more
The paper says, at Section 4.1, Figures 4–8
Pith says: minor objection 3 of 5
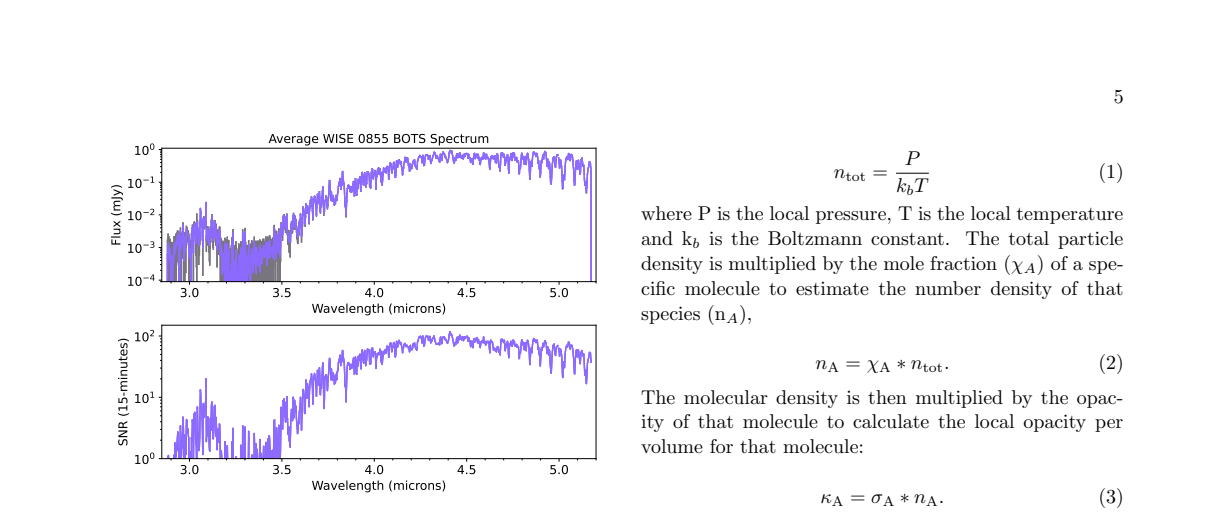
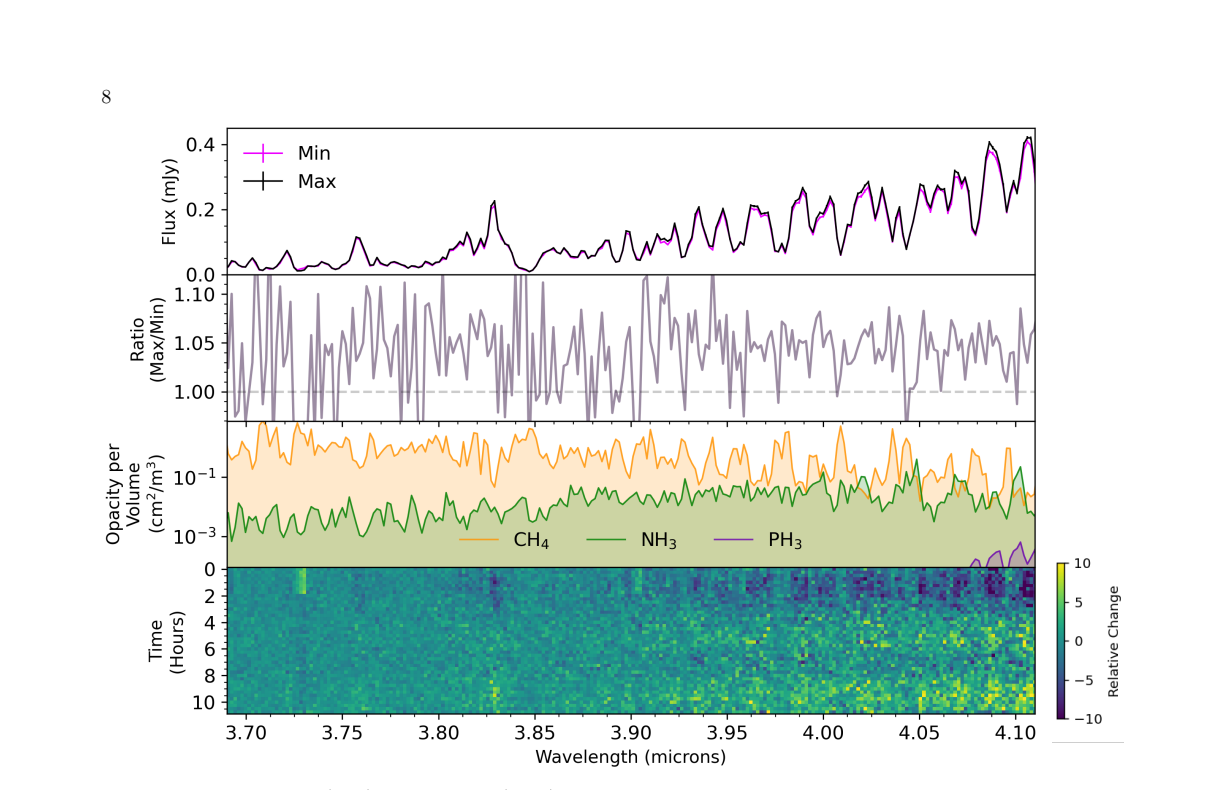
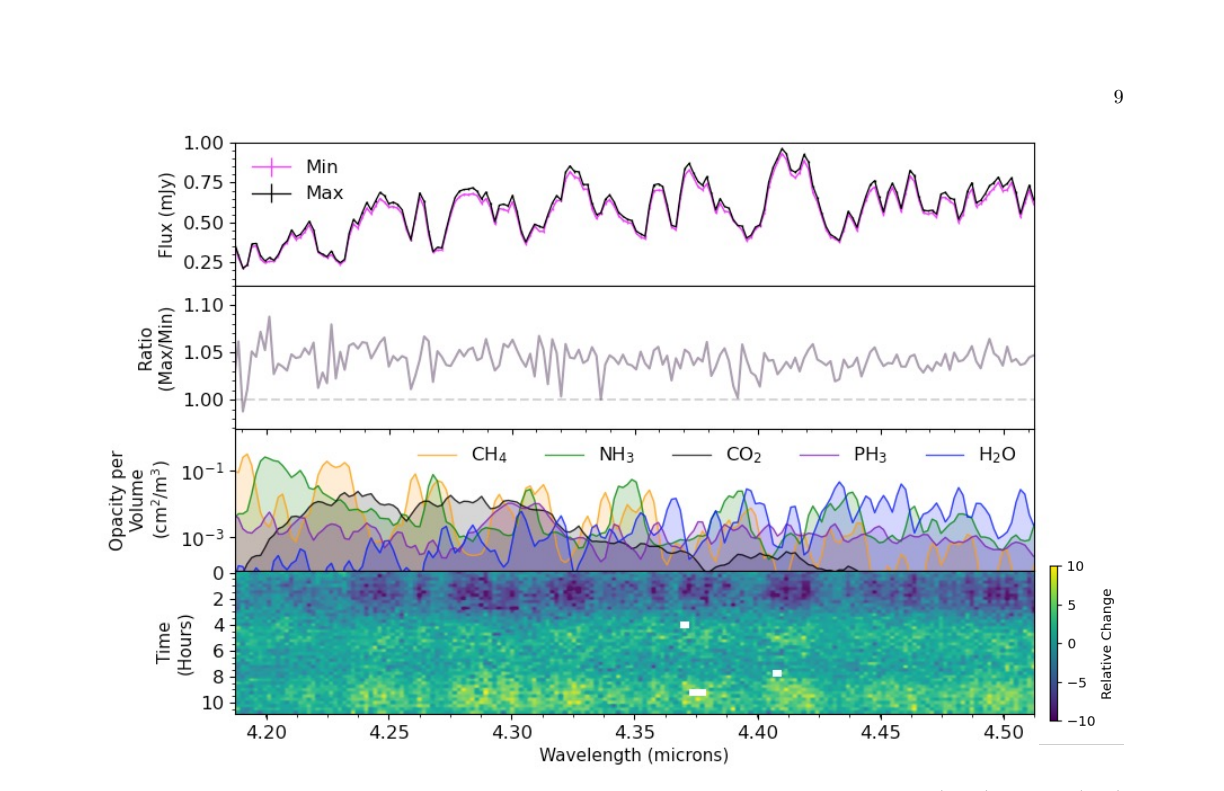
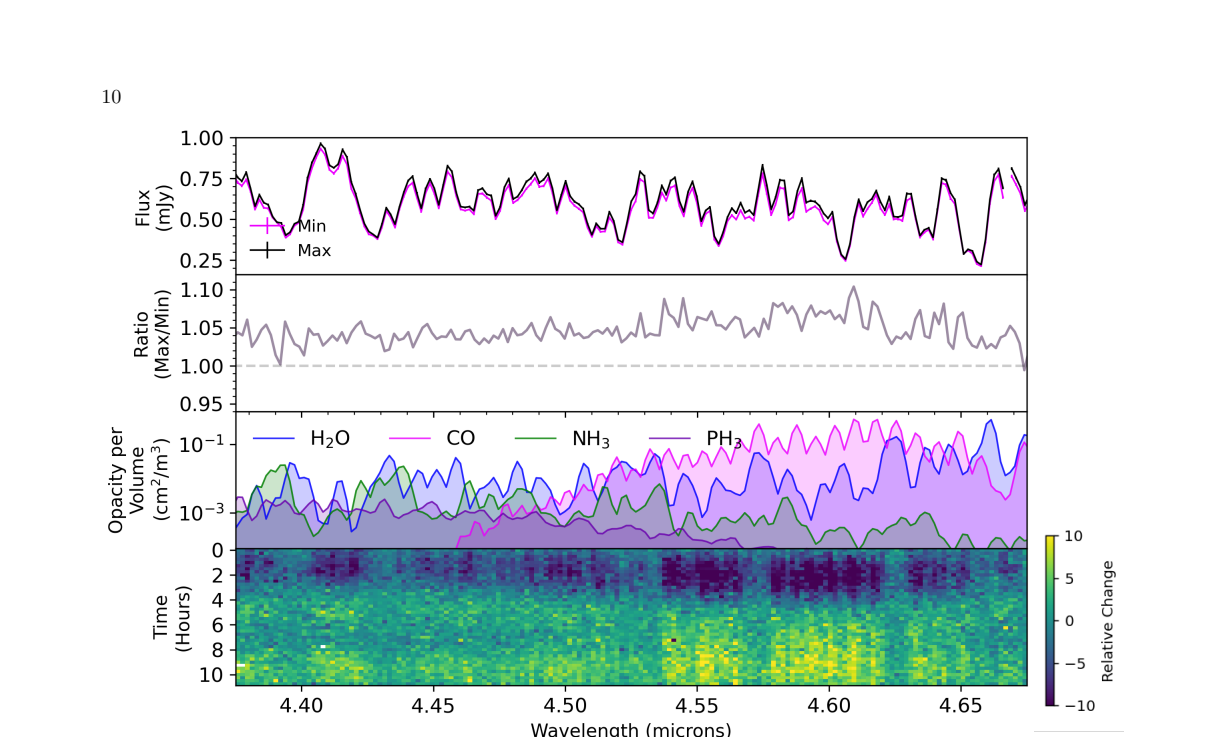
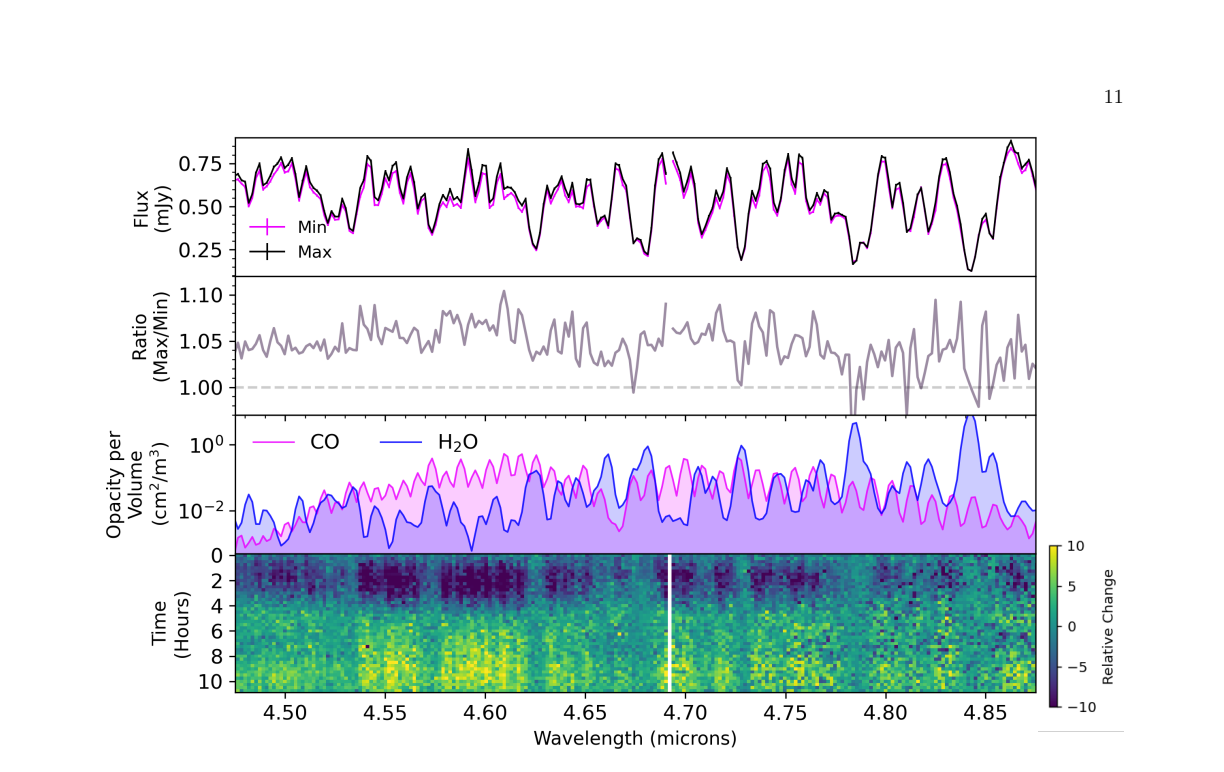
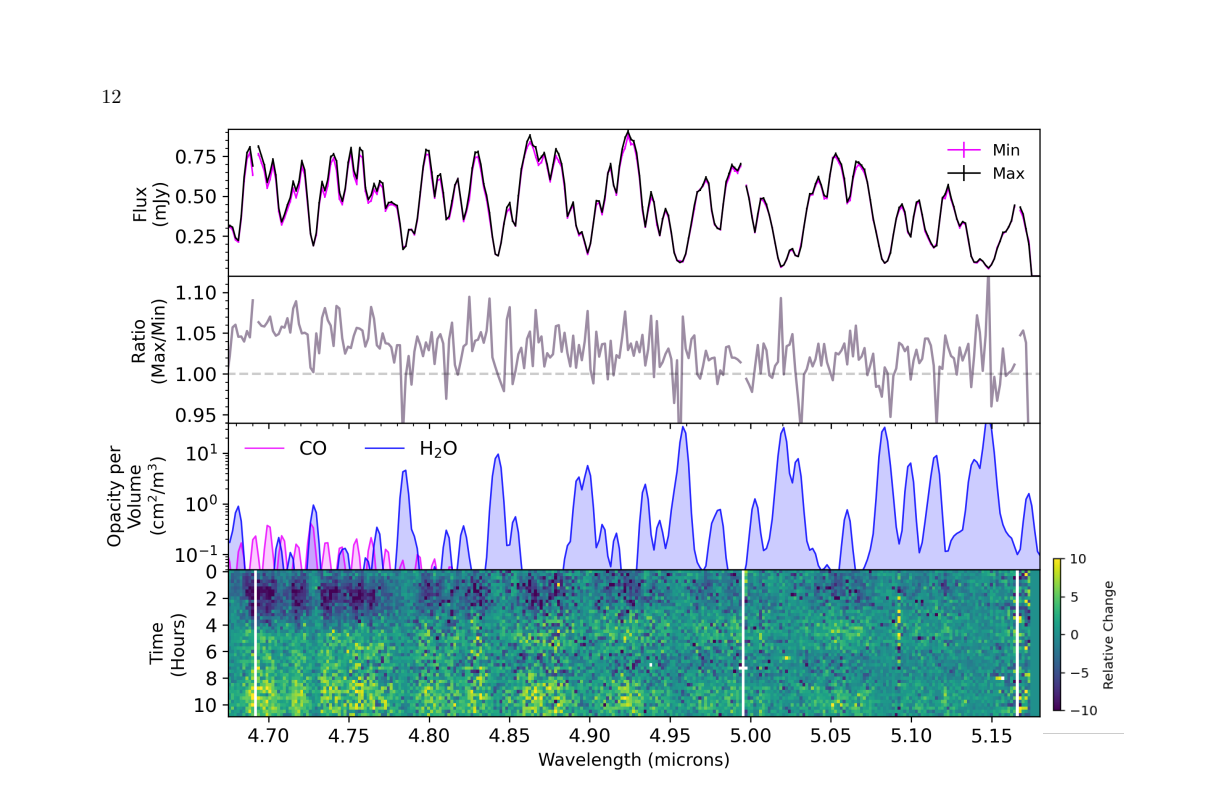
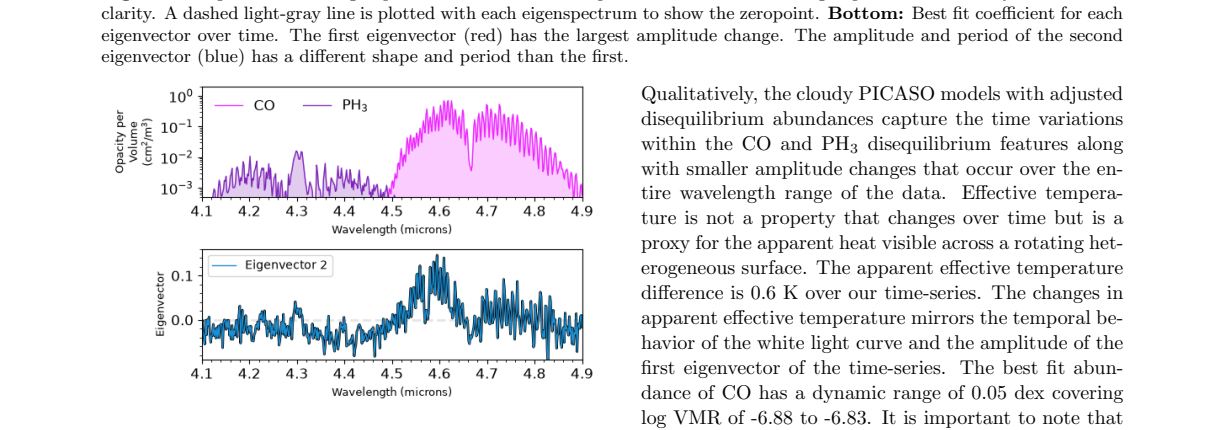
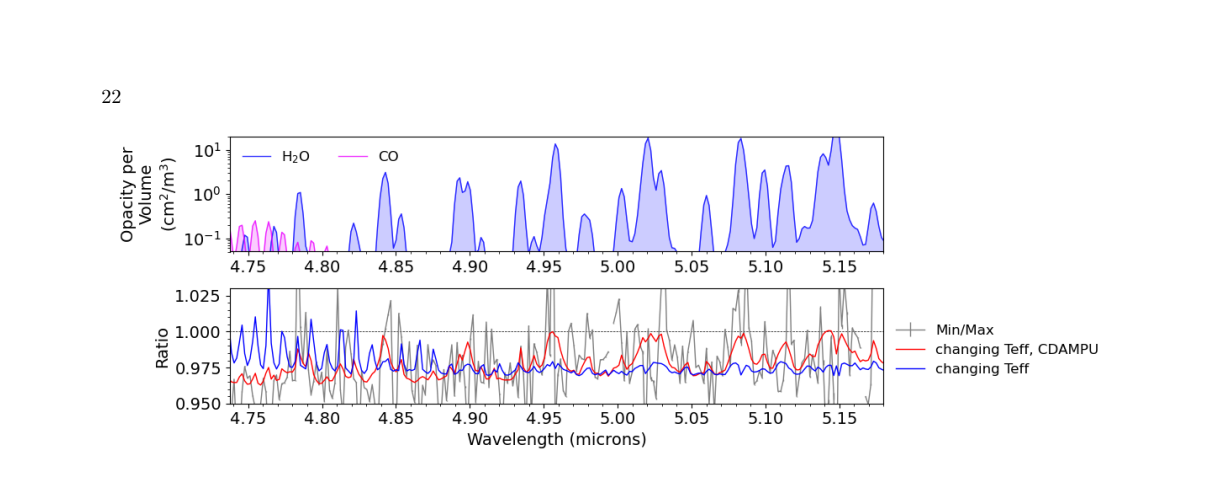
The opacity calculations assume a single temperature (260 K) and pressure (1 bar) for all molecules. This is a rough approximation and may mislead readers because the opacities of quenched molecules (CO, PH₃) in the photosphere can be much higher. The authors should state explicitly that this is a simplified illustration and not a quantitative retrieval.
The paper says, at Abstract, Section 8
Pith says: minor objection 4 of 5
The abstract and summary use the phrase 'must originate from quenched atmospheric pressures'. Given the model uncertainties, this language is too definitive. Consider replacing 'must' with 'likely' or 'are consistent with' to better reflect the caveats discussed in Section 7.1.
The paper says, at General
Pith says: minor objection 5 of 5
Several of the footnotes (e.g., footnotes 2, 3) contain raw URL text that would not render properly in a published version. These should be formatted as clickable hyperlinks or replaced with standard citations.
What would settle it
Recompute quench pressures and implied Kzz for CO, CO₂, and PH₃ using a model that allows Kzz to vary as a power law in pressure (e.g., Kzz ∝ P^α). If no single α can simultaneously reproduce the observed CO, CO₂, and PH₃ abundances within 1σ, then the quench chemistry interpretation is internally inconsistent and the central claim is not supported by the current model framework.
from the skeptic's reading
How the review went
4 readings by deepseek-v4-flash · 20 Sep 2026
- Reader holds up, with conditions
- Skeptic partly agrees
- Editor wrote the verdict above
- Referee major revision: 2 major objections, 5 minor
Not run on this paper: the simulated authors' defence.
Pith did not check this review's objections against the paper.
The review in full
The review in brief, machine-written
This paper presents the first medium-resolution time-series JWST spectroscopy of a Y dwarf—WISE 0855—and the data are genuinely impressive. The PCA cleanly separates two variability components: a broadband one that tracks the white-light curve, and a second one that hits CO and PH3 features. That part is solid and new.
Where it gets shaky is the interpretive step. The authors assign the second PCA component to quenched CO/PH3 abundances at ~20–70 bars and attribute the broadband component to patchy water clouds at 1–4 bars. That is a plausible narrative, but the evidence for it depends on forward models with a 1D, constant-Kzz mixing framework. Table 3 shows inferred Kzz values that differ by seven orders of magnitude (CO ~106, PH3 ~101, CO2 >108 cm2/s). The paper acknowledges this but does not resolve it. If all three molecules quench in the same convective region, they should yield comparable Kzz under the model's own assumptions. The inconsistency is large enough to undermine the claim that the second component "must" originate from quench processes. The PCA shows there are two independent time series; it does not tell you the physical cause. The model fitting then tries to back out causes, but the failure of the internal consistency check means the attribution remains speculative.
The chi-squared values are also sky-high (thousands), though the authors correctly note that relative fits matter more for time series. Still, the absolute poor fits suggest the models miss something—maybe metallicity, maybe vertical structure.
Who should read this? Anyone working on brown dwarf variability, exoplanet atmospheres, or disequilibrium chemistry. The data set is a milestone. The interpretation is a step ahead of previous work, but it overreaches. A revision that explicitly addresses the Kzz tension—perhaps by testing non-solar metallicity or by softening the claim to "consistent with" rather than "must originate from"—would strengthen the paper considerably.
Recommendation: send to peer review, but flag the Table 3 inconsistency as a load-bearing issue that needs a substantive response. The data deserve publication, but the central conclusion should be tempered.
The strongest objection
The paper’s central claim relies on assigning CO and PH₃ variations to quenched chemical abundances at ~20–70 bars, and water cloud variations to lower pressures (1–4 bars). This assignment depends critically on the assumption that vertical mixing in WISE 0855 can be described by a 1D eddy diffusion coefficient (Kzz) that is constant with height and equal for all species. Table 3 shows that inferred Kzz values differ by roughly seven orders of magnitude (CO: ~10⁶, PH₃: ~10¹, CO₂: >10⁸ cm²/s). The paper acknowledges this inconsistency (Section 7.1) but does not resolve it. If the quench model were correct, all three species should share a similar Kzz because they quench within the same convective region. The order-of-magnitude spread implies that either the quench pressures are misidentified, the assumed chemical pathways are incomplete (especially for PH₃), or the 1D mixing framework is fundamentally inadequate. Without addressing this tension, the attribution of the PCA second component specifically to deep CO/PH₃ variations—as opposed to correlated changes from another mechanism (e.g., temperature gradients, cloud heterogeneity affecting multiple opacity sources)—remains speculative. The claim that the variations 'must originate from quenched atmospheric pressures' is therefore weaker than presented; a model that fails a basic internal consistency check cannot robustly support the central conclusion.
The reader identified the 1D model assumptions and the Kzz inconsistency as the weakest assumption, which aligns with the concern raised here. However, the reader’s verdict (CONDITIONAL) already captures that the claim is plausible but requires further validation. The stress-test confirms that the Kzz inconsistency is the single most load-bearing issue and that it is not resolved in the paper. The verdict should remain CONDITIONAL because the observational evidence (PCA) is robust, but the physical interpretation hinges on resolving this inconsistency. No change to the reader's verdict is needed; the condition is already correctly stated. The agreement with the reader is partial because the reader also cited broader model limitations, whereas this test focuses specifically on the quantitative inconsistency in Table 3.
The referee's report
If confirmed, the central claim—that rotational modulations in a Y dwarf can be separated into shallow cloud-driven and deep chemistry-driven components—would be a significant advance in understanding brown-dwarf atmospheric dynamics. The data themselves (11 hr of medium-resolution time-series spectroscopy at S/N~80–100) are unique and valuable. The PCA identification of two independent variability modes is a robust empirical result. The paper also provides useful comparisons between two forward-model codes (PICASO, coolTLUSTY) and their cloud prescriptions. However, as detailed in the major comments, the attribution of the second PCA component specifically to deep quenched gas is weakened by internal inconsistencies in the inferred vertical mixing coefficients (Table 3), and the absolute model fits are poor (reduced χ² >> 1). These issues must be addressed before the claim can be accepted at face value.
Pith's reading of the paper (a machine's summary, not the authors')
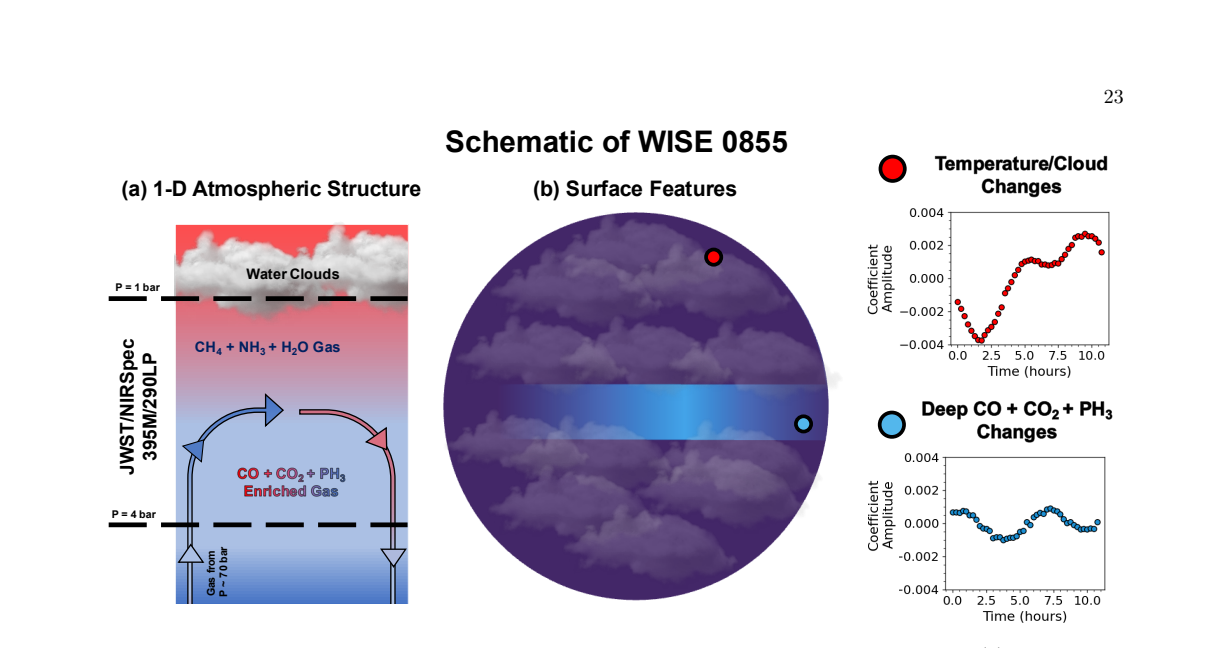
The paper uses 11 hours of JWST/NIRSpec medium-resolution time-series spectra of WISE 0855, the coldest known brown dwarf (265 K), to separate the effects of chemistry, temperature, and condensates on its atmosphere. The central claim is that rotational modulations come from two independent layers: deep convection-driven variations in CO and PH3 abundances (quenched at ~20–70 bars) and upper-level patchy water clouds that vary in thickness (at ~1–4 bars). This is the first spectroscopic time series of a Y dwarf, and it provides direct evidence that water clouds exist and are spatially inhomogeneous on this object. Understanding this layered weather is important because it tests models of brown dwarf and exoplanet atmospheres under conditions analogous to cool giant planets.
What carries the argument. Principal component analysis (PCA) applied to the normalized time-series spectra, together with self-consistent 1D atmospheric forward models (PICASO with Virga water clouds and the Ackerman & Marley fsed prescription; coolTLUSTY with CDAMPU water cloud parameterization) that include convection-driven disequilibrium chemistry (parameterized by eddy diffusion Kzz). The key interpretive step is using the fitted molecular abundances to infer quench pressures and then comparing the resulting Kzz values across CO, CO2, and PH3, which reveals the inconsistency that points to multiple vertical layers.
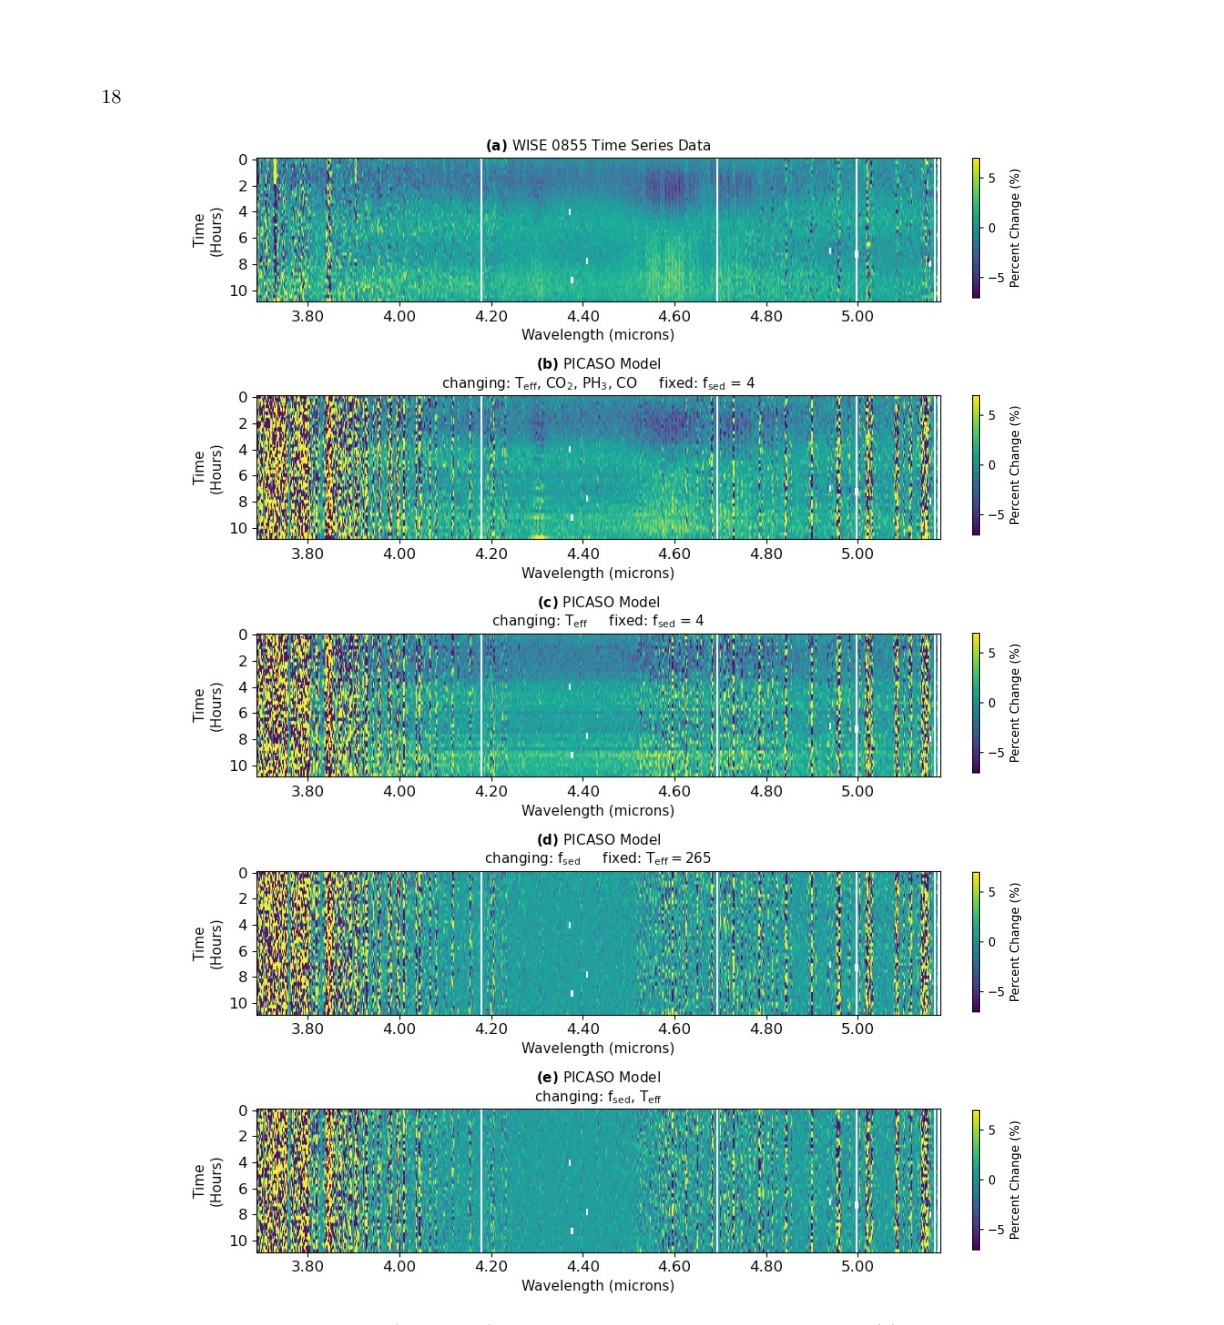
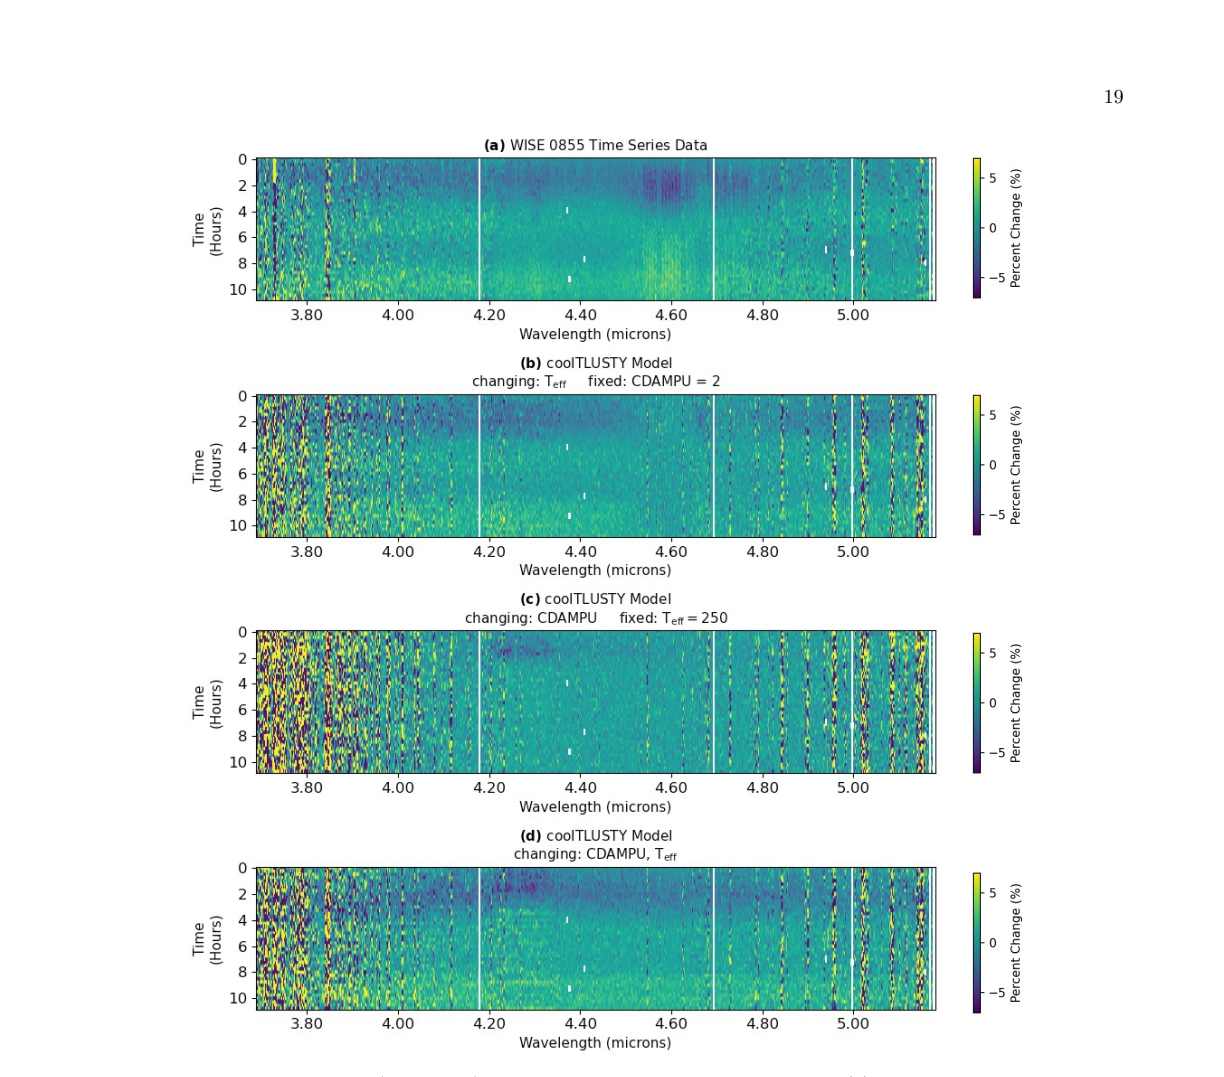
Core claim. By analyzing the time-series spectra with principal component analysis and comparing them to self-consistent atmospheric models (PICASO and coolTLUSTY), the authors show that 60.5% of the variability follows a broadband pattern (temperature/cloud changes) while 4.7% traces specifically the absorption bands of CO and PH3. The CO and PH3 variations are correlated and require changes in deep gas abundances, not just temperature or cloud thickness. The best-fit models require both a variable water cloud (via the fsed or CDAMPU parameters) and adjustments in the abundances of CO, PH3, and CO2 to match the observed spectral variability. From the fitted abundances, they infer quench pressures: CO at ~70 bars, CO2 deeper than 51 bars, and PH3 at ~24 bars. The implied eddy diffusion coefficients are inconsistent across molecules (Kzz for CO ~$10^{6}$, for CO2 >$10^{8}$, for PH3 ~$10^{1}$ $cm^{2}$/s), indicating that a simple 1D mixing assumption fails and that multiple layers or a more complex vertical structure is needed. The authors conclude that WISE 0855 has patchy water clouds that modulate the upper atmosphere, while deeper zonal jets or temperature variations bring up CO- and PH3-enriched gas from the convective zone.
The premise it rests on. The 1D hydrostatic atmospheric models assume a constant eddy diffusion coefficient with height and a fixed mixing length equal to the pressure scale height, but the inferred Kzz values for CO, CO2, and PH3 differ by orders of magnitude, showing this assumption is violated.
If the paper is right (Pith's inferences, not the authors')
If WISE 0855's variability indeed arises from two independent layers, then time-series spectroscopy becomes a powerful tool to probe vertical atmospheric structure in brown dwarfs and directly imaged exoplanets, separating deep chemistry from upper cloud decks.
The inconsistency in inferred eddy diffusion coefficients for different molecules implies that the simple 1D constant-Kzz mixing model is inadequate; future models must account for vertical variations in mixing strength or other processes (e.g., metallicity variations, particle growth).
The detection of correlated CO and PH3 variations that track a common deeper pressure level suggests that PH3 could be used as a tracer of deep convection in cool atmospheres, similar to CO, but with a different chemical quenching pathway.
The requirement for variable water clouds to match the H2O line variability supports the existence of water ice clouds on Y dwarfs and provides empirical constraints on cloud condensation models at the lowest effective temperatures.
The failure to derive a consistent Kzz for CO, CO2, and PH3 suggests that either the chemical network for PH3 is incomplete (the assumed reaction may be wrong) or that the vertical profile of mixing is not well represented by a single eddy diffusion coefficient (e.g., mixing might vary with altitude due to latitude-dependent rotation effects).
The inferred quench pressure of PH3 (~24 bars) lies just above the condensation curves of ZnS, KCl, and Na2S, implying that those deeper clouds, if present, might not be the primary cause of the variability; instead, water clouds alone (or combined with deep temperature variations) can explain the observed modulations.
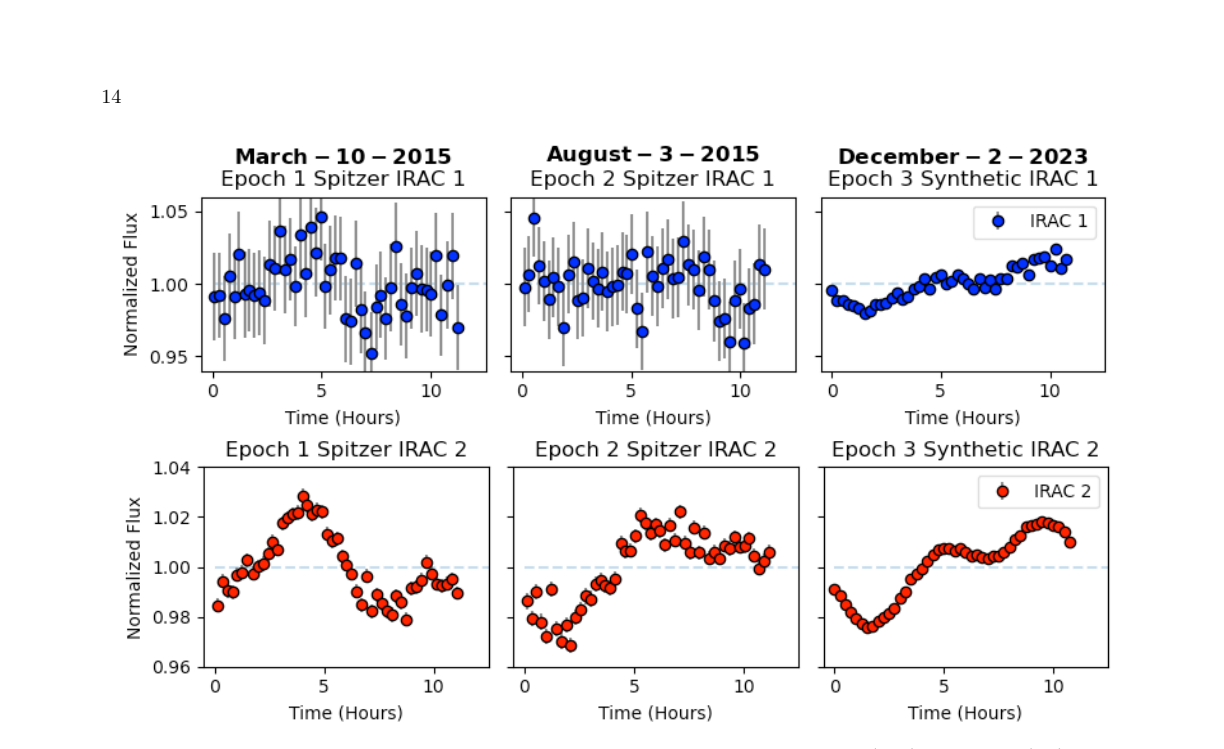
The periodicity analysis showing significant power at 5.4–5.6 hours (half the observation window) suggests that the rotation period might be ~11 hours or longer, but the lack of a consistent period across three epochs implies that the atmospheric features evolve on timescales of months to years, similar to weather on Jupiter.
Check this review
Pith stored no record of this review's passes and took no fingerprint of it. Reviews made by code from 13 Nov 2026 on carry both.
How often reviews like this one are right
Reviews like this one: written by deepseek-v4-flash, where what was read was not recorded.
How often objections from reviews like this one are right: not yet measured
Reviews by people
This review was written by a machine. No person has reviewed this paper on Pith yet. A scientist listed on Pith can review it for a fee, and their review is published here whatever it concludes.
The paper
Abstract
We present high signal-to-noise, medium resolution (R 1000), time-series JWST/NIRSpec spectra of WISE 0855 (265K), the coldest known brown dwarf. Medium resolution, time-series spectroscopy gives us the power to disentangle the effects of chemistry, temperature, and condensates on this cool world. Our observations span 11 hours with a 15 minute cadence covering 2.87 - 5.27 μm. The strongest time variable spectroscopic feature is carbon monoxide gas absorption producing modulations with a peak-to-peak amplitude up to 10% at some wavelengths. Using principal component analysis, we show that the variations in carbon monoxide and phosphine correlate with one another. By comparing our data to atmospheric and structure models we present evidence of patchy water clouds within the atmosphere of WISE 0855. We find that variations in CO and PH3 abundances must originate from quenched atmospheric pressures while variations in water cloud thickness occurs at lower pressures.
The paper's own sentences, arranged, kept beside the review and separate from it. Each label is drawn from a closed vocabulary; the number beside it is the probability the classifier gave that label. No sentence in this record was written by a model.
abstract compiled · 2026-09-23
The authors' main claim, as the classifier picked it out 0.59
“We find that variations in CO and PH$_{3}$ abundances must originate from quenched atmospheric pressures while variations in water cloud thickness occurs at lower pressures.”
How the main claim is stated: asserted 1.00
What the abstract itself states, as probabilities: claims first 0.07 · states limitation 0.11 · human participants 0.01 · controlled comparison 0.06 · randomized assignment 0.01 · states quantitative result 0.98 · compares with prior results 0.27 · mentions code or data availability 0.02
The abstract, sentence by sentence
This table labels the abstract only (arXiv listing abstract v1). The number is the probability the classifier gave the label.
| Sentence | Role | The authors' own work | States the main conclusion | Strength |
|---|---|---|---|---|
| We present high signal-to-noise, medium resolution (R ~ 1000), time-series JWST/NIRSpec spectra of WISE 0855 (265K), the coldest known brown dwarf. | contribution 0.83 | 0.96 | 0.03 | asserted 0.99 |
| Medium resolution, time-series spectroscopy gives us the power to disentangle the effects of chemistry, temperature, and condensates on this cool world. | method 0.57 | 0.59 | 0.05 | asserted 0.98 |
| Our observations span 11 hours with a 15 minute cadence covering 2.87 - 5.27 $\mu$m. | method 0.99 | 0.96 | 0.02 | asserted 0.99 |
| The strongest time variable spectroscopic feature is carbon monoxide gas absorption producing modulations with a peak-to-peak amplitude up to 10\% at some wavelengths. | result 1.00 | 0.94 | 0.12 | asserted 1.00 |
| Using principal component analysis, we show that the variations in carbon monoxide and phosphine correlate with one another. | result 0.96 | 0.96 | 0.10 | asserted 1.00 |
| By comparing our data to atmospheric and structure models we present evidence of patchy water clouds within the atmosphere of WISE 0855. | result 0.96 | 0.95 | 0.43 | asserted 0.74 |
| We find that variations in CO and PH$_{3}$ abundances must originate from quenched atmospheric pressures while variations in water cloud thickness occurs at lower pressures. | interpretation 0.92 | 0.94 | 0.50 | asserted 1.00 |
What kind of paper the classifier reports this is: empirical study 1.00 · evidence from observation or experiment 1.00
What was examined, and what was not
Sources read
- arXiv listing abstract v1
Not examined
- full text
- figures and tables
- references and citing sentences
- relations to other papers
Levels run
- P abstract
Not run
- S sections
- T body sentences
- C citations
- R cross-paper relations
How the labels were made
Compiled by classifier-1.13.0 via TypeSafe API, question bank abstract-p1-20260923, 2026-09-23: 1 request, 5,654 input tokens.
Every quoted sentence on this record is the authors'. Every label is from Pith's closed vocabulary, with the probability shown beside it. This record as JSON
Figures (21)
Figures are the authors', reproduced from the paper.
References (82)
- [1] Ackerman, A. S., & Marley, M. S. 2001, ApJ, 556, 872, doi: 10.1086/321540 Alves de Oliveira, C., Albert, L., Baraffe, I., et al. 2017, The Physics of Brown Dwarfs - Part #3, JWST Proposal. Cycle 1, ID. #1230 on Pithdoi:10.1086/321540
- [2] Apai, D., Nardiello, D., & Bedin, L. R. 2021, ApJ, 906, 64, doi: 10.3847/1538-4357/abcb97 on Pithdoi:10.3847/1538-4357/abcb97
- [3] Apai, D., Radigan, J., Buenzli, E., et al. 2013, ApJ, 768, 121, doi: 10.1088/0004-637X/768/2/121 on Pithdoi:10.1088/0004-637x/768/2/121
- [4] Apai, D., Karalidi, T., Marley, M. S., et al. 2017, Science, 357, 683, doi: 10.1126/science.aam9848 Astropy Collaboration, Robitaille, T. P., Tollerud, E. J., et al. 2013, A&A, 558, A33, doi: 10.1051/0004-6361/201322068 Astropy Collaboration, Price-Whelan, A. M., Sip˝ ocz, B. ... on Pithdoi:10.1126/science.aam9848
- [5] Bailer-Jones, C. A. L., & Mundt, R. 2001a, A&A, 367, 218, doi: 10.1051/0004-6361:20000416 —. 2001b, A&A, 374, 1071, doi: 10.1051/0004-6361:20010875 on Pithdoi:10.1051/0004-6361:20000416
- [6] Barton, E. J., Hill, C., Yurchenko, S. N., et al. 2017, JQSRT, 187, 453, doi: 10.1016/j.jqsrt.2016.10.024 on Pithdoi:10.1016/j.jqsrt.2016.10.024
- [7] Batalha, N., Rooney, C., & Mukherjee, S. 2020, natashabatalha/virga: Initial Release, v0.0, Zenodo, doi: 10.5281/zenodo.3759888 on Pithdoi:10.5281/zenodo.3759888
- [8] Beiler, S. A., Cushing, M. C., Kirkpatrick, J. D., et al. 2023, ApJL, 951, L48, doi: 10.3847/2041-8213/ace32c —. 2024a, ApJ, 973, 107, doi: 10.3847/1538-4357/ad6301 on Pithdoi:10.3847/2041-8213/ace32c
- [9] Beiler, S. A., Mukherjee, S., Cushing, M. C., et al. 2024b, ApJ, 973, 60, doi: 10.3847/1538-4357/ad6759 on Pithdoi:10.3847/1538-4357/ad6759
- [10] Biller, B. A., Apai, D., Bonnefoy, M., et al. 2021, MNRAS, 503, 743, doi: 10.1093/mnras/stab202 on Pithdoi:10.1093/mnras/stab202
- [11] Burgasser, A. J., Gonzales, E. C., Beiler, S. A., et al. 2025, Science, 390, 697, doi: 10.1126/science.adu0401 on Pithdoi:10.1126/science.adu0401
- [12] Burrows, A., Sudarsky, D., & Lunine, J. I. 2003, ApJ, 596, 587, doi: 10.1086/377709 on Pithdoi:10.1086/377709
- [13] Burrows, A., Marley, M., Hubbard, W. B., et al. 1997, ApJ, 491, 856, doi: 10.1086/305002 on Pithdoi:10.1086/305002
- [14] Cushing, M. C., Kirkpatrick, J. D., Gelino, C. R., et al. 2011, ApJ, 743, 50, doi: 10.1088/0004-637X/743/1/50 on Pithdoi:10.1088/0004-637x/743/1/50
- [15] Cushing, M. C., Trucks, J. L., Hardegree-Ullman, K. K., et al. 2026, arXiv e-prints, arXiv:2606.26411, doi: 10.48550/arXiv.2606.26411 25 on PithPith's reviewarXivdoi:10.48550/arxiv.2606.26411
- [16] Eisenhardt, P. R. M., Griffith, R. L., Stern, D., et al. 2010, AJ, 139, 2455, doi: 10.1088/0004-6256/139/6/2455 on Pithdoi:10.1088/0004-6256/139/6/2455
- [17] Esplin, T. L., Luhman, K. L., Cushing, M. C., et al. 2016, ApJ, 832, 58, doi: 10.3847/0004-637X/832/1/58 on Pithdoi:10.3847/0004-637x/832/1/58
- [18] Faherty, J. K., Tinney, C. G., Skemer, A., & Monson, A. J. 2014, ApJL, 793, L16, doi: 10.1088/2041-8205/793/1/L16 on Pithdoi:10.1088/2041-8205/793/1/l16
- [19] Fegley, Jr., B., & Lodders, K. 1994, Icarus, 110, 117, doi: 10.1006/icar.1994.1111 on PitharXiv
- [20] Fuda, N., & Apai, D. 2024, ApJL, 975, L32, doi: 10.3847/2041-8213/ad87e9 on Pithdoi:10.3847/2041-8213/ad87e9
show 62 more
- [21] Ge, H., Zhang, X., Fletcher, L. N., et al. 2019, AJ, 157, 89, doi: 10.3847/1538-3881/aafba7 on Pithdoi:10.3847/1538-3881/aafba7
- [22] Gelino, C. R., Marley, M. S., Holtzman, J. A., Ackerman, A. S., & Lodders, K. 2002, ApJ, 577, 433, doi: 10.1086/342150 on Pithdoi:10.1086/342150
- [23] Gordon, I., Rothman, L., Hill, C., et al. 2017, Journal of Quantitative Spectroscopy and Radiative Transfer, 203, 3, doi: https://doi.org/10.1016/j.jqsrt.2017.06.038 on Pithdoi:10.1016/j.jqsrt.2017.06.038
- [24] Grassi, D., Adriani, A., Mura, A., et al. 2020, Journal of Geophysical Research (Planets), 125, e06206, doi: 10.1029/2019JE006206 on Pithdoi:10.1029/2019je006206
- [25] Hammond, M., Mayne, N. J., Seviour, W. J. M., et al. 2023, MNRAS, 525, 150, doi: 10.1093/mnras/stad2265 on Pithdoi:10.1093/mnras/stad2265
- [26] Hargreaves, R. J., Gordon, I. E., Rey, M., et al. 2020, ApJS, 247, 55, doi: 10.3847/1538-4365/ab7a1a on Pithdoi:10.3847/1538-4365/ab7a1a
- [27] Huang, X., Gamache, R. R., Freedman, R. S., Schwenke, D. W., & Lee, T. J. 2014, JQSRT, 147, 134, doi: 10.1016/j.jqsrt.2014.05.015 on Pithdoi:10.1016/j.jqsrt.2014.05.015
- [28] Kirkpatrick, J. D., Gelino, C. R., Cushing, M. C., et al. 2012, ApJ, 753, 156, doi: 10.1088/0004-637X/753/2/156 on Pithdoi:10.1088/0004-637x/753/2/156
- [29] Kirkpatrick, J. D., Gelino, C. R., Faherty, J. K., et al. 2021, The Astrophysical Journal Supplement Series, 253, 7, doi: 10.3847/1538-4365/abd107 K¨ uhnle, H., Patapis, P., Molli` ere, P., et al. 2025, A&A, 695, A224, doi: 10.1051/0004-6361/202452547 K¨ uhnle, H. 2025, Append... on Pithdoi:10.3847/1538-4365/abd107
- [30] Lacy, B., & Burrows, A. 2023, ApJ, 950, 8, doi: 10.3847/1538-4357/acc8cb on Pithdoi:10.3847/1538-4357/acc8cb
- [31] Lee, E. K. H., Tsai, S.-M., Moses, J. I., et al. 2024, ApJ, 976, 231, doi: 10.3847/1538-4357/ad8915 on Pithdoi:10.3847/1538-4357/ad8915
- [32] Lew, B. W. P., Roellig, T., Batalha, N. E., et al. 2024, AJ, 167, 237, doi: 10.3847/1538-3881/ad3425 on Pithdoi:10.3847/1538-3881/ad3425
- [33] Li, G., Gordon, I. E., Rothman, L. S., et al. 2015, The Astrophysical Journal Supplement Series, 216, 15, doi: 10.1088/0067-0049/216/1/15 on Pithdoi:10.1088/0067-0049/216/1/15
- [34] Liu, M. C., Delorme, P., Dupuy, T. J., et al. 2011, ApJ, 740, 108, doi: 10.1088/0004-637X/740/2/108 on Pithdoi:10.1088/0004-637x/740/2/108
- [35] Liu, P., Biller, B. A., Vos, J. M., et al. 2024, MNRAS, 527, 6624, doi: 10.1093/mnras/stad3502 on Pithdoi:10.1093/mnras/stad3502
- [36] Lodders, K., & Fegley, B. 2002, Icarus, 155, 393, doi: 10.1006/icar.2001.6740 on PitharXiv
- [37] Luhman, K. L. 2014, ApJL, 786, L18, doi: 10.1088/2041-8205/786/2/L18 on Pithdoi:10.1088/2041-8205/786/2/l18
- [38] Luhman, K. L., & Esplin, T. L. 2014, ApJ, 796, 6, doi: 10.1088/0004-637X/796/1/6 —. 2016, AJ, 152, 78, doi: 10.3847/0004-6256/152/3/78 on Pithdoi:10.1088/0004-637x/796/1/6
- [39] Luhman, K. L., Tremblin, P., Alves de Oliveira, C., et al. 2024, AJ, 167, 5, doi: 10.3847/1538-3881/ad0b72 on Pithdoi:10.3847/1538-3881/ad0b72
- [40] Lupu, R., Freedman, R., Gharib-Nezhad, E., & Molliere, P. 2022, High resolution opacities for H2/He atmospheres, Zenodo, doi: 10.5281/zenodo.6600976 on Pithdoi:10.5281/zenodo.6600976
- [41] Mang, J., Gao, P., Hood, C. E., et al. 2022, ApJ, 927, 184, doi: 10.3847/1538-4357/ac51d3 on Pithdoi:10.3847/1538-4357/ac51d3
- [42] Mang, J., Batalha, N. E., Morley, C. V., et al. 2026, ApJ, 1000, 98, doi: 10.3847/1538-4357/ae47ff on Pithdoi:10.3847/1538-4357/ae47ff
- [43] Marley, M. S., Saumon, D., Visscher, C., et al. 2021, ApJ, 920, 85, doi: 10.3847/1538-4357/ac141d on Pithdoi:10.3847/1538-4357/ac141d
- [44] Miles, B. E., Skemer, A. J. I., Morley, C. V., et al. 2020, AJ, 160, 63, doi: 10.3847/1538-3881/ab9114 on Pithdoi:10.3847/1538-3881/ab9114
- [45] Morley, C. V., Fortney, J. J., Marley, M. S., et al. 2012, ApJ, 756, 172, doi: 10.1088/0004-637X/756/2/172 on Pithdoi:10.1088/0004-637x/756/2/172
- [46] Morley, C. V., Marley, M. S., Fortney, J. J., et al. 2014, ApJ, 787, 78, doi: 10.1088/0004-637X/787/1/78 on Pithdoi:10.1088/0004-637x/787/1/78
- [47] Morley, C. V., Skemer, A. J., Allers, K. N., et al. 2018, ApJ, 858, 97, doi: 10.3847/1538-4357/aabe8b on Pithdoi:10.3847/1538-4357/aabe8b
- [48] Mukherjee, S., Batalha, N. E., Fortney, J. J., & Marley, M. S. 2023, ApJ, 942, 71, doi: 10.3847/1538-4357/ac9f48 on Pithdoi:10.3847/1538-4357/ac9f48
- [49] Pedregosa, F., Varoquaux, G., Gramfort, A., et al. 2011, Journal of Machine Learning Research, 12, 2825 on Pith
- [50] Pine, A. S. 1992, JChPh, 97, 773, doi: 10.1063/1.463943 on Pithdoi:10.1063/1.463943
- [51] Plummer, M. K., Wang, J., Artigau, ´E., Doyon, R., & Su´ arez, G. 2024, ApJ, 970, 62, doi: 10.3847/1538-4357/ad4f89 on Pithdoi:10.3847/1538-4357/ad4f89
- [52] Polyansky, O. L., Kyuberis, A. A., Zobov, N. F., et al. 2018, MNRAS, 480, 2597, doi: 10.1093/mnras/sty1877 on Pithdoi:10.1093/mnras/sty1877
- [53] Radigan, J., Jayawardhana, R., Lafreni` ere, D., et al. 2012, ApJ, 750, 105, doi: 10.1088/0004-637X/750/2/105 on Pithdoi:10.1088/0004-637x/750/2/105
- [54] Rothman, L. S., Gordon, I. E., Barber, R. J., et al. 2010, JQSRT, 111, 2139, doi: 10.1016/j.jqsrt.2010.05.001 on Pithdoi:10.1016/j.jqsrt.2010.05.001
- [55] Rowland, M. J., Morley, C. V., Miles, B. E., et al. 2024, ApJL, 977, L49, doi: 10.3847/2041-8213/ad9744 on Pithdoi:10.3847/2041-8213/ad9744
- [56] Saumon, D., & Marley, M. S. 2008, ApJ, 689, 1327, doi: 10.1086/592734 on Pithdoi:10.1086/592734
- [57] Freedman, R. S. 2012, The Astrophysical Journal, 750, 74, doi: 10.1088/0004-637X/750/1/74 26 on Pithdoi:10.1088/0004-637x/750/1/74
- [58] Gelino, C. R. 2016, ApJL, 823, L35, doi: 10.3847/2041-8205/823/2/L35 on Pithdoi:10.3847/2041-8205/823/2/l35
- [59] Schrader, M. A., Vos, J. M., Nasedkin, E., et al. 2026, arXiv e-prints, arXiv:2607.26182, doi: 10.48550/arXiv.2607.26182 on PithPith's reviewarXivdoi:10.48550/arxiv.2607.26182
- [60] Showman, A. P., & Kaspi, Y. 2013, ApJ, 776, 85, doi: 10.1088/0004-637X/776/2/85 on Pithdoi:10.1088/0004-637x/776/2/85
- [61] Showman, A. P., Tan, X., & Zhang, X. 2019, The Astrophysical Journal, 883, 4, doi: 10.3847/1538-4357/ab384a on Pithdoi:10.3847/1538-4357/ab384a
- [62] Skemer, A., Miles, B. E., Morley, C., et al. 2021, Water Ice Clouds and Weather on the Coldest Brown Dwarf, JWST Proposal. Cycle 1, ID. #2327 on Pith
- [63] Skemer, A. J., Morley, C. V., Allers, K. N., et al. 2016, ApJL, 826, L17, doi: 10.3847/2041-8205/826/2/L17 on Pithdoi:10.3847/2041-8205/826/2/l17
- [64] Yurchenko, S. N. 2014, Monthly Notices of the Royal Astronomical Society, 446, 2337, doi: 10.1093/mnras/stu2246 Su´ arez, G., Vos, J. M., Metchev, S., Faherty, J. K., & Cruz, K. 2023, ApJL, 954, L6, doi: 10.3847/2041-8213/acec4b Su´ arez, G., Faherty, J. K., Burningham, B., et... on Pithdoi:10.1093/mnras/stu2246
- [65] Tan, X., & Showman, A. P. 2021, MNRAS, 502, 2198, doi: 10.1093/mnras/stab097 on Pithdoi:10.1093/mnras/stab097
- [66] Tinney, C. G., & Tolley, A. J. 1999, MNRAS, 304, 119, doi: 10.1046/j.1365-8711.1999.02297.x on PitharXiv
- [67] Virtanen, P., Gommers, R., Oliphant, T. E., et al. 2020, Nature Methods, 17, 261, doi: 10.1038/s41592-019-0686-2 on Pithdoi:10.1038/s41592-019-0686-2
- [68] Visscher, C. 2020, Journal of Geophysical Research (Planets), 125, e06526, doi: 10.1029/2020JE006526 on Pithdoi:10.1029/2020je006526
- [69] Visscher, C., & Fegley, Jr., B. 2005, ApJ, 623, 1221, doi: 10.1086/428493 on Pithdoi:10.1086/428493
- [70] Visscher, C., Lodders, K., & Fegley, Jr., B. 2006, ApJ, 648, 1181, doi: 10.1086/506245 on Pithdoi:10.1086/506245
- [71] Visscher, C., Moses, J. I., & Saslow, S. A. 2010, Icarus, 209, 602, doi: 10.1016/j.icarus.2010.03.029 on Pithdoi:10.1016/j.icarus.2010.03.029
- [72] Vos, J. M., Allers, K. N., & Biller, B. A. 2017, ApJ, 842, 78, doi: 10.3847/1538-4357/aa73cf on Pithdoi:10.3847/1538-4357/aa73cf
- [73] Vos, J. M., Faherty, J. K., Gagn´ e, J., et al. 2022, ApJ, 924, 68, doi: 10.3847/1538-4357/ac4502 on Pithdoi:10.3847/1538-4357/ac4502
- [74] Vos, J. M., Biller, B. A., Bonavita, M., et al. 2019, MNRAS, 483, 480, doi: 10.1093/mnras/sty3123 on Pithdoi:10.1093/mnras/sty3123
- [75] Vos, J. M., Biller, B. A., Allers, K. N., et al. 2020, AJ, 160, 38, doi: 10.3847/1538-3881/ab9642 on Pithdoi:10.3847/1538-3881/ab9642
- [76] Wilson, M. J., Limbach, M. A., Skemer, A. J., et al. 2025, arXiv e-prints, arXiv:2510.24575, doi: 10.48550/arXiv.2510.24575 on Pithdoi:10.48550/arxiv.2510.24575
- [77] Wilzewski, J. S., Gordon, I. E., Kochanov, R. V., Hill, C., & Rothman, L. S. 2016, JQSRT, 168, 193, doi: 10.1016/j.jqsrt.2015.09.003 on Pithdoi:10.1016/j.jqsrt.2015.09.003
- [78] Wogan, N. F., Mang, J., Batalha, N. E., et al. 2025, Research Notes of the American Astronomical Society, 9, 108, doi: 10.3847/2515-5172/add407 on Pithdoi:10.3847/2515-5172/add407
- [79] Yurchenko, S. N., Barber, R. J., & Tennyson, J. 2011, Monthly Notices of the Royal Astronomical Society, 413, 1828, doi: 10.1111/j.1365-2966.2011.18261.x on PitharXiv
- [80] Yurchenko, S. N., & Tennyson, J. 2014, MNRAS, 440, 1649, doi: 10.1093/mnras/stu326 on Pithdoi:10.1093/mnras/stu326
- [81] Yurchenko, S. N., Tennyson, J., Barber, R. J., & Thiel, W. 2013, Journal of Molecular Spectroscopy, 291, 69, doi: 10.1016/j.jms.2013.05.014 on Pithdoi:10.1016/j.jms.2013.05.014
- [82] Zahnle, K. J., & Marley, M. S. 2014, ApJ, 797, 41, doi: 10.1088/0004-637X/797/1/41 on Pithdoi:10.1088/0004-637x/797/1/41
Cited by 2 Pith papers
Reviewed papers on Pith that cite this one. OpenAlex reports about 3 citations worldwide. The full citation record
- Dwarfs of Fire and Ice: UV-Irradiation-Driven Thermal Inversion, Disequilibrium Chemistry, and a Cloud-Free Atmosphere in a Strongly Irradiated Brown Dwarf Probed by JWST/NIRSpec Phase-Resolved Spectroscopy astro-ph.EP · Nov 2026
- Beyond the Fast Rotators: A JWST Multi-Cycle Treasury Survey of Substellar Weather astro-ph.IM · Nov 2026
Challenges and discussion
Disagree with the review, or know something it missed? Leave a comment, or challenge this review formally: a challenge becomes a permanent entry in this paper's record, and its decision is published here.
Come back by email
A short list of the week's newly reviewed papers. Nothing is sent until you confirm from your inbox, and every email has a link that stops it. No account.
No comments yet.
Sign in to comment