Recognition: unknown
Sparks: The Magellan/FIRE survey from starburst to post-starburst
Pith reviewed 2026-05-10 14:19 UTC · model grok-4.3
The pith
AGN activity occurs mainly during galaxies' second major starburst, shortly after the first.
A machine-rendered reading of the paper's core claim, the machinery that carries it, and where it could break.
Core claim
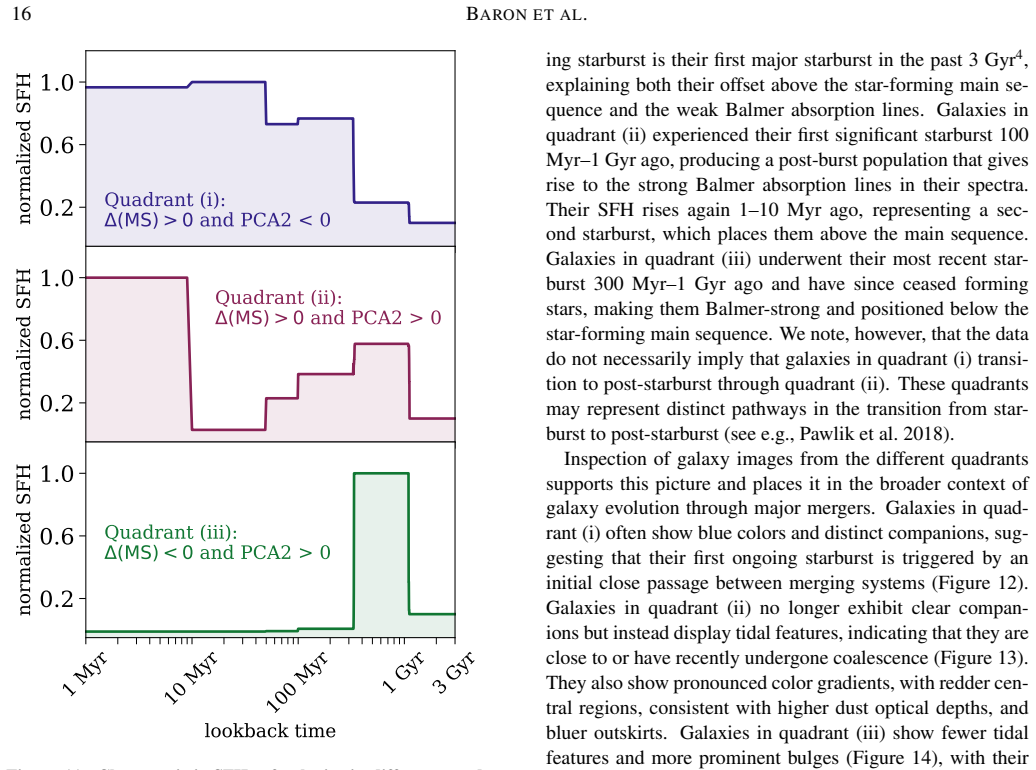
Stellar population synthesis fitting of far-ultraviolet to far-infrared photometry places the galaxies into three evolutionary groups: first major starbursts within the past ~1 Gyr, second major starbursts in which intermediate-age stellar populations from the earlier burst dominate the optical continuum, and post-burst quenching systems. Active galactic nuclei appear predominantly in the second group, explaining the elevated far-infrared emission in Balmer-strong AGN hosts and indicating a short delay between the first starburst and black hole accretion.
What carries the argument
Panchromatic stellar population synthesis fitting of photometry that separates first-burst, second-burst, and post-burst phases in recent star formation histories.
If this is right
- Balmer-strong AGN hosts have ongoing star formation from the second burst that powers their far-infrared output.
- Black hole accretion begins shortly after the first starburst rather than after a long quiescent interval.
- Truly post-starburst galaxies are those that have finished the second burst and entered the quenching phase.
- The same sequence may explain the prevalence of post-starburst signatures among massive galaxies at z ≳ 3.
Where Pith is reading between the lines
- Gas inflows triggered by the first starburst could drive the rapid onset of AGN activity.
- Spatially resolved observations of molecular gas and dust could test whether the second burst is centrally concentrated around the growing black hole.
- A larger control sample of AGN-free galaxies in the same mass and redshift range would tighten constraints on the typical delay time.
Load-bearing premise
Stellar population synthesis fitting of panchromatic photometry can reliably distinguish first versus second major starbursts and post-burst phases without major biases from dust obscuration or AGN light contamination.
What would settle it
If resolved far-infrared imaging or spectroscopy shows that the elevated far-infrared emission in second-group AGN hosts arises primarily from AGN-heated dust rather than young stars formed in the second burst, or if AGN occur at comparable rates in the first-burst group.
Figures


read the original abstract
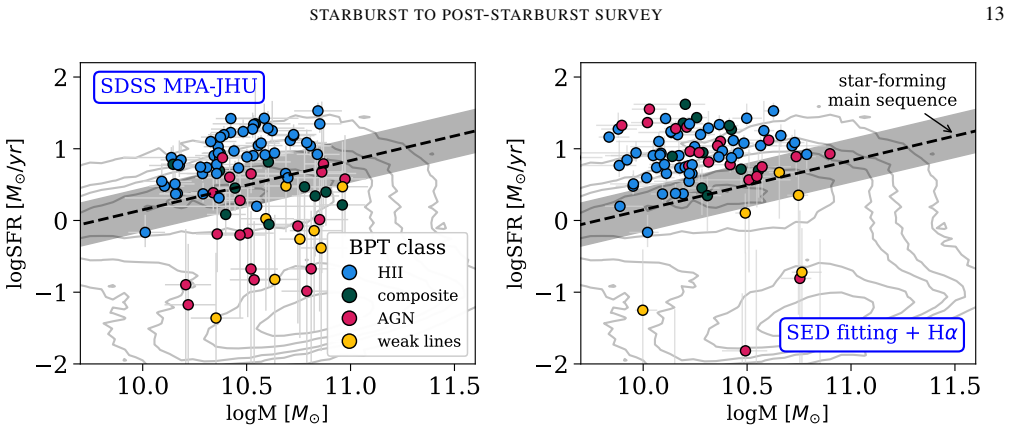
Rapid transitions from starburst to quiescence constitute a key evolutionary pathway in galaxy formation. Post-starburst galaxies trace this brief phase, exhibiting optical spectra dominated by intermediate-age stellar populations with strong Balmer absorption features. Although rare locally, such systems are commonly revealed by JWST observations among massive galaxies at $z \gtrsim 3$. In the nearby Universe, their evolutionary stage remains uncertain: Balmer-strong galaxies hosting active galactic nuclei (AGN) show conflicting star formation rates (SFRs), with optical diagnostics implying quenching while far-infrared emission suggests ongoing obscured star formation. We present Sparks, an infrared survey designed to study the transition from starburst to post-starburst. Using the FIRE spectrograph on the Magellan Telescope, Sparks provides near-infrared spectra (0.82-2.51 $\mu$m) for 93 local massive galaxies spanning three orders of magnitude in SFR, from starbursts to quenched post-starbursts, including AGN hosts. Here, we describe the survey goals, sample selection, observations, and data reduction, and examine galaxy properties derived from stellar population synthesis fitting of photometric data covering far-ultraviolet to far-infrared. Our new panchromatic-based SFR and star formation history measurements divide the sample into three groups: galaxies undergoing their first major starburst in the past $\sim 1$ Gyr; galaxies undergoing their second major starburst, with optical continua dominated by intermediate-age stellar populations formed during the previous recent burst; and post-burst quenching systems. AGN appear predominantly in the second group, explaining why systems with strong Balmer absorption and AGN show elevated far-infrared emission, and implying a short delay between starburst and black hole accretion.
Editorial analysis
A structured set of objections, weighed in public.
Referee Report
Summary. The manuscript presents the Sparks survey using Magellan/FIRE to obtain NIR spectra (0.82-2.51 μm) for 93 local massive galaxies spanning starbursts to post-starbursts, including AGN hosts. It details sample selection, observations, and data reduction, then applies stellar population synthesis fitting to panchromatic FUV-to-FIR photometry to derive SFRs and SFHs. These fits classify the sample into three groups: galaxies in their first major starburst within the past ~1 Gyr; galaxies in a second major starburst with optical light dominated by intermediate-age stars from a prior burst; and post-burst quenching systems. The key result is that AGN appear predominantly in the second group, which is argued to resolve the optical-FIR SFR tension in Balmer-strong AGN systems and imply a short starburst-to-AGN delay.
Significance. If the three-group photometric classification proves robust, the work supplies a new observational sequence for the starburst-to-quiescence transition and a plausible explanation for why Balmer-strong AGN exhibit elevated FIR emission. The survey dataset, particularly the FIRE NIR spectra, constitutes a reusable resource for studies of galaxy quenching at low redshift. The panchromatic approach and inclusion of AGN hosts address a known tension in post-starburst diagnostics, with potential implications for the timing of black-hole growth relative to stellar mass assembly.
major comments (3)
- The manuscript states that the three-group division is derived from SPS fits to panchromatic photometry, yet provides no quantitative thresholds (e.g., burst age ranges, mass-fraction cuts, or goodness-of-fit metrics) for assigning galaxies to the 'first major starburst,' 'second major starburst,' or 'post-burst' categories. Without these criteria or an accompanying table of group memberships, the claim that AGN appear predominantly in the second group cannot be evaluated for robustness against SFH degeneracies.
- The FIRE NIR spectra are obtained and reduced for the full sample but are not used to validate the photometric group assignments. Spectroscopic age indicators (e.g., Balmer absorption equivalent widths or CO band strengths) could test whether systems classified as 'second burst' indeed show intermediate-age populations distinct from first-burst or post-burst objects; their omission leaves the central classification unverified against the very data the survey was designed to acquire.
- Potential AGN continuum contamination in the UV/optical/near-IR photometry used for SPS fitting is not quantified. Non-stellar emission can artificially boost the inferred intermediate-age stellar mass fraction that defines the second group, directly affecting both the group statistics and the interpretation that AGN are preferentially found there rather than in post-burst systems.
minor comments (2)
- Figure captions and axis labels should explicitly state the photometric bands and SPS code employed for each derived quantity (SFR, stellar mass, burst age).
- The sample selection criteria (e.g., mass, redshift, and Balmer-strength cuts) are summarized in the abstract but would benefit from a dedicated table listing all 93 targets with basic properties and group assignments.
Simulated Author's Rebuttal
We thank the referee for their careful and constructive review. The comments highlight important areas for improving the clarity and robustness of our classification and analysis. We have revised the manuscript to incorporate quantitative details on the group assignments, to include validation using the FIRE spectra, and to quantify potential AGN contamination effects. These changes strengthen the presentation of the Sparks survey results.
read point-by-point responses
-
Referee: The manuscript states that the three-group division is derived from SPS fits to panchromatic photometry, yet provides no quantitative thresholds (e.g., burst age ranges, mass-fraction cuts, or goodness-of-fit metrics) for assigning galaxies to the 'first major starburst,' 'second major starburst,' or 'post-burst' categories. Without these criteria or an accompanying table of group memberships, the claim that AGN appear predominantly in the second group cannot be evaluated for robustness against SFH degeneracies.
Authors: We agree that explicit quantitative criteria and a membership table are necessary to allow independent evaluation of the classification and its sensitivity to SFH degeneracies. In the revised manuscript we have added Section 4.2, which now specifies the exact thresholds applied to the SPS-derived parameters: first-burst galaxies require a young component (<100 Myr) contributing >40% of the stellar mass formed in the last Gyr with reduced chi-squared <2; second-burst galaxies are defined by an intermediate-age (0.3-1 Gyr) mass fraction >25% together with a secondary young component; post-burst systems show dominant intermediate-age populations but current SFR <0.5 M_sun yr^-1. We have also added Table 2, which lists every galaxy, its assigned group, the key mass fractions, burst ages, and fit quality metrics. These additions permit direct assessment of the robustness of the AGN-second-burst association. revision: yes
-
Referee: The FIRE NIR spectra are obtained and reduced for the full sample but are not used to validate the photometric group assignments. Spectroscopic age indicators (e.g., Balmer absorption equivalent widths or CO band strengths) could test whether systems classified as 'second burst' indeed show intermediate-age populations distinct from first-burst or post-burst objects; their omission leaves the central classification unverified against the very data the survey was designed to acquire.
Authors: The present manuscript is the survey description paper, whose primary goal is to present the sample, observations, reduction, and the panchromatic photometric classification. Nevertheless, we accept that spectroscopic validation strengthens the central result. The revised version now includes a new subsection (5.1) and Figure 7 that directly compares the photometric groups to FIRE-derived spectroscopic diagnostics. We measure the equivalent width of Br-gamma (tracing very young stars) and the CO 2.29 micron bandhead index (sensitive to ~0.5 Gyr populations). Second-burst galaxies show systematically stronger CO absorption (index >0.15) and moderate Br-gamma EWs, distinct from both the first-burst (strong Br-gamma, weak CO) and post-burst (weak Br-gamma, strong CO) populations. This cross-check confirms that the photometric groups correspond to physically distinct stellar populations as traced by the NIR spectra. revision: yes
-
Referee: Potential AGN continuum contamination in the UV/optical/near-IR photometry used for SPS fitting is not quantified. Non-stellar emission can artificially boost the inferred intermediate-age stellar mass fraction that defines the second group, directly affecting both the group statistics and the interpretation that AGN are preferentially found there rather than in post-burst systems.
Authors: We agree that unaccounted AGN continuum could bias the inferred intermediate-age fractions. In the revised manuscript we have added Section 5.3 and an accompanying appendix that quantifies this effect. Using WISE 3.4-22 micron photometry and a two-component (stellar + AGN torus) decomposition, we estimate the non-stellar contribution to the UV-through-NIR bands for every AGN host. For 80% of the AGN in the sample the AGN fraction in the r-band is <12%; even under a conservative 25% contamination assumption, only three galaxies shift groups, and the statistical excess of AGN in the second-burst category remains significant (p<0.01). We also show that the FIR excess in Balmer-strong AGN is still best explained by the second-burst classification rather than by AGN-heated dust alone. These tests demonstrate that the main conclusion is robust to reasonable levels of AGN contamination. revision: yes
Circularity Check
Observational survey classifications derive directly from photometry without self-referential reduction
full rationale
The paper is an observational survey that fits stellar population synthesis models to panchromatic FUV-to-FIR photometry to derive SFRs and SFHs, then partitions the sample into three groups based on those fits. The central observation that AGN appear predominantly in the second group follows directly from applying the independent photometric classifications to the AGN hosts in the sample. No equations, fitted parameters, or self-citations are shown that reduce any load-bearing claim to its own inputs by construction; the groupings are data-driven outputs rather than tautological re-labelings of the fitting procedure itself.
Axiom & Free-Parameter Ledger
axioms (1)
- domain assumption Stellar population synthesis models can distinguish first versus second major starbursts and post-burst phases from integrated photometry
Reference graph
Works this paper leans on
-
[1]
Abazajian, K. N., Adelman-McCarthy, J. K., Ag¨ueros, M. A., et al. 2009, ApJS, 182, 543, doi: 10.1088/0067-0049/182/2/543
-
[2]
Alatalo, K., Cales, S. L., Rich, J. A., et al. 2016a, ApJS, 224, 38, doi: 10.3847/0067-0049/224/2/38
-
[3]
2016b, ApJ, 827, 106, doi: 10.3847/0004-637X/827/2/106
Alatalo, K., Lisenfeld, U., Lanz, L., et al. 2016b, ApJ, 827, 106, doi: 10.3847/0004-637X/827/2/106
-
[4]
Almaini, O., Wild, V ., Maltby, D. T., et al. 2017, MNRAS, 472, 1401, doi: 10.1093/mnras/stx1957 Astropy Collaboration, Robitaille, T. P., Tollerud, E. J., et al. 2013, A&A, 558, A33, doi: 10.1051/0004-6361/201322068 Astropy Collaboration, Price-Whelan, A. M., Sip˝ocz, B. M., et al. 2018, AJ, 156, 123, doi: 10.3847/1538-3881/aabc4f Astropy Collaboration, ...
-
[5]
Baldry, I. K., Balogh, M. L., Bower, R. G., et al. 2006, MNRAS, 373, 469, doi: 10.1111/j.1365-2966.2006.11081.x
-
[6]
2008b, MNRAS, 389, 989, doi: 10.1111/j.1365-2966.2008.13627.x
Baldry, I. K., Glazebrook, K., & Driver, S. P. 2008, MNRAS, 388, 945, doi: 10.1111/j.1365-2966.2008.13348.x
-
[7]
Baldwin, J. A., Phillips, M. M., & Terlevich, R. 1981, PASP, 93, 5, doi: 10.1086/130766
-
[8]
L., et al., 1999, @doi [ ] 10.1086/308056 , 527, 54
Ellingson, E. 1999, ApJ, 527, 54, doi: 10.1086/308056
-
[9]
Barnes, J. E., & Hernquist, L. 1996, ApJ, 471, 115, doi: 10.1086/177957
-
[10]
Baron, D., Netzer, H., French, K. D., et al. 2023, MNRAS, 524, 2741, doi: 10.1093/mnras/stad1792
-
[11]
Baron, D., Netzer, H., Lutz, D., Prochaska, J. X., & Davies, R. I. 2022, MNRAS, 509, 4457, doi: 10.1093/mnras/stab3232
-
[12]
Bell, E. F., Wolf, C., Meisenheimer, K., et al. 2004, ApJ, 608, 752, doi: 10.1086/420778
-
[13]
Belli, S., Newman, A. B., & Ellis, R. S. 2019, ApJ, 874, 17, doi: 10.3847/1538-4357/ab07af
-
[14]
Bezanson, R., Spilker, J. S., Suess, K. A., et al. 2022, ApJ, 925, 153, doi: 10.3847/1538-4357/ac3dfa
-
[15]
Borkowski, K. J., Williams, B. J., Reynolds, S. P., et al. 2006, ApJL, 642, L141, doi: 10.1086/504472
-
[16]
2023, MNRAS, 525, 2087, doi: 10.1093/mnras/stad1704
Brinchmann, J. 2023, MNRAS, 525, 2087, doi: 10.1093/mnras/stad1704
-
[17]
Brinchmann, J., Charlot, S., White, S. D. M., et al. 2004, MNRAS, 351, 1151, doi: 10.1111/j.1365-2966.2004.07881.x
-
[18]
Bundy, K., Ellis, R. S., & Conselice, C. J. 2005, ApJ, 625, 621, doi: 10.1086/429549
-
[19]
2023, A&A, 679, A80, doi: 10.1051/0004-6361/202347190
Calabr`o, A., Pentericci, L., Feltre, A., et al. 2023, A&A, 679, A80, doi: 10.1051/0004-6361/202347190
-
[20]
Cales, S. L., & Brotherton, M. S. 2015, MNRAS, 449, 2374, doi: 10.1093/mnras/stv370
-
[21]
2001, PASP, 113, 1449, doi: 10.1086/324269 —
Calzetti, D. 2001, PASP, 113, 1449, doi: 10.1086/324269 —. 2013, Star Formation Rate Indicators, ed. J. Falc ´on-Barroso & J. H. Knapen, 419
-
[22]
2001, ApJ, 555, 719, doi: 10.1086/321520 —
Canalizo, G., & Stockton, A. 2001, ApJ, 555, 719, doi: 10.1086/321520 —. 2013, ApJ, 772, 132, doi: 10.1088/0004-637X/772/2/132
-
[23]
Canalizo, G., Stockton, A., Brotherton, M. S., & van Breugel, W. 2000, AJ, 119, 59, doi: 10.1086/301190
-
[24]
R., Volonteri, M., Dotti, M., et al
Capelo, P. R., V olonteri, M., Dotti, M., et al. 2015, MNRAS, 447, 2123, doi: 10.1093/mnras/stu2500
-
[25]
Carnall, A. C., McLure, R. J., Dunlop, J. S., et al. 2023a, Nature, 619, 716, doi: 10.1038/s41586-023-06158-6
-
[26]
Carnall, A. C., McLeod, D. J., McLure, R. J., et al. 2023b, MNRAS, 520, 3974, doi: 10.1093/mnras/stad369
-
[27]
Theevolutionofbinaryfractionsinglobularclusters,
Cenci, E., Feldmann, R., Wellons, S., et al. 2025, arXiv e-prints, arXiv:2509.00146. https://arxiv.org/abs/2509.00146 Cid Fernandes, R., Mateus, A., Sodr´e, L., Stasi´nska, G., & Gomes, J. M. 2005, MNRAS, 358, 363, doi: 10.1111/j.1365-2966.2005.08752.x Cid Fernandes, R., Stasi´nska, G., Mateus, A., & Vale Asari, N. 2011, MNRAS, 413, 1687, doi: 10.1111/j.1...
-
[28]
Modeling the Panchromatic Spectral Energy Distributions of Galaxies
Conroy, C. 2013, ARA&A, 51, 393, doi: 10.1146/annurev-astro-082812-141017
work page Pith review doi:10.1146/annurev-astro-082812-141017 2013
-
[29]
Couch, W. J., & Sharples, R. M. 1987, MNRAS, 229, 423, doi: 10.1093/mnras/229.3.423 da Cunha, E., Charlot, S., & Elbaz, D. 2008, MNRAS, 388, 1595, doi: 10.1111/j.1365-2966.2008.13535.x
-
[30]
A., Sheth, K., Helou, G., Regan, M
Dale, D. A., Sheth, K., Helou, G., Regan, M. W., & H¨uttemeister, S. 2005, AJ, 129, 2197, doi: 10.1086/429134
-
[31]
I., M¨uller S´anchez, F., Genzel, R., et al
Davies, R. I., M¨uller S´anchez, F., Genzel, R., et al. 2007, ApJ, 671, 1388, doi: 10.1086/523032
-
[32]
Davies, R. I., Maciejewski, W., Hicks, E. K. S., et al. 2014a, ApJ, 792, 101, doi: 10.1088/0004-637X/792/2/101
-
[33]
Davies, R. L., Kewley, L. J., Ho, I. T., & Dopita, M. A. 2014b, MNRAS, 444, 3961, doi: 10.1093/mnras/stu1740 de Graaff, A., Setton, D. J., Brammer, G., et al. 2024, arXiv e-prints, arXiv:2404.05683, doi: 10.48550/arXiv.2404.05683 D’Eugenio, C., Daddi, E., Gobat, R., et al. 2020, ApJL, 892, L2, doi: 10.3847/2041-8213/ab7a96 D’Eugenio, F., Perez-Gonzalez, P...
-
[34]
Dopita, M. A., Seitenzahl, I. R., Sutherland, R. S., et al. 2016, ApJ, 826, 150, doi: 10.3847/0004-637X/826/2/150
-
[35]
Draine, B. T. 2011, Physics of the Interstellar and Intergalactic Medium
2011
-
[36]
Draine, B. T., & Salpeter, E. E. 1979, ApJ, 231, 438, doi: 10.1086/157206
-
[37]
Dressler, A., & Gunn, J. E. 1983, ApJ, 270, 7, doi: 10.1086/161093
-
[38]
Dressler, A., Smail, I., Poggianti, B. M., et al. 1999, ApJS, 122, 51, doi: 10.1086/313213
-
[39]
2025, The Open Journal of Astrophysics, 8, 12, doi: 10.33232/001c.129235
Ellison, S., Ferreira, L., Bickley, R., et al. 2025, The Open Journal of Astrophysics, 8, 12, doi: 10.33232/001c.129235
-
[40]
Emonts, B. H. C., Colina, L., Piqueras-L´opez, J., et al. 2017, A&A, 607, A116, doi: 10.1051/0004-6361/201731508
-
[41]
Faber, S. M., Willmer, C. N. A., Wolf, C., et al. 2007, ApJ, 665, 265, doi: 10.1086/519294
-
[42]
French, K. D. 2021, PASP, 133, 072001, doi: 10.1088/1538-3873/ac0a59
-
[43]
D., Yang, Y., Zabludoff, A., et al
French, K. D., Yang, Y ., Zabludoff, A., et al. 2015, ApJ, 801, 1, doi: 10.1088/0004-637X/801/1/1 STARBURST TO POST-STARBURST SURVEY25
-
[44]
French, K. D., Yang, Y ., Zabludoff, A. I., & Tremonti, C. A. 2018, ApJ, 862, 2, doi: 10.3847/1538-4357/aacb2d
-
[45]
Tremonti, C. A. 2005, MNRAS, 362, 41, doi: 10.1111/j.1365-2966.2005.09321.x
-
[46]
1998, ApJ, 498, 579, doi: 10.1086/305576
Genzel, R., Lutz, D., Sturm, E., et al. 1998, ApJ, 498, 579, doi: 10.1086/305576
-
[47]
Thefractionofbinarysystemsinthecoreof13low-densityGalactic globularclusters,
Goto, T. 2007, MNRAS, 381, 187, doi: 10.1111/j.1365-2966.2007.12227.x
-
[48]
Hayward, C. C., Lanz, L., Ashby, M. L. N., et al. 2014, MNRAS, 445, 1598, doi: 10.1093/mnras/stu1843
-
[49]
Hopkins, P. F., Hernquist, L., Cox, T. J., et al. 2006, ApJS, 163, 1, doi: 10.1086/499298
-
[50]
Hunter, J. D. 2007, Computing In Science & Engineering, 9, 90, doi: 10.1109/MCSE.2007.55
-
[51]
Ilbert, O., McCracken, H. J., Le F`evre, O., et al. 2013, A&A, 556, A55, doi: 10.1051/0004-6361/201321100
-
[52]
2001–, SciPy: Open source scientific tools for Python
Jones, E., Oliphant, T., Peterson, P., et al. 2001–, SciPy: Open source scientific tools for Python. http://www.scipy.org/
2001
-
[53]
Kauffmann, G., Heckman, T. M., White, S. D. M., et al. 2003a, MNRAS, 341, 33, doi: 10.1046/j.1365-8711.2003.06291.x
-
[54]
Kauffmann, G., Heckman, T. M., Tremonti, C., et al. 2003b, MNRAS, 346, 1055, doi: 10.1111/j.1365-2966.2003.07154.x
-
[55]
Thefractionofbinarysystemsinthecoreof13low-densityGalactic globularclusters,
Kaviraj, S., Kirkby, L. A., Silk, J., & Sarzi, M. 2007, MNRAS, 382, 960, doi: 10.1111/j.1365-2966.2007.12475.x
-
[56]
Kennicutt, Robert C., J. 1998, ARA&A, 36, 189, doi: 10.1146/annurev.astro.36.1.189
work page internal anchor Pith review doi:10.1146/annurev.astro.36.1.189 1998
-
[57]
Trevena, J. 2001, ApJ, 556, 121, doi: 10.1086/321545
work page internal anchor Pith review doi:10.1086/321545 2001
-
[58]
Kewley, L. J., Groves, B., Kauffmann, G., & Heckman, T. 2006, MNRAS, 372, 961, doi: 10.1111/j.1365-2966.2006.10859.x
-
[59]
Labbe, I., Greene, J. E., Bezanson, R., et al. 2023, arXiv e-prints, arXiv:2306.07320, doi: 10.48550/arXiv.2306.07320
-
[60]
2017, MNRAS, 467, 540, doi: 10.1093/mnras/stx055
Lamperti, I., Koss, M., Trakhtenbrot, B., et al. 2017, MNRAS, 467, 540, doi: 10.1093/mnras/stx055
-
[61]
How to Measure Galaxy Star Formation Histories II: Nonparametric Models
Leja, J., Carnall, A. C., Johnson, B. D., Conroy, C., & Speagle, J. S. 2019a, ApJ, 876, 3, doi: 10.3847/1538-4357/ab133c
-
[62]
Leja, J., Johnson, B. D., Conroy, C., van Dokkum, P. G., & Byler, N. 2017, ApJ, 837, 170, doi: 10.3847/1538-4357/aa5ffe
-
[63]
Leja, J., Johnson, B. D., Conroy, C., et al. 2019b, ApJ, 877, 140, doi: 10.3847/1538-4357/ab1d5a
-
[64]
Li, Z., French, K. D., Zabludoff, A. I., & Ho, L. C. 2019, ApJ, 879, 131, doi: 10.3847/1538-4357/ab1f68
-
[65]
Lower, S., Narayanan, D., Leja, J., et al. 2020, ApJ, 904, 33, doi: 10.3847/1538-4357/abbfa7
-
[66]
Maiolino, R., Scholtz, J., Curtis-Lake, E., et al. 2024, A&A, 691, A145, doi: 10.1051/0004-6361/202347640
-
[67]
T., Almaini, O., Wild, V ., et al
Maltby, D. T., Almaini, O., Wild, V ., et al. 2018, MNRAS, 480, 381, doi: 10.1093/mnras/sty1794
-
[68]
E., Rodr´ıguez-Ardila, A., Martins, L., et al
Mason, R. E., Rodr´ıguez-Ardila, A., Martins, L., et al. 2015, ApJS, 217, 13, doi: 10.1088/0067-0049/217/1/13
-
[69]
McKee, C. F., Hollenbach, D. J., Seab, G. C., & Tielens, A. G. G. M. 1987, ApJ, 318, 674, doi: 10.1086/165403
-
[70]
Mihos, J. C., & Hernquist, L. 1994, ApJL, 431, L9, doi: 10.1086/187460 —. 1996, ApJ, 464, 641, doi: 10.1086/177353
-
[71]
Mullaney, J. R., Alexander, D. M., Fine, S., et al. 2013, MNRAS, 433, 622, doi: 10.1093/mnras/stt751 M¨uller S´anchez, F., Davies, R. I., Genzel, R., et al. 2009, ApJ, 691, 749, doi: 10.1088/0004-637X/691/1/749
-
[72]
Muzzin, A., Marchesini, D., Stefanon, M., et al. 2013, ApJ, 777, 18, doi: 10.1088/0004-637X/777/1/18
-
[73]
E., & Ferland, G
Osterbrock, D. E., & Ferland, G. J. 2006, Astrophysics of gaseous nebulae and active galactic nuclei
2006
-
[74]
A., Alatalo, K., Rowlands, K., et al
Otter, J. A., Alatalo, K., Rowlands, K., et al. 2024, ApJ, 975, 142, doi: 10.3847/1538-4357/ad793a
-
[75]
Pacifici, C., Kassin, S. A., Weiner, B. J., et al. 2016, ApJ, 832, 79, doi: 10.3847/0004-637X/832/1/79
-
[76]
M., Taj Aldeen, L., Wild, V., et al
Pawlik, M. M., Taj Aldeen, L., Wild, V ., et al. 2018, MNRAS, 477, 1708, doi: 10.1093/mnras/sty589
-
[77]
2011, Journal of Machine Learning Research, 12, 2825
Pedregosa, F., Varoquaux, G., Gramfort, A., et al. 2011, Journal of Machine Learning Research, 12, 2825
2011
-
[78]
2015, Nature, 521, 192, doi: 10.1038/nature14439
Peng, Y ., Maiolino, R., & Cochrane, R. 2015, Nature, 521, 192, doi: 10.1038/nature14439 P´erez, F., & Granger, B. E. 2007, Computing in Science and Engineering, 9, 21, doi: 10.1109/MCSE.2007.53
-
[79]
Pettini, M., Rix, S. A., Steidel, C. C., et al. 2002, ApJ, 569, 742, doi: 10.1086/339355
-
[80]
M., Smail, I., Dressler, A., et al
Poggianti, B. M., Smail, I., Dressler, A., et al. 1999, ApJ, 518, 576, doi: 10.1086/307322
discussion (0)
Sign in with ORCID, Apple, or X to comment. Anyone can read and Pith papers without signing in.